Supporting human nutrition in Africa through the integration of new and orphan crops into food systems - World Agroforestry Centre
←
→
Page content transcription
If your browser does not render page correctly, please read the page content below

Supporting human nutrition in Africa through the integration of
                   new and orphan crops into food systems
                   Placing the work of the African Orphan Crops Consortium in context

    Ian K Dawson, Prasad Hendre, Wayne Powell, Daniel Sila, Stepha McMullin, Tony Simons, Cesar Revoredo-
        Giha, Damaris A Odeny, Andrew P Barnes, Lars Graudal, Christine A Watson, Steve Hoad, Fiona Burnett,
   Alice Muchugi, James M Roshetko, Iago L Hale, Allen Van Deynze, Sean Mayes, Roeland Kindt, Ravi Prabhu,
                                   Shifeng Cheng, Xun Xu, Luigi Guarino, Howard Shapiro, Ramni Jamnadass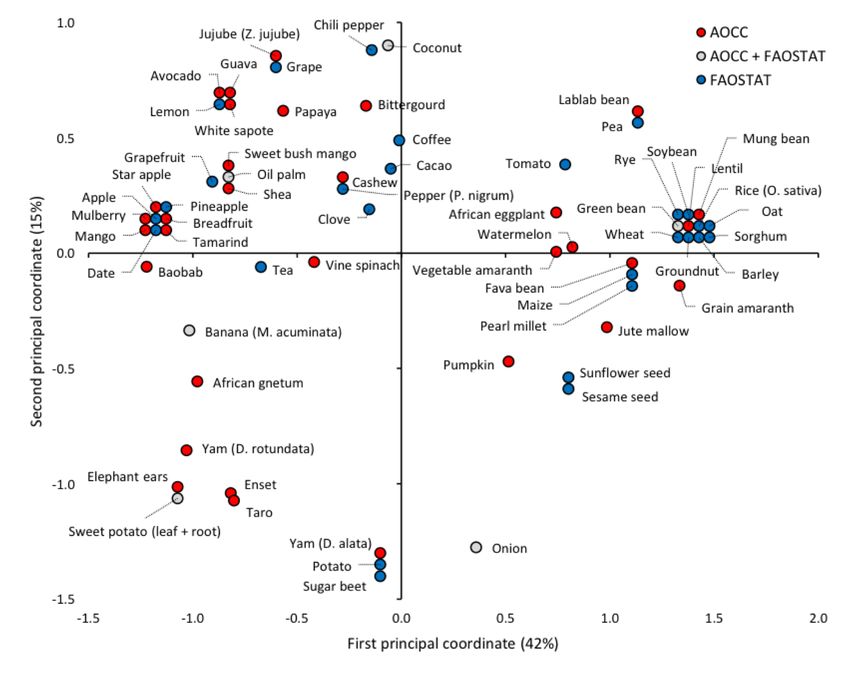
Supporting human nutrition in Africa through the integration of
                   new and orphan crops into food systems
              Placing the work of the African Orphan Crops Consortium in context

   Ian K Dawson, Prasad Hendre, Wayne Powell, Daniel Sila, Stepha McMullin, Tony Simons, Cesar
Revoredo-Giha, Damaris A Odeny, Andrew P Barnes, Lars Graudal, Christine A Watson, Steve Hoad,
     Fiona Burnett, Alice Muchugi, James M Roshetko, Iago L Hale, Allen Van Deynze, Sean Mayes,
        Roeland Kindt, Ravi Prabhu, Shifeng Cheng, Xun Xu, Luigi Guarino, Howard Shapiro, Ramni
                                                                                     Jamnadass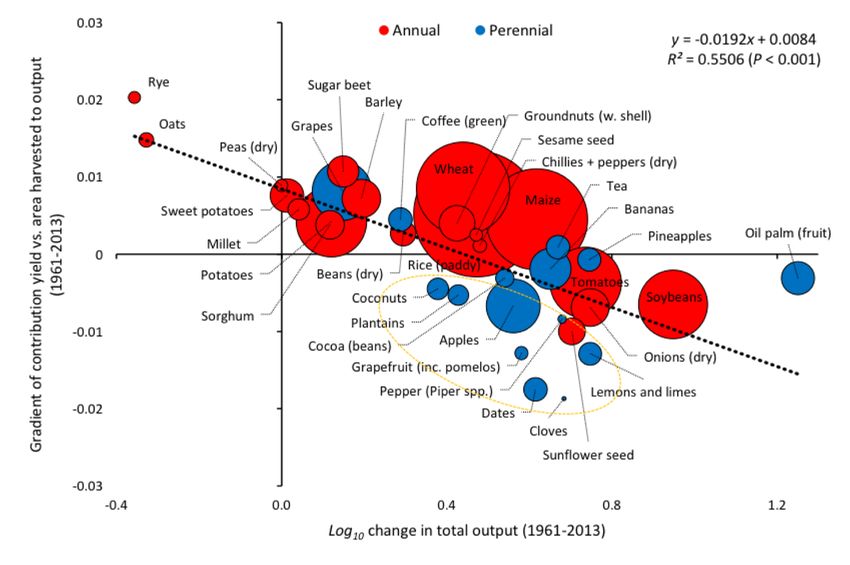
LIMITED CIRCULATION

Correct citation: Dawson IK, Hendre P, Powell W, Sila D, McMullin S, Simons T, Revoredo-Giha C,
Odeny DA, Barnes AP, Graudal L, Watson CA, Hoad S, Burnett F, Muchugi A, Roshetko JM, Hale
IL, Van Deynze A, Mayes S, Kindt R, Prabhu R, Cheng S, Xu X, Guarino L, Shapiro H, Ramni
Jamnadass R. 2018. Supporting human nutrition in Africa through the integration of new and orphan
crops into food systems: placing the work of the African Orphan Crops Consortium in context.
ICRAF Working Paper No 276. Nairobi, World Agroforestry Centre.
DOI: http://dx.doi.org/10.5716/WP18003.PDF

Titles in the World Agroforestry Centre (ICRAF) Working Paper series aim to disseminate interim
results on research and practices, and stimulate feedback from the scientific community. Other
publication series from the World Agroforestry Centre include: Technical Manuals, Occasional
Papers and the Trees for Change Series.

Published by the World Agroforestry Centre
United Nations Avenue
PO Box 30677-00100, Nairobi, Kenya
Tel: +254 20 7224000, via USA +1 650 833 6645
Email: worldagroforestry@cgiar.org
Website: www.worldagroforestry.org

© World Agroforestry Centre 2018

Working Paper No. 276

The views expressed in this publication are those of the authors.

Articles appearing in the Working Paper series may be quoted or reproduced without charge, provided
the source is acknowledged.

                                                                                                  2
TABLE OF CONTENTS

List of tables.............................................................................................................................. iv
List of figures ............................................................................................................................ iv
List of boxes.............................................................................................................................. iv
List of abbreviations & acronyms ............................................................................................. vi
Acknowledgements .................................................................................................................. vii
Abstract ...................................................................................................................................viii
1. Introduction ............................................................................................................................ 1
  1.1. Background on food systems, nutrition, and new and orphan crops in Africa ................ 1
  1.2. Objective of this Working Paper: placing AOCC in the context of African food systems2
2. A research programme for integrating new and orphan crops into African food systems .... 4
  2.1. Understanding food consumption patterns and value chains ........................................... 4
      2.1.1. Exploring relationships between consumption diversity and production diversity . 4
      2.1.2. Examining food value chain structures .................................................................... 5
      2.1.3. Defining transformation options for new and orphan crop ingredients ................... 6
  2.2. Understanding food consumption and production trends ................................................ 6
      2.2.1. Exploring the determining features of winner and loser crops in food systems ...... 6
      2.2.2. Examining the impacts of changing food consumption patterns on farming
      systems ............................................................................................................................. 11
      2.2.3. Describing cross-sectoral relationships in food systems ....................................... 13
  2.3. Understanding the value of new crop production approaches ....................................... 13
      2.3.1. Modelling new and orphan crop integration into farming systems ....................... 13
      2.3.2. Defining traits for improvement for new and orphan crops .................................. 14
      2.3.3. Exploring new and orphan crop improvement methods ........................................ 15
  2.4. Understanding food consumption and production system adoption .............................. 16
      2.4.1. Exploring the implementation of behavioural change toward new and orphan crop
      options .............................................................................................................................. 16
3. The African Orphan Crops Consortium............................................................................... 18
  3.1. The new and orphan crops of the African Orphan Crops Consortium .......................... 19
      3.1.1. Introduction to the Consortium’s new and orphan crops ....................................... 19
      3.1.2. Genomic research to date on the Consortium’s new and orphan crops ................. 21
      3.1.3. African distributions of the Consortium’s new and orphan crops and the
      availability of germplasm for research ............................................................................ 22
      3.1.4. Taxonomies and biologies of the Consortium’s new and orphan crops ................ 24
  3.2. The activities of the African Orphan Crops Consortium ............................................... 26
      3.2.1. Sequencing and resequencing of the Consortium’s new and orphan crops ........... 26
      3.2.2. The African Plant Breeding Academy ................................................................... 27
4. Conclusions and quick win activities to support the African Orphan Crops Consortium ... 28
References ................................................................................................................................ 31
Appendices............................................................................................................................... 40
  Appendix 1. Trend analysis of global FAOSTAT crop data sets ......................................... 40
  Appendix 2. Compiled database information on 101 AOCC crops...................................... 42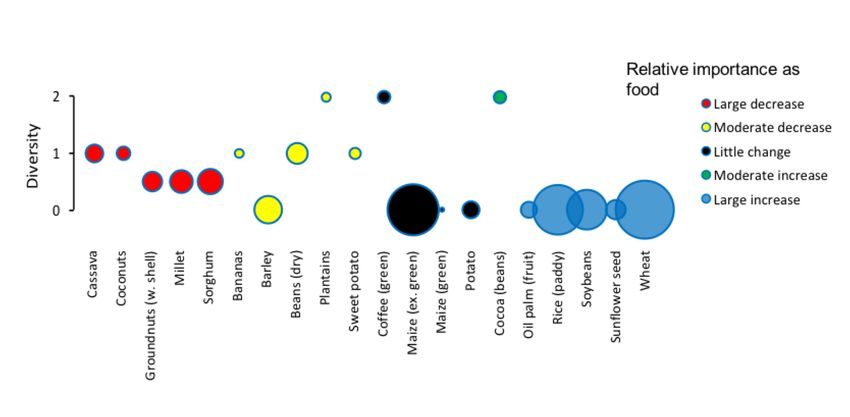
List of tables
Table 1. Latin binomials and common names of the 101 AOCC crops .................................. 20

List of figures
Figure 1. Trends in the relative contributions of yield and area to total output over a half
century time series for 35 individual crops ................................................................................ 7
Figure 2. Combined analysis of the relative contributions of yield and area harvested to the
change in total output over a half century time period for 35 crops. ......................................... 9
Figure 3. Comparisons of crop farm gate value per unit output and per hectare with changes
in total output over a half century time period for 35 crops .................................................... 10
Figure 4. The diversity of production systems for each of 20 crops, ranging from strong
winners to outright losers in the global food system, over a half century ............................... 12
Figure 5. Mainland African and Madagascan distributions of locations for AOCC species. .. 23
Figure 6. Preliminary principal coordinate analysis of biological features of a range of 66
crops to identify possible improvement pathways for AOCC species .................................... 25
Figure 7. Schematic of the assembly of genomic information for the 101 species of the
AOCC initiative. ...................................................................................................................... 27

List of boxes

Box 1. Strategies to improve diets: diversification and biofortification .................................... 2
Box 2. The value of longitudinal analysis of global FAOSTAT production data for new and
Box 3. The diversity of winner and loser crop production systems and new and orphan crop
promotion ................................................................................................................................. 12
Box 4. Glossary of biotechnology terms.................................................................................. 18
Box 5. Background on a range of AOCC-prioritised new and orphan crops .......................... 21
Box 6. An initial comparison of the biological features of AOCC species and better-
researched crops ....................................................................................................................... 25

                                                                                                                                           iv
About the authors

Ian Dawson, Prasad Hendre, Stepha McMullin, Tony Simons, Lars Graudal, Alice Muchugi,
James Roshetko, Roeland Kindt, Ravi Prabhu and Ramni Jamnadass work for the World
Agroforestry Centre (ICRAF). Ian Dawson also works for Scotland’s Rural College (SRUC)
and Lars Graudal for Forest & Landscape Denmark, the University of Copenhagen,
Frederiksberg, Denmark

Wayne Powell, Cesar Revoredo-Giha, Andrew Barnes, Christine Watson, Steve Hoad and
Fiona Burnett work for SRUC, Edinburgh, Scotland

Daniel Sila works for Jomo Kenyatta University of Agriculture and Technology, Nairobi,
Kenya

Damaris Odeny works for the International Crops Research Institute for the Semi-Arid
Tropics – Eastern & Southern Africa (ICRISAT-ESA), Nairobi, Kenya

Iago Hale works for the University of New Hampshire, Durham, USA

Allen Van Deynze works for the University of California Davis, Davis, USA

Sean Mayes works for the University of Nottingham, Nottingham, UK

Shifeng Cheng and Xun Xu work for BGI, Shenzen, China

Luigi Guarino works for The Crop Trust, Bonn, Germany

Howard Shapiro works for Mars Inc., McLean, USA and is also a Distinguished Fellow with
ICRAF

The authors are interested in research on crop and food production and/or consumption,
including of annual and perennial new and orphan crops.

                                                                                         v
List of abbreviations & acronyms

AfPBA      African Plant Breeding Academy
AOCC       African Orphan Crops Consortium
ASTI       Agricultural Science and Technology Indicators
CCAFS      CGIAR Research Program on Climate Change, Agriculture and Food Security
CFF        Crops for the Future
DFS        Diversity of Food Supply
DNA        Deoxyribonucleic acid
ENM        Ecological Niche Modelling
ESA        Eastern and Southern Africa
EU         European Union
FAO        Food and Agriculture Organization of the United Nations
GBIF       Global Biodiversity Information Facility
ICRAF      World Agroforestry Centre
ICRISAT    International Crops Research Institute for the Semi-Arid Tropics
IFAD       International Fund for Agricultural Development
IFPRI      International Food Policy Research Institute
ISPC       Independent Science and Partnership Council
JKUAT      Jomo Kenyatta University of Agriculture and Technology
LSMS-ISA   Living Standards Measurement Study-Integrated Surveys on Agriculture
NCBI       National Center for Biotechnology Information
NEPAD      New Partnership for Africa's Development
NOC        New and Orphan Crops
NRC        National Research Council
RNA        Ribonucleic Acid
SDG        Sustainable Development Goal
SNP        Single Nucleotide Polymorphism
SPIA       Standing Panel on Impact Assessment
SRA        Sequence Read Archive
SRUC       Scotland’s Rural College
SSA        Sub-Saharan Africa
UK         United Kingdom
UN         United Nations
UNICEF     United Nations Children’s Fund
US         United States of America
USDA       United States Department of Agriculture
USD        United States Dollar
WACCI      West Africa Centre for Crop Improvement
WFP        World Food Programme
WHO        World Health Organization

                                                                                 vi
Acknowledgements

This Working Paper reflects the starting point for formal reviews and specific analyses of
new and orphan crop integration into food systems. These subsequent publications will
involve a wider range of colleagues as co-authors. For their expert views shared in useful
discussions to support the current Working Paper, we particularly thank Simon Attwood
(Bioversity International and School of Environmental Sciences, University of East Anglia),
John Bradshaw (retired, ex-James Hutton Institute), Inge Brouwer (Department of
Agrotechnology and Food Sciences, Wageningen University), Sammy Carsan (ICRAF),
Richard Coe (ICRAF), Namukolo Covic (IFPRI), Eric Danquah (WACCI), Thomas Dubois
(World Vegetable Center), Douglas Gollin (Department of International Development,
University of Oxford), Andreas Gramzow (World Vegetable Center), Pete Hedley (James
Hutton Institute), John Hickey (Roslin Institute, University of Edinburgh), Benjamin Kilian
(Crop Trust), Joanna Kane-Potaka (ICRISAT), Rita Mumm (Department of Crop Sciences,
University of Illinois), Henry Ojulong (ICRISAT), Willis Owino (Department of Food
Science and Technology, JKUAT), Sarah Park (School of International Development,
University of East Anglia), Joanne Russell (James Hutton Institute), Wendy Russell (Rowett
Institute, University of Aberdeen), Keith Shepherd (ICRAF), Fergus Sinclair (ICRAF),
Jonathan Thomas (TechnoServe), Lloyd Timberlake (independent) and Tiffany Wood
(Edinburgh Complex Fluids Partnership, University of Edinburgh). These discussions helped
shape the current Working Paper, though as authors we take responsibility for the final
content and any deficiencies it contains.

Our thanks also to Betty Rabar (ICRAF) for editorial support.

ICRAF and the other CGIAR-based authors of this study gratefully acknowledge the support
of the CGIAR’s funding partners for their work (http://www.cgiar.org/about-us/our-
funders/). SRUC authors gratefully acknowledge Global Challenge Research Funding on
orphan crops.

The AOCC gratefully acknowledges financial and in-kind contributions of partners indicated
on the Consortium's website: http://africanorphancrops.org/

                                                                                         vii
Abstract
Better integrating currently under-researched nutrient-rich new and orphan crops (NOC) into
food systems could play an important role in addressing poor human diets. Understanding the
multiple interventions required to support effective integration is, however, not
straightforward. Current research to support this objective has generally been inadequate, in
large part because insufficient attention has been given to draw together the multiple
disciplines needed to explore and reach solutions. A broad interdisciplinary research
programme is needed to provide answers to the following questions: how do dietary diversity
and crop diversity interrelate at national and local food system levels? What drives crop
integration or exclusion in food systems over time? How can new technologies be embraced
in combination with best existing practices to genetically improve, better manage and more
effectively process crops? And what are the best approaches to bring about behavioural
change among farmers, food processors, consumers and other stakeholders to introduce new
practices and foods?
These questions are of particular pertinence in sub-Saharan Africa (SSA) where the problem
of ‘hidden hunger’ is especially significant. Specific initiatives such as the African Orphan
Crops Consortium (AOCC), which seeks to apply new technologies to genetically improve
101 nutritionally-important annual and perennial NOC in the region to help address hidden
hunger, have to be viewed within a food system context if they are to be effective. Here, we
explore food system issues affecting the SSA region, consider the specific crops and
interventions of the AOCC initiative, and draw out six possible ‘quick win’ knowledge-
generating activities that, if undertaken, will support AOCC objectives and NOC integration.
Through setting out research needs, our intention is to promote the creation of broad
interdisciplinary teams to carry out systems-oriented work on NOC. We also hope to
encourage other stakeholders, including funding agencies, to support this important research,
in SSA and elsewhere.
viii1. Introduction
1.1. Background on food systems, nutrition, and new and orphan crops in Africa
Global food systems that focus on an ever narrower range of calorie-rich but nutritionally-
limited crops (Khoury et al., 2014) endanger human health. Improving food nutritional
quality through measures such as diversification and biofortification (Box 1) is therefore a
key challenge (Frison et al., 2011; von Grebmer et al., 2014; SDG, 2017). The integration
into food systems of nutrient-rich new or orphan crops (NOC) is recognised to have an
important role (Gruber, 2017; Mabhaudhi et al., 2017; Tadele, 2017). These are crops that,
though locally or regionally valued by consumers and farmers, have received relatively little
attention by researchers, such that their potential for dietary improvement by contributing
important minerals, vitamins, anti-oxidants and other micro- and macro-nutrients has not
been fully explored. In the face of climate-related shocks and other global challenges that
negatively affect food security, however, diversification with NOC provides opportunities to
increase the resilience as well as the nutritional value of food systems (Altieri et al., 2015).
Sub-Saharan Africa (SSA) has some of the areas of highest ‘hidden hunger’ and nutritional
insecurity in the world, with acute deficiencies exacerbated by climate change (von Grebmer
et al., 2014). These deficiencies lead to serious developmental underachievement and disease.
Girls do not achieve proper growth and become unhealthy mothers whose ability to
breastfeed their children is compromised by continued inadequate diet, leading to
underweight babies; older children do not achieve their full potential cognitive ability;
working age men and women are unable to work due to sickness; and the elderly find it
difficult to remain active (FAO et al., 2017). Improving nutrition in SSA is therefore a
priority for national governments, who have highlighted the important role of diversification
of food production (Covic and Hendriks, 2016). At least in theory, therefore, supportive
national frameworks exist for NOC integration in the SSA region, aligning closely with UN
Sustainable Development Goals (SDGs) including SDG1 (reducing poverty through creating
value chains), SDG2 (promoting the accessibility and use of nutritious foods, promoting
sustainable agriculture), SDG11 (contributing to the food security of growing cities) and
SDG13 (providing resilience to climate change) (UN, 2017).
One measure taken in the last few years to help address nutritional deficiencies in SSA
through NOC promotion has been the establishment of the African Orphan Crops Consortium
(AOCC). This initiative supports the mainstreaming of 101 annual and perennial NOC of
nutritional importance to African consumers into SSA food systems through the application
of new genomic methods to enhance crop improvement (AOCC, 2017). The Consortium,
which was founded by ICRAF, Mars Inc., NEPAD, the University of California Davis and
the World Wildlife Fund, involves a wide array of research-oriented and development-
focused institutions, many of which are represented in the authorship of this Working Paper.
The partnership includes institutions from both public and private sectors, which work on
major and less-used crops, and that are based in high-, middle- and low-income nations, to
promote knowledge and technology transfer. The Consortium also links with initiatives such
as the CGIAR Genebank (CGIAR, 2017a) and Excellence in Breeding (CGIAR, 2017b)
platforms, the Crops for the Future (CFF, 2017) programme, DivSeek (2017; which promotes
genomic-level characterisation of the genetic diversity of crop gene pools) and specific NOC
1initiatives such as BamNetwork (2017; network for Bambara groundnut research).
The work of the Consortium has received significant international media attention
recently because of its potential and novelty (Guardian, 2016; Economist, 2017).
Box 1. Strategies to improve diets: diversification and biofortification
Diversification: this strategy for improving diets is based on widening the range of food produced by
farmers and available to consumers, under the assumption that such widening can positively influence
nutrition. It has both a qualitative component – for example, the number of crops grown and consumed
in a particular location – and a quantitative one – for example, the balance of consumption across crops,
with reference to total dietary intake and the nutritional compositions of foods. The approach is
considered to have strong advantages in the context of climate-change-related food system challenges;
for example, production diversity can contribute to food system resilience by risk spreading and through
positive stabilising interactions (Altieri et al., 2015). However, as is explored later in this Working Paper
(see section 2.1.1), just because farmers produce a more diverse range of crops it does not necessarily
mean that local consumers have a more diverse or more nutritious diet – relationships between
production and diets can be complex.
Biofortification: this strategy for improving diets involves breeding crops to be more nutritious. It is
generally applied to globally or regionally important staples that are consumed in large quantities (Birol
et al., 2016). The approach has the advantage that it is based on crops that farmers already plant and
consumers recognise, which means that there is a ready pathway to the adoption of improved varieties
and products. However, the approach does not benefit from the extra resilience that the diversification
strategy can provide.
Do NOC improve diets through diversification or biofortification? New and orphan crops with their
often excellent existing nutritional profiles provide a wide range of more nutritious food options for
consumers and therefore have an obvious role in a food-system-diversification approach to improve
diets. Some orphan crops are also often already regionally – or locally – important staples, so further
enhancing their nutritional quality in such cases represents a biofortification approach to improving
diets. The mechanisms by which NOC support nutritional improvements can involve combinations of
diversification and biofortification, as any change to an individual crop will influence the balance of
incentives for production and consumption of other crops compared to that crop. Understanding how the
consumption and production of one crop influences the consumption and production of other crops is
therefore an important research question in food systems.
1.2. Objective of this Working Paper: placing AOCC in the context of African food
systems
It has always been evident to AOCC partners that the specific work of the Consortium in
supporting crop production, while essential, is only part of what is needed to mainstream
NOC into African food systems. Almost a decade ago, Dawson et al. (2009) took an
evidence-based approach to review the existing and potential utility of biotechnology-based
approaches for promoting the use of NOC and the factors that limit impact. Genuine progress
requires that the many interconnecting factors that determine the diets of African
communities – including culture, economics, infrastructure, government policies, farming
environments and living conditions – are better understood, so that suitable interventions to
address current barriers to integration can be put in place along the entire ‘food-production-
to-use’ chain (Covic and Hendriks, 2016).
Past research on NOC in Africa and elsewhere, however, has generally focused on single
aspects of this chain, giving limited consideration to food systems in their entirety. This
fragmented approach to research has resulted in a lack of understanding of the key drivers
2involved in the integration – or, conversely, that determine the exclusion – of NOC in diets,
and many questionable assumptions about the value of particular consumption-based or
production-oriented interventions for positively influencing human health. Not surprisingly,
this has resulted in ‘solutions’ for NOC integration that when implemented have failed to
have the desired effect. A similar lack of joined-up-thinking has been evident in the
development of agricultural nutritional interventions more generally, but – possibly because
of limited consistent investment in their promotion – the situation appears to have been worse
for NOC (Ruel and Alderman, 2013).
This Working Paper aims to provide appropriate context on food systems research so that the
crucial work of the AOCC initiative is properly integrated into this context and thus enhanced
in its effectiveness. The required content of a food systems research programme is outlined in
section 2. This content has been developed and structured by wide discussion of research
needs among many different stakeholders, inside the Consortium and more widely, and by a
review of the relevant literature. The two institutions central to this ‘needs assessment’ have
been ICRAF and SRUC. Section 2 describes the types of questions that need to be addressed
to overcome existing barriers to ensure the integration of NOC into African food systems.
Through this presentation of needs, a shared perspective among scientists of different
backgrounds can be developed, allowing the creation of the broad interdisciplinary teams
needed to undertake the required research. Through the presented analysis, the intention is to
encourage funding agencies, governments, food processors and other stakeholders in both
public and private sectors to support the required work.
In section 3 of this Working Paper the work of AOCC is described in some detail, including
the crops and approaches that the initiative covers. Based on preceding sections, section 4
discusses several useful ‘quick win’ knowledge-generating activities that should be
undertaken in the near future to support the AOCC initiative.
32. A research programme for integrating new and orphan crops into African
food systems
To identify important research needs to support NOC integration into food systems, a wide
range of stakeholders were consulted, including scientists within our own and partner
institutions, as well as many other public and commercial food system specialists1. Those
consulted comprised agronomists, agricultural and social economists, behavioural change
scientists, crop conservationists, crop breeders, food technologists, food processers,
nutritionists, geographic information system specialists, and production and consumption
system modellers. The results from this consultation have been supported by a survey of the
global literature on the sustainable intensification of agricultural production systems (with
particular emphasis on references to cropping systems) and on the processes involved in food
supply and crop domestication (including the limited references available on NOC). Much of
this literature has been reviewed in other publications led by various authors of the current
study (see especially Jamnadass et al., 2015; Prabhu et al., 2015; Dawson et al., 2018). Key
texts are indicated again in this Working Paper, but for a wider understanding of these topics
the above reviews should be consulted. Based on consultations and the literature review, four
research areas that are crucial for supporting NOC integration into food systems were
identified, as outlined below. A more detailed exploration of needs in each of these research
area remains ongoing through further stakeholder and expert consultations.
2.1. Understanding food consumption patterns and value chains
2.1.1. Exploring relationships between consumption diversity and production diversity
Crucial for understanding how NOC can beneficially alter consumers’ diets is an exploration
of the sometimes complex relationships between what foods are produced and what foods are
eaten at local and national levels. Proper examination involves exploring the various contexts
of consumption, including rural, peri-urban and urban settings, as well as the age, gender,
education, cultural background and income of consumers. With this knowledge, opportunities
for influencing human diets through targeted diversification with NOC foods, and the
possible trade-offs that may need to be negotiated in devising more nutrient-rich consumption
systems, can start to be developed.
Research on this topic can utilise existing sub-national food consumption panel data sets
available for some countries (Hassen et al., 2017). These can be compared with food
composition databases to draw nutritional implications (INFOODS, 2017). There are,
however, major gaps in existing sub-national food consumption surveys for African nations,
which mean that de novo data collection is essential. Such surveys need to characterise the
seasonal availability of foods as part of the collection of socio-ecological location-specific
food production and consumption information, to devise ‘crop portfolios’ that support
nutrient provision year-round, including during traditional hunger periods (McMullin et al.,
2017). Ideally, the collection of such production and consumption data should be repeated
every few years to help assess trends (for a few fortunate African countries, there has already
been regular location-specific sampling of household consumption data; e.g., four rounds of
1
Many of those consulted are listed in the Acknowledgements section of this Working Paper.
4sampling in Ethiopia between 1995 and 2011; Hassen et al., 2017). In the absence of
resources to undertake repeat sampling, however, long-term recall data collected on a single
occasion may be useful in providing insights into previous years’ and decades’ food systems
(Shibairo et al., 2016). The importance of analysing changes in food systems over time is
explored further in section 2.2 of this Working Paper.
Existing research illustrates major factors related to food consumption patterns. Based on a
simple diversity of food supply (DFS) indicator – the share of calories supplied by non-staple
foods – Choudhury and Headey (2016) indicated that increased age, increased income and a
move from rural to urban living are all important for predicting increased DFS in a range of
countries sampled globally. They also found that time-invariant geographical and
infrastructural factors are significantly associated with DFS, corresponding with some
countries having lower or higher DFS than expected compared to their level of economic
development. Choudhury and Headey’s analysis suggests that specific measures to drive
dietary diversification could be targeted to particular portions of countries’ demographic
compositions – to young and old people, to rich and poor, and to urban and rural populations.
It also suggests particular opportunities for NOC integration into food systems where
economies are most improving and there are the greatest shifts to urban living.
Further research has sought to explore relationships between local crop diversity and
individual and household dietary diversity measures. In a review of such work, Powell et al.
(2015) found a positive association between crop diversity and dietary diversity in six of the
eight available studies that reported a relationship, supporting the utility of a nutritional
improvement strategy based on crop diversification (assuming that dietary diversity and
dietary nutritional quality are related; Lachat et al., 2018). The issue is complex, however, as
illustrated by Sibhatu et al. (2015), who found that when on-farm production diversity is
already high, the association with dietary diversity can turn negative, likely because of
foregone income benefits based on production specialisation that could have been used to
purchase food. The same authors established positive relationships between both off farm
incomes and market access – expressed in terms of lower geographic distance from farm
households to the closest food markets – and dietary diversity.
It is evident therefore that there are many issues beyond crop production diversity that
determine nearby consumers’ diets. Research priorities for future studies of the influence of
agricultural biodiversity on local nutritional outcomes include extending beyond measures of
dietary diversity to nutritional quality, at species and crop variety (sub-species) levels, and
considering scale effects (Jones, 2017).
2.1.2. Examining food value chain structures
Essential for determining how market-based interventions can best be targeted to where and
how food is purchased and produced is an understanding of how food value chains currently
function and interact for rural, peri-urban and urban African populations (Revoredo-Giha and
Renwick, 2016). The expansion of international markets for healthy foods may take on
increasing importance as SSA countries’ economies transform, but focus on local markets is
likely to be crucial when the emphasis is on domestic nutrition (Blare and Donovan, 2018).
Where local, national and international markets are all in operation, these need to be properly
coordinated so that any potential conflicts are minimised, such as vibrant export markets
pricing out access to food for domestic populations (Bellemare et al., 2016).
5Existing value chains, including their market infrastructure, socio-cultural and gender-
specific dynamics, and finances, need to be properly characterised to determine which value
chains work well – and which do not – for consumers and producers (Nang’ole et al., 2011).
An important issue is understanding structural barriers to the equitable participation of
women, who may be more involved than men in the initial production, processing and trade
of NOC foods than they are for ‘major’ crop foods, but who may be excluded by further
commercialisation (Shackleton et al., 2011).
Any impacts on NOC commodities of supply chain concentration around a few major crops
also need to be assessed. Research should also include ex ante mathematical modelling of the
factors – such as improved crop varieties, technical training, market intelligence, financial
services, infrastructure and value addition – that may lead to the upgrading of chains.
2.1.3. Defining transformation options for new and orphan crop ingredients
It is essential to identify opportunities for healthier NOC ingredients to substitute for staple
crop ingredients in processed food production. Understanding the properties of NOC
ingredients is therefore crucial. This is especially important for peri-urban and urban
populations whose diets are increasingly based on processed foods. Research involves
exploring the processing and nutritional properties of NOC ingredients, and then trialling
possible innovations for their integration with commercial food processors. For example, the
rheological properties of NOC flours mixed with wheat flour can be investigated with bakers
to determine the potential value of NOC flours in the production of bread whose dough
retains its functional properties but is of higher nutritional quality (Bakare et al., 2016).
An interesting example recently has been the exploration of the integration of edible seed oil
from the African allanblackia or vegetable tallow tree, a new domesticate on the AOCC list
(see section 3), into margarine production in Europe by Unilever and others (Allanblackia
Partnership, 2017). In this case, the interest is in the ideal melting properties of the oil, which
make it suitable for creating spreads with lower levels of saturated fats than current products,
while retaining the structure and texture that consumers expect. The food industry is
particularly interested in identifying novel functional ingredients for processed food
production. New and orphan crops, with their interesting but under-researched properties,
may present particular opportunities in this regard, when they are more fully understood.
An important avenue of research is to understand the successful features of existing
ingredient substitution initiatives. The ICRISAT-led Smart Food programme (ICRISAT,
2017) is an example that can be learnt from. This works to create a demand pull for less-
utilised crops grown in Africa and Asia by developing and promoting new food products such
as gluten-free pancake mixes, breakfast cereals, porridge flours for babies, and composite
flours for cakes and confectionaries. This work has been accompanied by media
popularisation programmes (e.g., Smart Food Reality Show, 2017).
2.2. Understanding food consumption and production trends
2.2.1. Exploring the determining features of winner and loser crops in food systems
Crucial for indicating where and how to better integrate NOC into future food systems is a
longitudinal analysis of what has driven the inclusion or exclusion of crop plants in food
systems over time. Understanding what has made some crops global ‘winners’ – with a
6relative increase in importance – and other crops ‘losers’ – with a relative decline in
importance – in food systems over the last decades and longer is, however, not
straightforward. Nevertheless, there are opportunities for researching this issue that are
presented by existing global- and country-level time series data sets on crop production and
value, and on food balances (e.g., Lywood et al., 2009; Khoury et al., 2014; Beal et al., 2017).
In their analysis of FAOSTAT food balance data from the last half century, for example,
Khoury et al. (2014) indicated that global food systems have homogenised. They suggested
this may be due to a range of factors, including: greater international trade in crops; the
increased reach of multi-national food companies; the wider adoption of more western diets;
government subsidy patterns that relatively support major crop consumption and production
over NOC; a focus on a narrow range of crop options in education; farm mechanisation; the
consolidation of plant breeding companies; and limited investments in NOC breeding.
The value of longitudinal analysis of FAOSTAT data sets for designing NOC-based food
system interventions is illustrated in Box 2. A major limitation of FAOSTAT data sets,
however, is that the maximum detail extends only to the country level, while changing
patterns in consumption and production are often sub-nationally specific (Ray et al., 2012;
Choudhury and Headey, 2016; Roser and Ritchie, 2017). Another constraint is that the
FAOSTAT food balance measure is only a proxy for actual food consumption. A further
limitation is that FAOSTAT data sets only contain limited information on specific NOC. This
further confirms the importance of de novo collection of sub-national data sets on actual food
consumption that include NOC; if long-term recall data are collected in such surveys, or if
surveys are repeated over time, they will allow for trend analysis (see section 2.1.1).
Box 2. The value of longitudinal analysis of global FAOSTAT production data for new and orphan crop
promotion
For an initial assessment of the utility of FAOSTAT data sets for understanding how to promote NOC, we
selected a wide ranging panel of 35 annual and perennial crops or crop groups and extracted global level
production information for the last half century from the online FAOSTAT portal (FAOSTAT, 2016; details of
data extraction and analysis are given in Appendix 1). Most of the 35 chosen crops are ‘major’ ones that have
been the focus of data collection, but some are orphans. For the production of each crop, we derived an index to
explore the changes in the relative contributions of ‘yield’ and ‘area’ (area harvested) to annual global output
over the last half century, and plotted the results in Figure 1.
Although the analysis revealed that not all crops have demonstrated a linear relationship in how yield and area
have supported changes in global output over the time series (apples and cloves being obvious exceptions), in
most cases a linear regression of values of the chosen index against year appeared to provide a reasonable fit for
crop profiles. This indicated that combining data across all 35 crops based on the gradients of linear regressions
of individual crop profiles and the magnitudes of total output changes over the last half century could provide
interesting insights into production trends, as is demonstrated by the plot shown in Figure 2.
Figure 1. (On next page.) Trends in the relative contributions of yield and area to total output over a half
century time series for 35 individual crops. Profiles are based on FAOSTAT (2016) production data. Calculation
of the index on the y axis is described in Appendix 1. A value > 1 indicates a greater relative contribution from
yield and < 1 a greater relative contribution from area, compared to a mean 1961-1965 baseline. The x axis
represents an annual time series 1961 to 2013, where 1961 = 0. Linear regression lines and regression
equations are shown. Crops are ordered from top left to bottom right by the total change in output over the time
series, starting with the greatest increase in output at top left (only two crops, oats and rye, at bottom right, have
seen an absolute decrease in output). For each crop, the value given in parentheses indicates the total change in
output (e.g., the value of 17.81 for oil palm [fruit] indicates that global reported output was 17.81 times greater
in 2013 than in 1961).
7Box 2 (continued) (See previous page for figure legend)
2 2 2 2 2
Oil palm (fruit) Soybeans (8.88) Lemons and limes Onions (dry) (5.59) Pineapples (5.56)
(17.81) (5.59)
0 0 0 0 0
y = -0.0031x + 0.1714 y = -0.0065x + 0.0355 y = -0.0069x + 0.0732 y = -0.0007x - 0.0058
y = -0.0129x + 0.0588
R² = 0.2045 R² = 0.8888 R² = 0.8347 R² = 0.071
R² = 0.9527
-2 -2 -2 -2 -2
0 25 50 0 25 50 0 25 50 0 25 50 0 25 50
2 2 2 2 2
Tomatoes (5.45) Sunflower seed Cloves (4.83) Pepper (Piper spp.) Tea (4.67)
(5.05) (4.78)
y = -0.0187x - 0.1186
R² = 0.5871
0 0 0 0 0
y = -0.0037x + 0.0263 y = -0.01x + 0.0202 y = -0.0084x + 0.0436 y = 0.0009x - 0.0854
R² = 0.8798 R² = 0.894 R² = 0.7572 R² = 0.0356
-2 -2 -2 -2 -2
0 25 50 0 25 50 0 25 50 0 25 50 0 25 50
2 2 2 2 2
Bananas (4.48) Maize (4.15) Dates (4.12) Grapefruit (inc. Apples (3.64)
pomelos) (3.81)
0 0 0 0 0
y = -0.0019x - 0.0158
Contributions yield vs. area harvested to output
y = 0.0045x + 0.0242 y = -0.0175x + 0.0695 y = -0.0128x + 0.0813 y = -0.0067x - 0.1719
R² = 0.5081
R² = 0.8376 R² = 0.9149 R² = 0.8544 R² = 0.3055
-2 -2 -2 -2 -2
0 25 50 0 25 50 0 25 50 0 25 50 0 25 50
2 2 2 2 2
Cocoa (beans) (3.47) Chillies + peppers Rice (paddy) (2.97) Sesame seed (2.96) Wheat (2.75)
(dry) (3.02)
0 0 0 0 0
y = -0.0031x + 0.1142 y = 0.0011x - 0.039 y = 0.0052x - 0.0142 y = 0.0025x - 0.0499 y = 0.0085x + 0.0116
R² = 0.3512 R² = 0.141 R² = 0.9485 R² = 0.4615 R² = 0.9638
-2 -2 -2 -2 -2
0 25 50 0 25 50 0 25 50 0 25 50 0 25 50
2 2 2 2 2
Plantains (2.68) Groundnuts (w. Coconuts (2.39) Beans (dry) (1.97) Coffee (green) (1.94)
shell) (2.66)
0 0 0 0 0
y = -0.0053x - 0.0158 y = 0.004x - 0.0319 y = -0.0045x - 0.0995 y = 0.0027x - 0.0019 y = 0.0045x - 0.0029
R² = 0.8103 R² = 0.8326 R² = 0.5348 R² = 0.6417 R² = 0.7213
-2 -2 -2 -2 -2
0 25 50 0 25 50 0 25 50 0 25 50 0 25 50
2 2 2 2 2
Barley (1.56) Sugar beet (1.41) Grapes (1.40) Potatoes (1.32) Sorghum (1.31)
1 0 0 0 0
y = 0.008x + 0.9206 y = 0.0107x - 0.0908 y = 0.0082x - 0.0179 y = 0.0042x + 0.0336 y = 0.0038x + 0.0533
R² = 0.789 R² = 0.7692 R² = 0.966 R² = 0.84 R² = 0.6488
0 -2 -2 -2 -2
0 25 50 0 25 50 0 25 50 0 25 50 0 25 50
2 2 2 2 2
Millet (1.10) Sweet potatoes Peas (dry) (1.00) Oats (0.47) Rye (0.44)
(1.03)
0 0 0 0 0
y = 0.0058x + 0.007 y = 0.0076x + 0.0939 y = 0.0089x + 0.0676 y = 0.0148x - 0.0778 y = 0.0203x + 0.021
R² = 0.8874 R² = 0.756 R² = 0.7397 R² = 0.9336 R² = 0.9563
-2 -2 -2 -2 -2
0 25 50 0 25 50 0 25 50 0 25 50 0 25 50
Time series, 1961 = 0
8Box 2 (continued)
Figure 2. Combined analysis of the relative contributions of yield and area harvested to the change in total
output over a half century time period for 35 crops. The analysis shown is based on FAOSTAT (2016)
production data. The graph shows values for the gradient of a linear regression of an index of the relative
contributions of yield and area in supporting crop output over a half century annual time series (values from
Figure 1) plotted against log10 values of the total change in output over the period, as described in
Appendix 1. A linear regression indicates that the relationship between the two variables is negative and
highly statistically significant. A group of nine crops where yield contributions to changes in output appear
markedly lower than the trend line are encircled. Point size is relative mean current gross production value.
Following expectations, a linear regression of the points in the profile of Figure 2 demonstrated a strong
negative gradient, and was highly statistically significant, indicating that yield increases have not been able
to ‘keep up’ with required output when increases in output have been very high over the time period (i.e.,
total output has relied more on area expansion in such cases). Of interest, however, is the position of a group
of nine crops (encircled) that have clearly performed badly compared to the complete crop panel in terms of
the relative contributions of yield to output changes over time.
Eight of the encircled crops – apple being the exception – have only a relatively low annual global gross
production value (less than USD 10 billion, with the mean for the 35 crops being USD 25 billion). Lower
gross production value could be a proxy for more limited investments in breeding and in the development
and adoption of more optimal agronomic practices for crops. This could explain the difference between
banana, which is slightly above the trend line in Figure 2, and plantain, which is well below it, as banana has
a significantly higher production value, while the two crops otherwise have rather similar biologies and are
both vegetatively propagated, and could therefore be expected to face similar breeding challenges.
Investment level, reflected in production values, may then have been an important factor in determining the
relative performance of these two crops; in future, however, the advent of new cheaper advanced breeding
methods may reduce investment barriers for NOC which could then result in significant production gains.
Of the nine ‘underperforming’ crops highlighted in Figure 2, eight are also perennial – with sunflower being
the annual crop exception, while six – cloves, coconut and sunflower being the exceptions – are generally
vegetatively propagated as grown by farmers. Whether either of these features is a determining factor in
relatively poor year-on-year yield performances is interesting to consider, as it could determine in the case of
NOC which crops and which promotion activities to target resources to. Perennial crops can also be
markedly above the trend line (cf. oil palm), indicating that they are not necessarily trapped in weak
productivity gains. Crucial, then, is to understand where new breeding methods could overcome potential
inherent biological constraints in improvement and lead to transformational opportunities.
9Box 2 (continued)
Finally, because FAOSTAT production data sets contain information on gross production value, indirect
longitudinal analysis of consumer accessibility and farmer profitability is possible. We therefore explored this
option for analysis with our 35-crop panel. In the case of consumer accessibility, we generated a proxy from
FAOSTAT data by calculating crop farm gate value per unit output. In the case of farmer profitability, we
generated a proxy from FAOSTAT data by calculating crop farm gate value per hectare. For each crop, the
change in both of these measures over the last half century was then plotted against the change in total output
(Figure 3; again, see Appendix 1 for details of analysis).
(a) (b)
0.6 1.0
Log10 change in value/unit output (1961-2013)
y = 0.05x + 0.2272
Log10 change in value/ha (1961-2013)
y = 0.0087x + 0.0125 R² = 0.0081, P = N.S
0.8
R² = 0.0004, P = N.S
0.3
0.6
0.4
0.0
0.2
-0.3 0.0
-0.4 0.0 0.4 0.8 1.2 -0.4 0.0 0.4 0.8 1.2
Log10 change in total output (1961-2013) Log10 change in total output (1961-2013)
Figure 3. Comparisons of crop farm gate value per unit output and per hectare with changes in total output
over a half century time period for 35 crops. The profiles shown are based on FAOSTAT (2016) data. Profile
a) is value per unit output and profile b) value per hectare. Graphs show log10 changes in values comparing
the start and end of the time period, as described in Appendix 1. Linear regression lines and equations are
shown, indicating no significant correlations between variables.
Theoretically, it would be possible for scenarios in which both consumers’ access and farmers’ profitability
have both increased over the time period and have been a factor in driving output expansion, but there was no
evidence of this from linear regressions of the variables in Figure 3. In fact, and perhaps contrary to
expectations, the analysis provided no indication that the proxies for accessibility and profitability are
important in driving output expansion over time.
It is proposed that the lesson for NOC promotion of this analysis of accessibility and profitability proxies for
crops is that market development interventions that stimulate demand are likely to be crucial elements of a
strategy. The current analysis expressed in Figure 3 is however preliminary and should be treated with caution,
because of the use of simple but likely limited proxy measures. The trajectories for market integration of NOC
may also be rather different to those followed by the major crops that make up most of the crop panel. More
detailed analysis is therefore required.
For the future, country-level analyses of FAOSTAT data are necessary, comparing with other reported
country-level metrics such as agricultural research investments (ASTI, 2017). At the country level, crops
demonstrating non-linear contributions from changes in yield and area to output over time (based on assessing
equivalent longitudinal profiles to those shown in Figure 1, but for individual crop-country combinations) may
be informative in guiding novel and transformative strategies for NOC integration. Our early analysis (not
shown) indicates that country-level non-linear profiles may reflect redirections in national policy toward or
away from particular agricultural production sectors and/or the opening up of once state-based production
economies to private enterprise (e.g., a large jump in coffee production in Vietnam from the 1980s, which
corresponds with a large relative increase in the contribution from area expansion rather than yield in
supporting output, may reflect the relaxation of collectivisation and the rise of private enterprise at that time).
102.2.2. Examining the impacts of changing food consumption patterns on farming systems
There is a trend to reduced heterogeneity in farming systems (Clay, 2004). In the face of this,
it is important to understand where diversification with NOC is likely to be possible and most
useful. This understanding can be supported by a longitudinal analysis of the impacts of
changing food consumption patterns on configurations of crop production across farm to
country scales. Building on the analysis of Khoury et al. (2014), we explore this issue through
our own assessment of production systems that is provided in Box 3.
Recent efforts to support consumption-based interpretations of crop configurations have been
made by overlaying nutritional contributions of specific crops on production maps (e.g., Beal
et al., 2017; Herrero et al., 2017). Herrero et al. (2017), for example, indicated that smaller
farms with greater crop diversity tend to produce a wider range of nutrients. Analysis is,
however, limited by the absence of real consumption data at the sub-national level, again
reinforcing the importance of such data collection (see section 2.1.1), and by the absence of
data on farming system changes along the important time axis.
To some extent, undertaking farm inventories along transects through agro-ecologically
transitioning landscapes, at points more and less advanced in the transition process, is a
possible approach for understanding the time dimension. Farmer-based recall surveys of
changes in crop production over time may also provide useful inputs into an analysis. Diverse
farming systems also provide important environmental services (Cardinale et al., 2012).
These services should also therefore be taken into account when considering how farming
systems change, especially how NOC could restore lost services such as nutrient cycling,
pollination and pest control (Dawson et al., 2018).
11Box 3. The diversity of winner and loser crop production systems and new and orphan crop
promotion
Khoury et al.’s (2014) food system analysis indicated varying food usage trends for specific crops over the
last half century, with some crops winners in the global food system and others losers (see also section
2.2.1). Extracted from their analysis, a panel of 20 crops was selected. These crops ranged from those with
large increases to large decreases in relative importance as human foods for any of the specific dietary
components of energy, protein and fat. The diversity of the typical production systems of which each of
these crops is part was then estimated by extracting information from Clay’s (2004) review of world
agricultural impacts on the environment. This diversity was expressed in terms of the level of
intercropping and/or retained natural biodiversity generally found within production systems (Figure 4; but
not accounting for crop rotations).
Figure 4. The diversity of production systems for each of 20 crops, ranging from strong winners to
outright losers in the global food system, over a half century time period. Strong winners are those crops
with large increases in importance over the time period, while outright losers are those with large
decreases in importance. Crops are a subset of those analysed by Khoury et al. (2014). Data on
production system diversity are expressed as the level of intercropping and/or retained natural
biodiversity in systems. Point size represents mean current production area for the crop (mean 2009-2013;
for reference purposes, the actual mean value for wheat for 2009-2013 = 220 million ha and for bananas
= 5 million ha). Dawson et al. (2018) provide further information on crop categorization.
The analysis revealed interesting features. Crops with the greatest increases in relative importance in
global food consumption systems over the last half century are generally produced in farming systems of
low diversity, illustrating the importance of – and challenges involved in – production system
diversification in a direction that is counter to current production trends.
Of the five crops in the chosen panel of 20 that had the largest increases in relative importance in global
consumption over the last half century, three (rice, wheat and soybean) are currently planted on at least 100
million ha annually, meaning that the production environments of these crops should be particular targets
for diversification to support the sustainability and resilience of food systems.
122.2.3. Describing cross-sectoral relationships in food systems
Important for defining more optimal routes for fulfilling human nutritional requirements in
the coming decades is an understanding of the relationships between the crop production
sector and other food production sectors such as livestock and aquaculture, and how these
change over time. For example, the production and per capita consumption of meat, milk and
eggs from livestock has increased hugely compared to crop foods in several locations
globally over the last half century (FAO, 2009a). Rapid growth in aquaculture (FAO 2009b)
has also occurred in some locations in recent decades. The growth in these two sectors has
resulted in increased competition for land and/or water that can be used either to raise crops
for human food or for feedstuffs, grazing, etc. (Cassidy et al., 2013).
Cross-sectoral longitudinal analysis, combined with understanding relationships between the
diversity of foods that are consumed and those that are produced in and across specific
locations (see section 2.1.1), is required to inform the nutritional profiles of the crops that will
need to be incorporated into diversified cross-sectoral food systems to maximise human
nutrition in the future. In theory, this will indicate particular opportunities for NOC with their
varied across- and within-species nutritional compositions; these opportunities need to be
grasped through effective targeting.
As well as comparing existing longitudinal sectoral data sets including those of FAOSTAT
on crops, livestock and aquaculture/fisheries, information on food-feed competition and
trade-offs is needed. The value of collecting de novo sub-national consumption data sets,
including information on past diets, was highlighted in previous sections; to enhance their
utility, these surveys should collect information across food sectors.
2.3. Understanding the value of new crop production approaches
2.3.1. Modelling new and orphan crop integration into farming systems
To determine opportunities for NOC integration into particular production settings, an
understanding of how crop combinations and other production components such as livestock
interact within farming systems is required. From a purely production perspective,
interactions can range from strongly positive to strongly negative (Yu et al., 2015). A
knowledge of the extent of interactions and their sign within specific contexts therefore helps
inform, for example, whether intercrops or crop rotations involving NOC are most
appropriate for supporting diversification, and the particular crops that should be involved.
This understanding is especially important when the objective is to diversify staple crop
production systems that occupy large land areas (see section 2.2.2).
Understanding how components interact is important at the genetic level as well as at the
species level (Hersch-Green et al., 2011), as an understanding at the genetic level can guide
the specific traits targeted in crop improvement programmes (section 2.3.2). ‘Interaction
traits’ are likely to include plant architecture and associations with nitrogen-fixing bacteria,
as well as the timings of growth, flowering and production (Litrico and Violle, 2015).
The starting point for modelling NOC integration is an understanding of existing production
systems and the interactions they contain, to evaluate how these may be complemented or
damaged by the introduction or reintroduction of NOC. In recent years, a wide range of
medium- to high-resolution production system maps have become available that can support
13You can also read