Sustainability of Public Transportation: An Examination of User Behavior to Real-Time GPS Tracking Application - MDPI
←
→
Page content transcription
If your browser does not render page correctly, please read the page content below
sustainability

Article
Sustainability of Public Transportation:
An Examination of User Behavior to Real-Time GPS
Tracking Application
Wei Chiang Chan 1, * , Wan Hashim Wan Ibrahim 2 , May Chiun Lo 1 , Mohamad Kadim Suaidi 3
and Shiaw Tong Ha 1
 1    Faculty of Economics and Business, Universiti Malaysia Sarawak, Kota Samarahan, Sarawak 94300,
      Malaysia; mclo@unimas.my (M.C.L.); revetong@gmail.com (S.T.H.)
 2    Faculty of Engineering, Universiti Malaysia Sarawak, Kota Samarahan, Sarawak 94300, Malaysia;
      wiwhashim@unimas.my
 3    Chancellery, Universiti Malaysia Sarawak, Kota Samarahan, Sarawak 94300, Malaysia; kadim@unimas.my
 *    Correspondence: ricchchan@gmail.com

 Received: 14 September 2020; Accepted: 13 November 2020; Published: 16 November 2020

 Abstract: Public transportation is an effective method of mobility that promotes cost-saving and is
 environmentally friendly. Poor public transport ridership in Malaysia is due to the unsatisfactory
 attitude of public transport users and inaccurate information on departure and arrivals. Sarawak,
 a state of Malaysia, is especially poor in ridership of public transport. A real-time Global Positioning
 System (GPS) tracking application (app) was found to be an effective tool to increase the ridership of
 public transport. Hence, a mobile app named UniBus was developed to enhance the ridership of
 public transport in Sarawak. The determinants that affect satisfaction and customer loyalty such as
 accessibility, reliability, comfort, safety, and security were all examined before and after the use of
 real-time GPS tracking app. The data was collected in Kuching, and targeted public transport users
 who used the UniBus app. The result indicated that all the mentioned variables were improved after
 using a real-time GPS tracking app. It is suggested that future studies can consider other factors such
 as service quality, availability, and perceived value as well as cover other states of Malaysia.

 Keywords: accessibility; reliability; comfort; safety and security; satisfaction; loyalty; comparison;
 before and after; real-time GPS; mobile application

1. Introduction
      Public transportation integration has been receiving extensive attention from many cities.
The government is enhancing the connectivity among various modes of transport, to ultimately
improve the overall public transportation system so that it can be a viable alternative versus private
vehicles [1]. Public transportation is recognized as one of the effective external cost-saving and
motorize travel negative effect solutions for the government while facing the problem of congestions,
over populations, high motorization, and other environmental impacts [2]. The mode of transportation
includes bus, train, taxi, ferry, etc., that allows the public to share a vehicle and move around in a
specific area [3].
      Public transportation plays a significant role in improving productivity and work opportunities,
thus, promoting public transport has been an imperative focus in many countries [2,4]. One of the
important factors to be considered when promoting public transport is travel time. Travel time links
to economic value as it can be translated into transportation cost due to few parameters such as
staff’s wage, travel condition, the practicality of the trip, etc. [5]. However, organizing a user-friendly

Sustainability 2020, 12, 9541; doi:10.3390/su12229541                     www.mdpi.com/journal/sustainability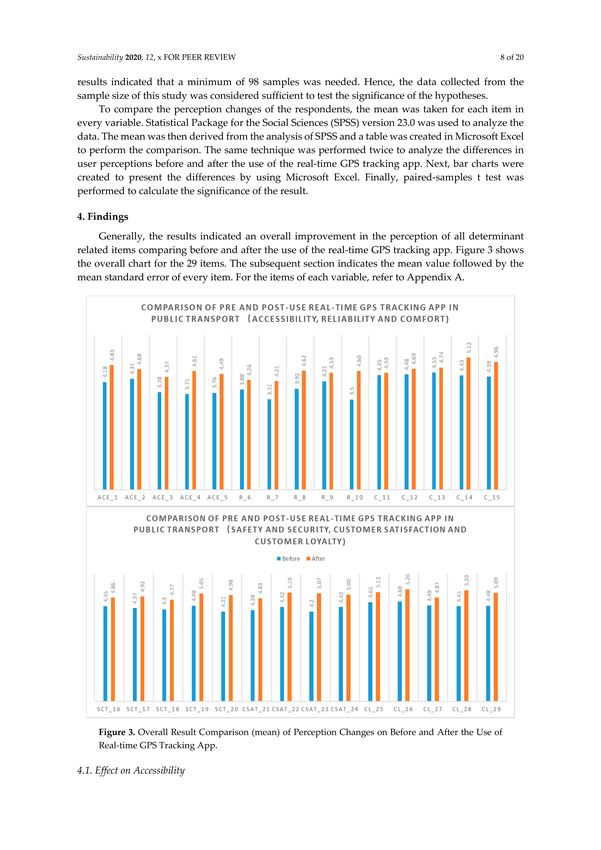
Sustainability 2020, 12, 9541                                                                         2 of 20

transport system that provides services and facilities to the public to shorten the travel time and wait
time is always a major challenge, as this system should take into consideration many aspects, including
accessibility and connectivity of the whole public transport network [2].
      Many pieces of research have been conducted aiming to increase the ridership of public transport [6–9].
Nevertheless, to date, Malaysia is still facing low ridership. One of the reasons that could deter
from using the public transport is unsatisfaction due to lack of information on arrival and departure
times [10–12]. In Sarawak, the ridership of public transportation also remains low, which leads to
heavy traffic congestions due to the increasing number of private vehicles [13,14]. A vehicle tracking
system that facilitates the journey planning of the public could be a solution to this problem [10–12].
      To boost and promote the interest of the public for using public transport, retaining the current
customers, and at the same time gaining new users is one of the most practical methods [15]. Customer
loyalty has become a key to measure the success of the businesses [16,17]. Besides that, customer
satisfaction often makes its appearance in the context of customer loyalty as it is widely recognized
that positive experiences lead to future behavior [18,19]. This is also applicable in the field of the public
transport industry [20].
      Smartphone-power technology allows the mobility to be more dynamic, especially in terms
of public transportation [21]. The mobile application (app) is recognized as a tool that can enhance
customer experience [22–24]. Other than that, as mentioned in the paragraph above, a vehicle tracking
system may be a solution to poor ridership of public transport. Hence, a real-time Global Positioning
System (GPS) tracking app—UniBus, was developed to improve public transportation ridership.
For this, there is a necessity in identifying the perception of the public transport users on before and
after the use of the mobile app, including the perception of various key factors that affect customer
loyalty, to achieve a sustainable public transportation. Therefore, this study was designed to compare
the difference in the perception of the variables such as accessibility, reliability, comfort, safety and
security, customer satisfaction, and customer loyalty before and after the use of the real-time GPS
tracking app. Besides that, this research will provide empirical evidence on the difference between
before and after the use of the real-time GPS tracking app in the public transport sector, as there is no
clear evidence indicating the perception changes in this field in Sarawak, Malaysia. Several past studies
have found that the real-time GPS tracking of public transport enhanced user satisfaction [25–28].
Despite the importance of user behaviors, the existing literature mostly focused on examining the
single factor or measures on certain variables only, such as waiting time, travel time, etc. The current
study is differing from the previous studies by including multiple key factors affecting satisfaction and
loyalty. Moreover, this study also investigates the effects of the real-time GPS tracking app on these
factors. Furthermore, there is limited study conducted to study the real-time GPS tracking app and
its impacts on the user behaviors, especially in the context of Malaysia. Hence, the current research
could contribute to the body of literature by providing empirical evidence on the user behavior before
and after the use of the real-time GPS tracking app. This study is expected to be able to provide more
insight into the changes of each determinant for the policymakers, industry players, and researchers in
decision making. For theoretical implication, this study will contribute to the number of the research
efforts in the field of customer satisfaction and loyalty. In the practical aspect, the public transport
operators can identify the most significant factors via this paper which can assist in creating new
innovations and making managerial decisions.
      The organization of the rest of the paper will start with a literature review and hypothesis
development in Section 2, followed by the methodology of the research in Section 3, including research
design, measurements, data collection processes, and data analysis. Section 4 will show the findings,
and these findings will be discussed in Section 5. Lastly, the paper will conclude with a conclusion,
limitation, and recommendation for future studies in Section 6.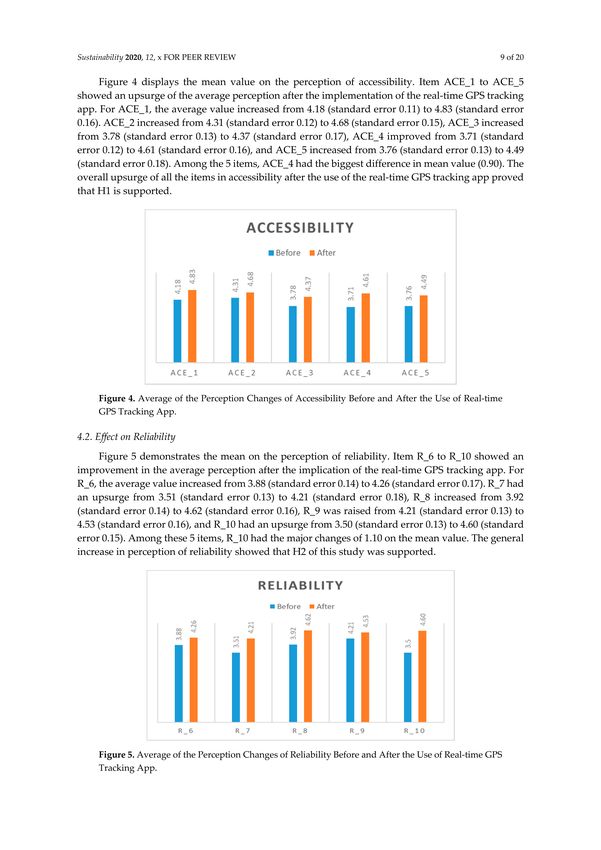
Sustainability 2020, 12, 9541                                                                            3 of 20

2. Literature Review

2.1. Accessibility
      By its means, accessibility refers to the facilitation of reaching a destination by the passenger from
a ride and get off from vehicle [29,30]. It is also one of the measurements for the transport system’s
performance in transport planning [31]. Accessibility can be measured by two elements, which are the
benefit (the location and its attractive urban opportunity) and the cost of travelling from a residential
area. An accessible area can be defined as the place which is reachable with lower travel impedance.
Public transport holds a critical role in the level of accessibility [32]. Hence, public transport accessibility
can be defined similarly, but restricted to only public transport as the mode of transportation [33].
Enhancing the accessibility of public transport is often seen as an efficient and workable method to
carry a larger volume of public transport user back and forth between big cities and rural area [34].
Accessibility of public transport also plays an important role in the sustainable development of cities,
especially on car traffic congestions and air pollution as effective and efficient public transportation
system encourages the use of public transport, which indirectly reduces the number of cars [35].
Furthermore, accessibility, connectivity, and mobility of public transport should provide a user-friendly
system for public transport users, while transport and land use policies should focus on enabling the
users to reach the destination at reasonable cost and time [36].
      Satisfaction is believed to be significantly positively impacted by accessibility to a destination [37].
It is proven in the research of a past study in regards to the factors affecting traveller’s satisfaction [38].
Furthermore, in a more recent study, the positive impact of accessibility toward travellers’ satisfaction
was also found [39]. Due to the strong relationship between accessibility and satisfaction, this study
assessed the difference between before and after the use of real-time on accessibility.

2.2. Reliability
      In the public transportation system, reliability is considered as one of the most important service
factors [40,41]. Reliability refers to the consistency of punctuality and travel time of the public transport
according to the scheduled time table [15]. Service reliability of public transportation is more important
than service frequency. This may be due to the fact that most of the public transport attributes are
inaccurate, causing extra waiting and travel time [42]. The inaccurate waiting and travel time may lead
to various negative impacts including the risk of being late, discouragement for the non-risk takers
to use public transport, and the uneven load of passengers, which result in more irregular arriving
times and frequency of public transport [43]. Moreover, reliability can affect the transport mode of
choice for commuting and non-commuting purposes [44,45]. Furthermore, public transport users’ time
of departure and route choice will be affected by the reliability of public transport due to the traffic
condition, unforeseen incidents, traffic control, and environmental factors [46]. At times, reliability of
the public transport service can be more imperative than frequency and information of public transport
to the public transport users [47].
      The satisfaction of public transport users is heavily influenced by onboard experience where it can
only be beneficial if the service provided is reliable [48,49]. This is proven in the past study indicating
that the commuters travelling with unreliable public transport have lower satisfaction than those who
travelled with reliable public transport [50]. Aside from this, it is backed by another research on the
effect of public transport reliability toward passengers’ satisfaction [51]. There is a need to examine
reliability in consideration of its positive relationship with customer satisfaction.

2.3. Comfort
     Comfort may refer to one’s pleasant or relaxing feeling to the environment [52]. It is one of
the important variables in measuring the quality and preference of public transport users [49,53].
Both physical comforts of the vehicle and ambience comfort on board or at the waiting point have
to be taken into consideration to measure public transport comfortability. Few aspects to measure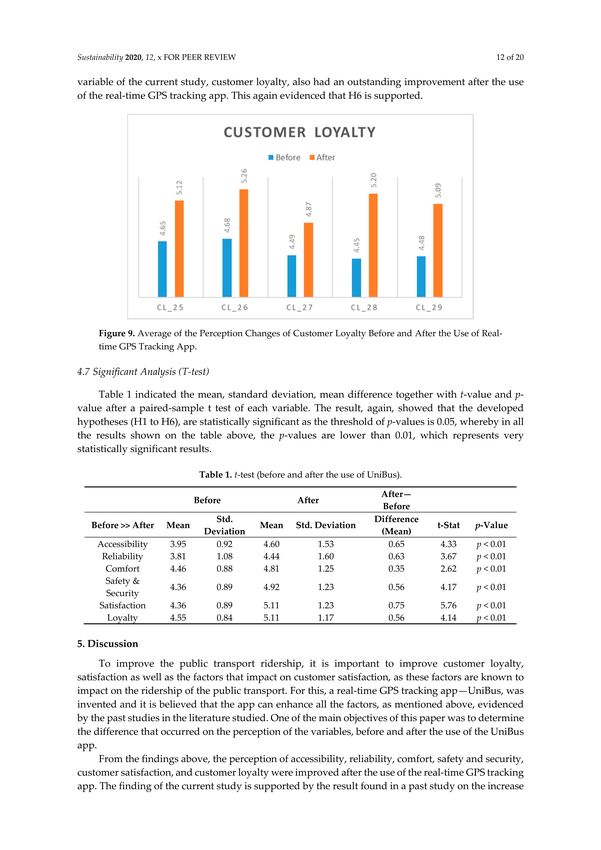
Sustainability 2020, 12, 9541                                                                           4 of 20

comfort while riding public transport, such as the functionality of passenger facilities, passenger seats,
and space, comfortability while riding (when the vehicle starts, stops, or moves), the atmosphere
of the ride (cleanliness, noise, traffic condition, etc), complimentary facilities (toilets, commercial,
communication, etc.), and ergonomic aspects [54]. Besides that, technological innovations such as
smartphones, laptop, and so on, can enhance the level of comfortability as well [55]. Comfort is the
most important attribute to interurban public transport users [56]. To achieve the highest level of
comfort and optimize the usage of rolling stock, it is compulsory to allocate the maximum number of
public transport lines [57].
     Dissatisfaction may occur if the physical comfort of the consumers’ experience does not meet
their expectation [58]. Comfort is also one of the dimension in public transport users’ satisfaction [59].
Improvement of comfort can be a strategy for public transport operators to attract more customers,
since it can impact on the overall satisfaction [60]. Thus, the public transport sector must ensure the
comfortability of the passengers. The past study figured out the positive relationship between comfort
and satisfaction in a certain user group of public transport [61]. A recent study also proved that the
concept of comfort is critical to ensure the satisfaction of public transport users [62]. Comfort as one of
the main dimension in public transport users’ satisfaction, needs to test on its effect on before and after
the use of a real-time GPS tracking app.

2.4. Safety and Security
      In public transportation, safety can be relating to the perception or feeling of the staff and
passengers that allows them to travel risk- or harm-free, whereas security means public transport’s
risk and vulnerability to experience an accident or crime. When safety and security come together in
the field of transit environment, they are very much dependent on a multi-scale condition which can
be determined by their micro-environment [63]. Safety and security in public transport are serious
concerns among various parties especially from the public transport users [64,65]. Physical offence,
risk of crime, harassment, and other inhuman behaviors have become a fear to the public transport
users which turn out to be a factor that impacts on the confidence of public transport users [66].
Safety and security are often associated with the choice of travel mode and the security problems
of frequent public transport users are more likely to happen than for the people who own a private
vehicle [67].
      Safety and security are believed to be one of the most significant factors of customer satisfaction [68].
Numerous researches are confirming the positive impact of safety and security toward satisfaction.
For instance, past research found a significant positive relation of safety and security toward
satisfaction [69]. Another study has discovered the same result on the satisfaction and loyalty
of public transport as well [70]. In regard to the positive relationship of safety and security toward
satisfaction, it is crucial to evaluate its effect after the use of a real-time GPS tracking app.

2.5. Customer Satisfaction
      In general, customer satisfaction can be defined as the consumers’ experience in terms of
pleasure or disappointment during the comparison from the received products or services and their
expectations [19,71]. If the received product or services meet the expectations, the customer is satisfied,
otherwise, the customer is dissatisfied [71]. It can be allied with the salesperson, product quality,
and consumption experiences. Usually, customer satisfaction has been view as an immediate objective
and indicator of the performance of organizations [72].
      The satisfaction of public transport users is a kind of psychological feeling occurred when
passenger expectation meets the perception of public transport service. When public transport users
take public transport, they are accepting the service provided by public transport operator, becoming
the customer and hence, measuring customer satisfaction in public transportation is measuring the
satisfaction of public transport users [73]. Besides that, customer satisfaction in public transportation
is increasingly important and widely consider in the process of planning as well as designing a public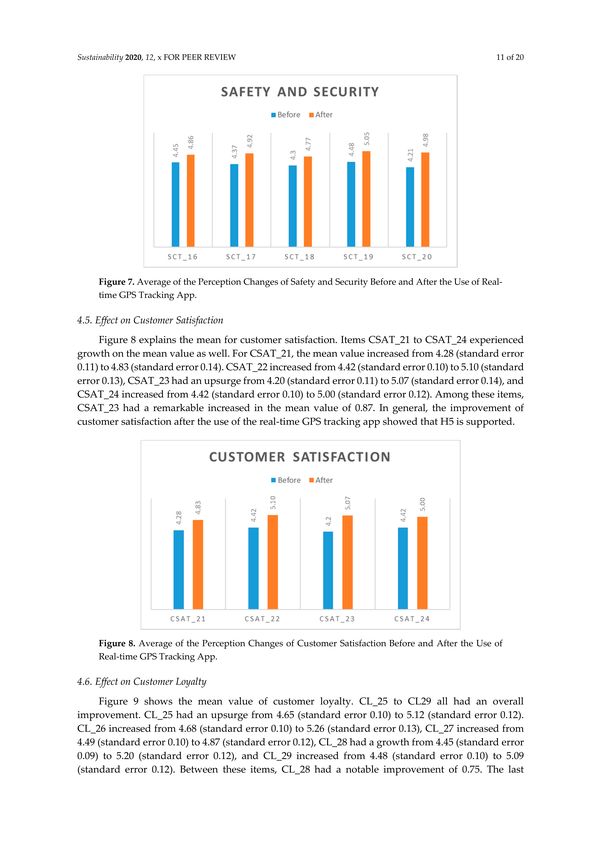
Sustainability 2020, 12, 9541                                                                           5 of 20

transport system [74]. To attract people using private vehicles to public transportations, the service
provider should ensure the satisfaction of the customer [75]. The aspects such as reliability, punctuality,
connectivity, trip time, and so on, as well as the quality of the information offered to the public transport
users, are found to be very closely related to customer satisfaction [76]. In the public transport sector,
it is found that overall satisfaction is the noteworthy precursor of loyalty [77]. Past studies suggested
that customer satisfaction is bringing a positive effect to the public transportation sector [74,78].
The unsatisfied public transport riders would like to track real-time information on public transport to
feel better [79].

2.6. Customer Loyalty
      Customer loyalty can be defined as repeat purchases or patronization on particular product brand
or services in the future which is driven by a strong sense of commitment [77]. This impact on the
repeat purchases of the product’s brand, market situation, and marketing of competitors. Generally,
loyalty is measured by three approaches which are attitude (prioritize specific brand over other brands),
behaviur (constantly repurchase), and the composite of both attitude and behavior [80]. Often, customer
loyalty has been identified by four dimensions which are word-of-mouth communication, repurchase
intention, complaining behaviour, and price sensitivity. In the service industry, loyalty tends to be more
important than the consumer goods industry [53]. The loyal customer tends to purchase a product or
service from a supplier and often recommends the people around them. It can lower the cost, increase,
and further enhance profitability [72].
      Public transportation is considered as a kind of service/product due to its competition with the
private vehicle during the decision making on the selection on the mode of transportation; hence,
it is reasonable to classify the passenger or traveller as customer [77]. As mentioned, to boost the
ridership of public transportation, customer loyalty is one of the critical factors to study. Several studies
have identified the importance of customer loyalty in public transportation. Previously, researchers
have studied customer loyalty toward GrabBike [81]. Another past study also confirmed that public
transport users demonstrated loyalty and act as an ambassador for public transport agencies [15].

2.7. Hypothesis Development
      From the literature studies above, accessibility, reliability, comfort, as well as safety and security
can directly impact customer satisfaction which will influence customer loyalty. Customer loyalty is
viewed as one of the most important criteria to boost the ridership of public transport. Past studies
found that a GPS tracking system can improve accessibility [82], reliability [83], comfort [84], safety and
security [85], and satisfaction [86]. Moreover, the public transport experience of the users can be
improved when the movement of transportation is predictable and traceable [87,88]. The improvement
of customer experience in public transport will lead to an increase in customer loyalty [89]. Therefore,
all of the mentioned factors are crucial to be investigated on the perception of before and after the
use of a real-time GPS tracking app from public transport users. Hence, the following hypotheses
were formulated:

Hypothesis 1 (H1): After the use of UniBus app, accessibility is higher than before the intervention due to
the sufficient information provided by the real-time GPS tracking features and the unique function provided by
UniBus app to its users.

Hypothesis 2 (H2): After the use of UniBus app, reliability is higher than before the intervention due to the
sufficient information provided by the real-time GPS tracking features and the unique function provided by
UniBus app to its users.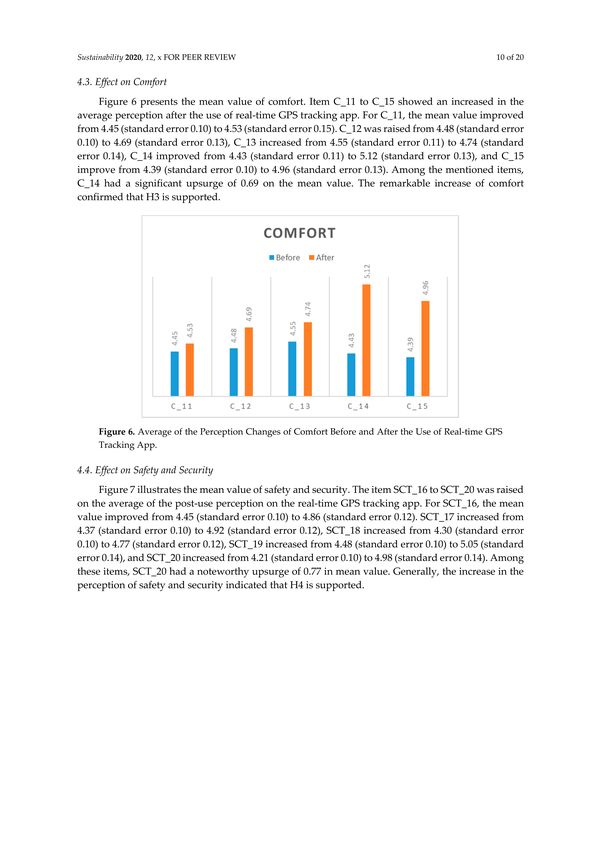
Sustainability 2020, 12, 9541                                                                               6 of 20

Hypothesis 3 (H3): After the use of UniBus app, comfort is higher than before the intervention due to the
sufficient information provided by the real-time GPS tracking features and the unique function provided by
UniBus app to its users.

Hypothesis 4 (H4): After the use of UniBus app, safety and security are higher than before the intervention due
to the sufficient information provided by the real-time GPS tracking features and the unique function provided by
UniBus app to its users.

Hypothesis 5 (H5): After the use of UniBus app, customer satisfaction is higher than before the intervention
due to the sufficient information provided by the real-time GPS tracking features and the unique function provided
by UniBus app to its users.

Hypothesis 6 (H6): After the use of UniBus app, customer loyalty is higher than before the interventio due to
the sufficient information provided by the real-time GPS tracking features and the unique function provided by
UniBus app to its users.

3. Methodology
     The UniBus app consists of 2 interfaces which are for bus operators and bus users. These two
interfaces are linked and will run concurrently on a 24/7 basis. The icon (square dot) will change to
the green triangular icon once the public transport is moving. On top of the triangular icon, car plate
number, speed, date, and time will be shown. Figure 1 illustrates the screenshots of the UniBus
app (user interface) that was developed to increase the ridership and sustain public transportation
    3.0
in Sarawak.Methodology

          Figure
      Figure       1 Screenshots
             1. Screenshots        of UniBus
                            of UniBus App (userApp  (User Real-time
                                                interface): Interface):
                                                                     GPSReal-time  GPSfortracking
                                                                         tracking App               App
                                                                                           Public Transport.
           for Public Transport
     The main features of this mobile app include tracking the real-time information of the bus, view the
current location of users, the latest routes, associated stops, and stations of the bus. The schedule of
the bus and feedback function to the operator are available too. In addition, the app can provide a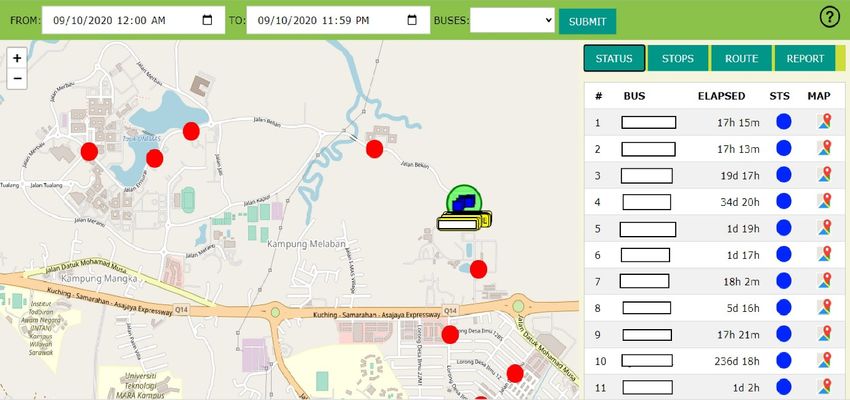
Sustainability 2020, 12, 9541 7 of 20
real-time alert to the users and operators if there are breakdowns, delay, traffic jams, and re-routing.
This allows the rider to be aware and estimate the arrival of public transport.
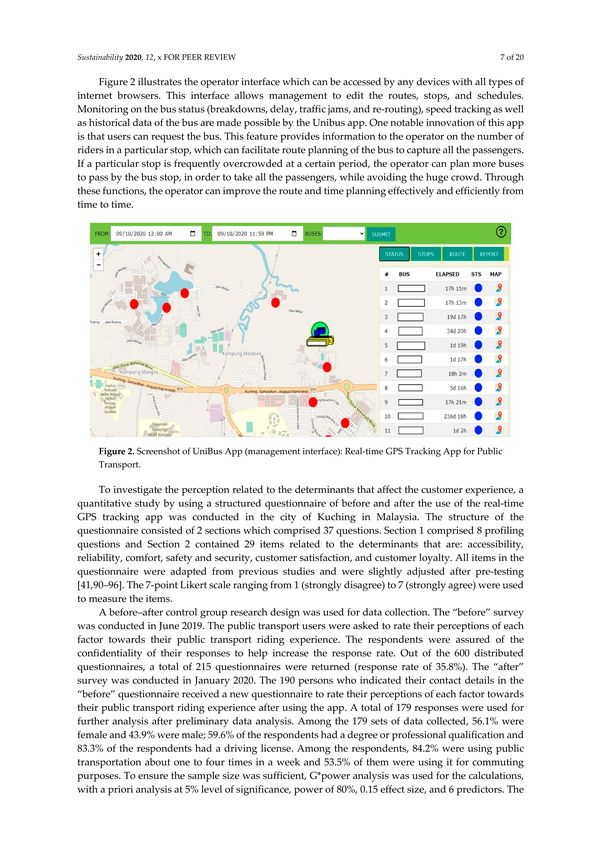
Figure 2 illustrates the operator interface which can be accessed by any devices with all types
of internet browsers. This interface allows management to edit the routes, stops, and schedules.
Monitoring on the bus status (breakdowns, delay, traffic jams, and re-routing), speed tracking as well
as historical data of the bus are made possible by the Unibus app. One notable innovation of this app
is that users can request the bus. This feature provides information to the operator on the number of
riders in a particular stop, which can facilitate route planning of the bus to capture all the passengers.
If a particular stop is frequently overcrowded at a certain period, the operator can plan more buses to
pass by the bus stop, in order to take all the passengers, while avoiding the huge crowd. Through these
functions, the operator can improve the route and time planning effectively and efficiently from time
to time.
Figure 2. Screenshot of UniBus App (management interface): Real-time GPS Tracking App for
Public Transport.
To investigate the perception related to the determinants that affect the customer experience,
a quantitative study by using a structured questionnaire of before and after the use of the real-time
GPS tracking app was conducted in the city of Kuching in Malaysia. The structure of the questionnaire
consisted of 2 sections which comprised 37 questions. Section 1 comprised 8 profiling questions and
Section 2 contained 29 items related to the determinants that are: accessibility, reliability, comfort,
safety and security, customer satisfaction, and customer loyalty. All items in the questionnaire were
adapted from previous studies and were slightly adjusted after pre-testing [41,90–96]. The 7-point
Likert scale ranging from 1 (strongly disagree) to 7 (strongly agree) were used to measure the items.
A before–after control group research design was used for data collection. The “before” survey was
conducted in June 2019. The public transport users were asked to rate their perceptions of each factor
towards their public transport riding experience. The respondents were assured of the confidentiality
of their responses to help increase the response rate. Out of the 600 distributed questionnaires, a total
of 215 questionnaires were returned (response rate of 35.8%). The “after” survey was conducted
in January 2020. The 190 persons who indicated their contact details in the “before” questionnaire
received a new questionnaire to rate their perceptions of each factor towards their public transport
riding experience after using the app. A total of 179 responses were used for further analysis after
preliminary data analysis. Among the 179 sets of data collected, 56.1% were female and 43.9% were
male; 59.6% of the respondents had a degree or professional qualification and 83.3% of the respondents
had a driving license. Among the respondents, 84.2% were using public transportation about one to
four times in a week and 53.5% of them were using it for commuting purposes. To ensure the sample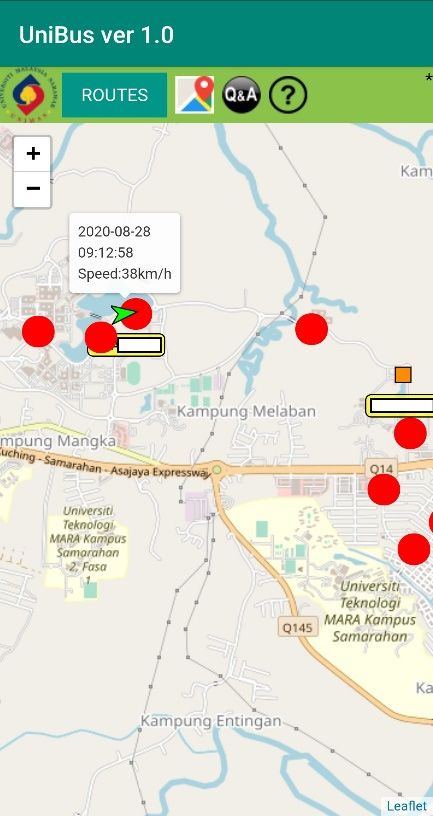
Sustainability 2020, 12, 9541                                                                       8 of 20

size was sufficient, G*power analysis was used for the calculations, with a priori analysis at 5% level of
significance, power of 80%, 0.15 effect size, and 6 predictors. The results indicated that a minimum of
98 samples was needed. Hence, the data collected from the sample size of this study was considered
sufficient to test the significance of the hypotheses.
     To compare the perception changes of the respondents, the mean was taken for each item in every
variable. Statistical Package for the Social Sciences (SPSS) version 23.0 was used to analyze the data.
The mean was then derived from the analysis of SPSS and a table was created in Microsoft Excel to
perform the comparison. The same technique was performed twice to analyze the differences in user
perceptions before and after the use of the real-time GPS tracking app. Next, bar charts were created
to present the differences by using Microsoft Excel. Finally, paired-samples t test was performed to
calculate the significance of the result.

4. Findings
     Generally, the results indicated an overall improvement in the perception of all determinant
related items comparing before and after the use of the real-time GPS tracking app. Figure 3 shows the
overall chart for the 29 items. The subsequent section indicates the mean value followed by the mean
standard error of every item. For the items of each variable, refer to Appendix A.

      Figure 3. Overall Result Comparison (mean) of Perception Changes on Before and After the Use of
      Real-time GPS Tracking App.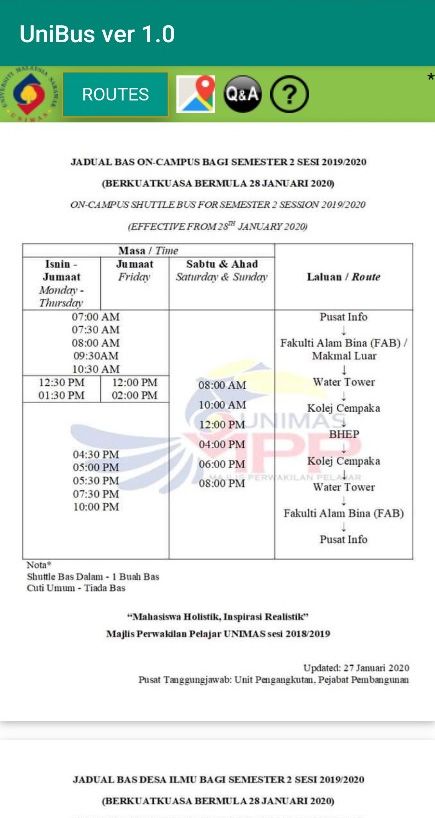
Sustainability 2020, 12, 9541                                                                            9 of 20

4.1. Effect on Accessibility
      Figure 4 displays the mean value on the perception of accessibility. Item ACE_1 to ACE_5 showed
an upsurge of the average perception after the implementation of the real-time GPS tracking app.
For ACE_1, the average value increased from 4.18 (standard error 0.11) to 4.83 (standard error 0.16).
ACE_2 increased from 4.31 (standard error 0.12) to 4.68 (standard error 0.15), ACE_3 increased from
3.78 (standard error 0.13) to 4.37 (standard error 0.17), ACE_4 improved from 3.71 (standard error 0.12)
to 4.61 (standard error 0.16), and ACE_5 increased from 3.76 (standard error 0.13) to 4.49 (standard
error 0.18). Among the 5 items, ACE_4 had the biggest difference in mean value (0.90). The overall
upsurge of all the items in accessibility after the use of the real-time GPS tracking app proved that H1
is supported.

      Figure 4. Average of the Perception Changes of Accessibility Before and After the Use of Real-time
      GPS Tracking App.

4.2. Effect on Reliability
     Figure 5 demonstrates the mean on the perception of reliability. Item R_6 to R_10 showed an
improvement in the average perception after the implication of the real-time GPS tracking app. For R_6,
the average value increased from 3.88 (standard error 0.14) to 4.26 (standard error 0.17). R_7 had an
upsurge from 3.51 (standard error 0.13) to 4.21 (standard error 0.18), R_8 increased from 3.92 (standard
error 0.14) to 4.62 (standard error 0.16), R_9 was raised from 4.21 (standard error 0.13) to 4.53 (standard
error 0.16), and R_10 had an upsurge from 3.50 (standard error 0.13) to 4.60 (standard error 0.15).
Among these 5 items, R_10 had the major changes of 1.10 on the mean value. The general increase in
perception of reliability showed that H2 of this study was supported.

      Figure 5. Average of the Perception Changes of Reliability Before and After the Use of Real-time GPS
      Tracking App.
Sustainability 2020, 12, 9541 10 of 20
4.3. Effect on Comfort
Figure 6 presents the mean value of comfort. Item C_11 to C_15 showed an increased in the
average perception after the use of real-time GPS tracking app. For C_11, the mean value improved
from 4.45 (standard error 0.10) to 4.53 (standard error 0.15). C_12 was raised from 4.48 (standard error
0.10) to 4.69 (standard error 0.13), C_13 increased from 4.55 (standard error 0.11) to 4.74 (standard error
0.14), C_14 improved from 4.43 (standard error 0.11) to 5.12 (standard error 0.13), and C_15 improve
from 4.39 (standard error 0.10) to 4.96 (standard error 0.13). Among the mentioned items, C_14 had a
significant upsurge of 0.69 on the mean value. The remarkable increase of comfort confirmed that H3
is supported.
Figure 6. Average of the Perception Changes of Comfort Before and After the Use of Real-time GPS
Tracking App.
4.4. Effect on Safety and Security
Figure 7 illustrates the mean value of safety and security. The item SCT_16 to SCT_20 was raised
on the average of the post-use perception on the real-time GPS tracking app. For SCT_16, the mean
value improved from 4.45 (standard error 0.10) to 4.86 (standard error 0.12). SCT_17 increased from 4.37
(standard error 0.10) to 4.92 (standard error 0.12), SCT_18 increased from 4.30 (standard error 0.10) to
4.77 (standard error 0.12), SCT_19 increased from 4.48 (standard error 0.10) to 5.05 (standard error 0.14),
and SCT_20 increased from 4.21 (standard error 0.10) to 4.98 (standard error 0.14). Among these items,
SCT_20 had a noteworthy upsurge of 0.77 in mean value. Generally, the increase in the perception of
safety and security indicated that H4 is supported.Sustainability 2020, 12, 9541 11 of 20
Figure 7. Average of the Perception Changes of Safety and Security Before and After the Use of
Real-time GPS Tracking App.
4.5. Effect on Customer Satisfaction
Figure 8 explains the mean for customer satisfaction. Items CSAT_21 to CSAT_24 experienced
growth on the mean value as well. For CSAT_21, the mean value increased from 4.28 (standard error
0.11) to 4.83 (standard error 0.14). CSAT_22 increased from 4.42 (standard error 0.10) to 5.10 (standard
error 0.13), CSAT_23 had an upsurge from 4.20 (standard error 0.11) to 5.07 (standard error 0.14),
and CSAT_24 increased from 4.42 (standard error 0.10) to 5.00 (standard error 0.12). Among these
items, CSAT_23 had a remarkable increased in the mean value of 0.87. In general, the improvement of
customer satisfaction after the use of the real-time GPS tracking app showed that H5 is supported.
Figure 8. Average of the Perception Changes of Customer Satisfaction Before and After the Use of
Real-time GPS Tracking App.
4.6. Effect on Customer Loyalty
Figure 9 shows the mean value of customer loyalty. CL_25 to CL29 all had an overall improvement.
CL_25 had an upsurge from 4.65 (standard error 0.10) to 5.12 (standard error 0.12). CL_26 increased
from 4.68 (standard error 0.10) to 5.26 (standard error 0.13), CL_27 increased from 4.49 (standard
error 0.10) to 4.87 (standard error 0.12), CL_28 had a growth from 4.45 (standard error 0.09) to 5.20
(standard error 0.12), and CL_29 increased from 4.48 (standard error 0.10) to 5.09 (standard error 0.12).
Between these items, CL_28 had a notable improvement of 0.75. The last variable of the current study,Sustainability 2020, 12, 9541 12 of 20
customer loyalty, also had an outstanding improvement after the use of the real-time GPS tracking app.
This again evidenced that H6 is supported.
Figure 9. Average of the Perception Changes of Customer Loyalty Before and After the Use of Real-time
GPS Tracking App.
4.7. Significant Analysis (t-Test)
Table 1 indicated the mean, standard deviation, mean difference together with t-value and
p-value after a paired-sample t test of each variable. The result, again, showed that the developed
hypotheses (H1 to H6), are statistically significant as the threshold of p-values is 0.05, whereby in all the
results shown on the table above, the p-values are lower than 0.01, which represents very statistically
significant results.
Table 1. t-test (before and after the use of UniBus).
Before After After—Before
Std. Std. Difference
Before >> After Mean Mean t-Stat p-Value
Deviation Deviation (Mean)
Accessibility 3.95 0.92 4.60 1.53 0.65 4.33 p < 0.01
Reliability 3.81 1.08 4.44 1.60 0.63 3.67 p < 0.01
Comfort 4.46 0.88 4.81 1.25 0.35 2.62 p < 0.01
Safety & Security 4.36 0.89 4.92 1.23 0.56 4.17 p < 0.01
Satisfaction 4.36 0.89 5.11 1.23 0.75 5.76 p < 0.01
Loyalty 4.55 0.84 5.11 1.17 0.56 4.14 p < 0.01
5. Discussion
To improve the public transport ridership, it is important to improve customer loyalty, satisfaction
as well as the factors that impact on customer satisfaction, as these factors are known to impact on the
ridership of the public transport. For this, a real-time GPS tracking app—UniBus, was invented and it
is believed that the app can enhance all the factors, as mentioned above, evidenced by the past studies
in the literature studied. One of the main objectives of this paper was to determine the difference that
occurred on the perception of the variables, before and after the use of the UniBus app.
From the findings above, the perception of accessibility, reliability, comfort, safety and security,
customer satisfaction, and customer loyalty were improved after the use of the real-time GPS tracking
app. The finding of the current study is supported by the result found in a past study on the increase
of the perception of accessibility [97]. This is due to the fact that the app has equipped the public
transport users with all the accurate information regarding the public transport, can facilitate for the
users the search of the nearby public transport. A recent study found that the most imperative featureSustainability 2020, 12, 9541 13 of 20
of the public transport app is the function of checking the public transport information such as routes
and schedule [98]. While information needed to locate a public transport station and public transport
schedule is handy, the accessibility of public transport will be enhanced as it is easy to be allocated by
the users. Reliability has been enhanced as well, which is reinforced by past research [99]. The reason is
that the real-time GPS tracking app provides real-time information on public transport as well as allows
public transport users to estimate the time of arrival to avoid long waiting time and uncertainty on the
arrival. Accurate time prediction can reduce the waiting time of the public transport users and they
can better plan their trip and time as they can utilize the time that was allocated for waiting to other
activities in the same time, while not missing the ride of public transport. Comfort is enhanced after
the use of real-time GPS tracking app which is tallied with the suggestion of the previous study [100].
This is because the users can request the public transport, allowing public transport operator to make
timely management on the flow of the crowd to avoid overly crowded public transport and ensuring
enough seats. This can impact a lot on the comfort of the public transport users, as the space in public
transportation and seats are available at any time when they are taking the ride, including peak hours.
Safety and security are enhanced, which is supported by the previous researches as well [101,102].
The real-time GPS tracking app provides the real-time alert function to the public transport users as well
as the management team. If there is an emergency or if an unexpected incident happens on the road,
the bus driver can press on the emergency button to alert the management team for immediate actions
which can enhance the safety and security of the public transport users. This function may provide the
psychological feeling of security to the public transport users as well as the staffs, because the timely
action can be taken whenever there is unexpected occasion by the management team. Satisfaction
is found to be increased as well, which is supported by past studies [103]. With the real-time GPS
tracking app, the public transport users feel that they are being served well, especially getting handy
information regarding the public transportation schedule from the app allowed them to pre-plan their
journey, equip a more secured, safer, and comfortable on-ride environment. The feature of the app is
adequate in providing a great experience that exceeds the expectations of the users.
Surprisingly, there is no known research on customer loyalty enhanced by a real-time GPS tracking
app of public transport. However, a past study confirmed that customer loyalty can be enhanced by a
mobile app developed by a public transportation company [104]. Additionally, past research on public
transportation suggested that the higher the satisfaction level of customer, the higher the loyalty [105].
In the current study, the result shows that customer loyalty was remarkably improved after the use of
the real-time GPS tracking app in public transportation. This means that the public transport users are
willing to repeat patronization to the same public transport company at the same cost after the use of
the real-time GPS tracking app. Moreover, public transport users intend to recommend the company
who provides the app to other people. Hence, the ridership of public transport will be improved
through a higher level of customer satisfaction and loyalty [106–108]. The reason is that maybe the
enhanced satisfaction level which is influenced by the factors of this research, is encouraging public
transport users to recommend, and re-patronize the service over and over again.
6. Conclusions
The current study has provided empirical evidence on the concept of the real-time GPS tracking app
enhancing on customer satisfaction and loyalty which will lead to the increase of public transportation
ridership. The factors affecting customer loyalty have been put to the investigation as well. Hence,
the variables including accessibility, reliability, comfort, safety and security, customer satisfaction,
and customer loyalty have been compared on the before and after use of the real-time GPS tracking
app. The results indicated that accessibility was enhanced after employing the real-time GPS tracking
app. Reliability was improved after the use of the real-time GPS tracking app. Furthermore, comfort
was enhanced through the use of the real-time GPS tracking app. Moreover, safety and security were
boosted by the real-time GPS tracking app. Overall customer satisfaction had significant improvement
too. Lastly, customer loyalty was enhanced by the real-time GPS tracking app which is a remarkableSustainability 2020, 12, 9541 14 of 20
finding of this study. All the studied variables turn out to be statisfically significant as all the p values
are lower than 0.01.
6.1. Theoretical and Practical Implication
The findings are valuable evidence for the scholars to perform further researches in the related
field, especially the noteworthy finding on customer loyalty, which was found to be strengthened by
the real-time GPS tracking app. Scholars may conduct more related researches concerning this finding.
This finding provides additional insight to the scholars who are conducting related researches,
especially in the field of public transport user behavior study. Researchers can use the findings of
the current study as a base to conduct more detailed researches. Especially the current study has
included the determinants that will affect customer satisfaction and loyalty which can equip scholars
with more in-depth information of every factor from this study on the effect of before and after the
use of the real-time GPS tracking app. Furthermore, all the variables of this study (accessibility,
reliability, comfort, safety and security, customer satisfaction, and customer loyalty) are affecting user
behavior, thus, these variables could be the pertinent variables for examining public transportation
user behaviors, especially before and after the use of the real-time GPS tracking app.
The finding of this study serves as a recommendation for industry players and policymakers in
terms of providing more information for decision making. It is especially valuable for public transport
operators in the decision making on the investment on a real-time GPS tracking app. This is because
the decision-makers would like to know the user perceptions on the real-time GPS tracking app before
investing in the app to ensure the effectiveness and the return of investment. It is important to consider
the users’ perception and behavior before embarking on the heavy investment of a real-time GPS
tracking app.
Last, but not least, information and communication technology (ICT) providers can benefit from
this study in terms of software, hardware, and business development. The ICT provider can use
this study as a base to develop new softwares and hardwares that can further enhance the user
experience. In addition, ICT providers can use this study as evidence to secure more businesses by
providing similar services to public transport operators and also creating innovations in the field of
public transportations.
6.2. Limitations of the Study and Recommendations for Future Research
Even though the objective of this study was accomplished, there are still limitations throughout
the whole study. First of all, the factors examined in this study are limited. It is recommended to
extend the study to other factors that affect satisfaction and loyalty, such as service quality, availability,
perceived value, and so on, to have a broader prospect in this field. Due to the time constraints,
the research site is limited to only Sarawak state. It is suggested to expand the research sites to other
states in Malaysia. These may help to furnish more comprehensive data to decisions makers, scholars
and policymakers by covering a broader perspective and perception of the public transport users from
different places in Malaysia.
Author Contributions: W.C.C.—Literature Review, Research Framework, Methodology, and Discussion;
W.H.W.I.—Research Design and Research Framework; M.C.L.—Research Framework and Introduction;
M.K.S.—Research Framework and Discussion; S.T.H.—Methodology and Data Analysis. All authors have
read and agreed to the published version of the manuscript.
Funding: The funding for this project was made possible through the research grant obtained from Sarawak
Multimedia Authority and Universiti Malaysia Sarawak, grant number UHSB/B-AM2018/089.
Conflicts of Interest: All authors declare that there are no conflict of interests.Sustainability 2020, 12, 9541 15 of 20
Appendix A
Table A1. Construct(s) and Measurement Item(s).
No Dimension Factors
Accessibility
ACE_1 It’s easy to find bus stop or station.
ACE_2 Walking distance to bus stop or station is reasonable.
ACE_3 The bus densely spreads over the Kuching city.
ACE_4 The adequate bus service means that there are no hard-to reach areas within Kuching city.
ACE_5 The bus allows you to easily reach anywhere you need to go.
Reliability
R_6 The bus you use is usually on time.
R_7 The waiting time for the arrival of the bus is short.
R_8 The bus you use leaves at the time according to the schedule.
R_9 The bus you use gets you to your destinations on schedule.
R_10 The bus you use is not overly crowded.
Comfort
C_11 Bus stop or station is well maintained.
C_12 Clean environment on the bus.
C_13 Comfortable temperature on the bus.
C_14 Seats are available when riding.
C_15 The equipment in the bus satisfies passengers’ needs.
Safety/Security
SCT_16 Bus company provides safe and modern buses.
SCT_17 The bus is equipped with safety facilities.
SCT_18 The company handles emergency situation properly.
SCT_19 You feel safe while taking trips via the bus.
SCT_20 You feel safe from crime where you get on and off the bus.
Customer Satisfaction
CSAT_21 The schedule and routes satisfy customers’ needs.
CSAT_22 Customers are served well.
CSAT_23 The service is better than expected.
CSAT_24 I felt enjoyable to travel by this company’s bus.
Customer Loyalty
CL_25 You would probably ride the same bus again.
CL_26 You would probably ride the same bus with the same costs.
CL_27 It would be a hassle for you to get information about other bus companies.
CL_28 You would like to travel by this bus company again.
CL_29 You would like to recommend this bus company to others.
References
1. Aziz, A.; Mohamad, J. Public Transport Planning: Local Bus Service Integration and Improvements in
Penang, Malaysia. Plan. Malays. J. 2020, 18, 179–189. [CrossRef]
2. Domènech, A.; Gutiérrez, A. A GIS-Based Evaluation of the Effectiveness and Spatial Coverage of Public
Transport Networks in Tourist Destinations. ISPRS Int. J. Geo-Inf. 2017, 6, 83. [CrossRef]
3. Le-Klähn, D.-T.; Hall, C.M. Tourist use of public transport at destinations–A review. Curr. Issues Tour. 2015,
18, 785–803. [CrossRef]
4. Chowdhury, S.; Hadas, Y.; Gonzalez, V.A.; Schot, B. Public transport users’ and policy makers’ perceptions of
integrated public transport systems. Transp. Policy 2018, 61, 75–83. [CrossRef]
5. Bonera, M.; Maternini, G.; Parkhurst, G.; Paddeu, D.; Clayton, W.; Vetturi, D. Travel experience on board urban
buses: A comparison between Bristol and Brescia. Eur. Transp. Trasp. Eur. 2020, 76, 1–12. Available online:
http://www.istiee.unict.it/sites/default/files/files/1_4_ET_39.pdf (accessed on 14 October 2020).
6. Sánchez-Atondo, A.; García, L.; Calderón-Ramírez, J.; Gutiérrez-Moreno, J.M.; Mungaray-Moctezuma, A.
Understanding Public Transport Ridership in Developing Countries to Promote Sustainable Urban Mobility:
A Case Study of Mexicali, Mexico. Sustainability 2020, 12, 3266. [CrossRef]Sustainability 2020, 12, 9541 16 of 20
7. Schütze, C.; Schmidt, N.; Liimatainen, H.; Siefer, T. How to Achieve a Continuous Increase in Public Transport
Ridership?—A Case Study of Braunschweig and Tampere. Sustainability 2020, 12, 8063. [CrossRef]
8. Liu, Y.; Wang, S.; Xie, B. Evaluating the effects of public transport fare policy change together with built and
non-built environment features on ridership: The case in South East Queensland, Australia. Transp. Policy
2019, 76, 78–89. [CrossRef]
9. Coutinho, F.M.; Van Oort, N.; Christoforou, Z.; Alonso-González, M.J.; Cats, O.; Hoogendoorn, S. Impacts of
replacing a fixed public transport line by a demand responsive transport system: Case study of a rural area
in Amsterdam. Res. Transp. Econ. 2020, 83, 100910. [CrossRef]
10. Brohi, S.N.; Pillai, T.R.; Asirvatham, D.; Ludlow, D.; Bushell, J. Towards Smart Cities Development: A Study
of Public Transport System and Traffic-related Air Pollutants in Malaysia. IOP Conf. Ser. Earth Environ. Sci.
2018, 167, 012015. [CrossRef]
11. Annuar, A. Why is Public Transport Ridership at Measly 20 Pc? Putrajaya Mulls Study; Malay Mail: Kuala Lumpur,
Malaysia, 2018; p. 1.
12. Azmi, E.A.; Nusa, F.N.M.; Rahmat, A.K. Service attributes influencing declining ridership of public rail
operation based on passenger experience survey in Klang Valley. Aip Conf. Proc. 2018, 2020, 020026.
[CrossRef]
13. Mazlan, N.A. Towards Sustainable Public Transportation System: Accessibility and Service Quality of Public Buses
in Kuching City, Sarawak; Universiti Malaysia Sarawak: Kota Samarahan, Malaysia, 2019.
14. Augustin, R. Transport Expert Hails Sarawak’s Shift from LRT to ART; Free Malaysia Today: Petaling Jaya,
Malaysia, 8 July 2020; p. 1.
15. Van Lierop, D.; Badami, M.G.; El-Geneidy, A.M. What influences satisfaction and loyalty in public transport?
A review of the literature. Transp. Rev. 2018, 38, 52–72. [CrossRef]
16. Rachmawati, I.; Jauhari, I.; Mohaidin, Z. The Influence of User Experience Toward Customer Loyalty
through Customer Based Brand Equity in Service Provider Gsm in Indonesia Indira. In Proceedings of
the 5th International Seminar and Conference on Learing Organization (ISCLO), Bandung, Indonesia,
6 September 2017; pp. 13–26.
17. Nyadzayo, M.W.; Khajehzadeh, S. The antecedents of customer loyalty: A moderated mediation model of
customer relationship management quality and brand image. J. Retail. Consum. Serv. 2016, 30, 262–270.
[CrossRef]
18. Rajesh, R. Impact of Tourist Perceptions, Destination Image and Tourist Satisfaction on Destination Loyalty:
A Conceptual Model. Pasos. Rev. Tur. Patrim. Cult. 2013, 11, 67–78. [CrossRef]
19. Kasiri, L.A.; Cheng, K.T.G.; Sambasivan, M.; Sidin, S.M. Integration of standardization and customization:
Impact on service quality, customer satisfaction, and loyalty. J. Retail. Consum. Serv. 2017, 35, 91–97.
[CrossRef]
20. Irtema, H.I.M.; Ismail, A.; Borhan, M.N.; Das, A.M.; Alshetwi, A.B. Case study of the behavioural intentions
of public transportation passengers in Kuala Lumpur. Case Stud. Transp. Policy 2018, 6, 462–474. [CrossRef]
21. Vich, G.; Delclòs-Alió, X.; Soria, J.A.; Marquet, O.; Miralles-Guasch, C. Distance Decay Effects on Public
Transportation Ridership in the Context of A Metropolitan University Campus: Evidence from the
Autonomous University of Barcelona. Geogr. Rev. 2020, 1–20. [CrossRef]
22. McLean, G.; Al-Nabhani, K.; Wilson, A. Developing a Mobile Applications Customer Experience Model
(MACE)- Implications for Retailers. J. Bus. Res. 2018, 85, 325–336. [CrossRef]
23. Belanche, D.; Flavián, M.; Pérez-Rueda, A. Mobile Apps Use and WOM in the Food Delivery Sector: The Role
of Planned Behavior, Perceived Security and Customer Lifestyle Compatibility. Sustainability 2020, 12, 4275.
[CrossRef]
24. Melero, I.; Sese, F.J.; Verhoef, P.C. Recasting the Customer Experience in Today’s Omni-channel Environment.
Universia Bus. Rev. 2016, 50, 18–37. [CrossRef]
25. Brakewood, C.; Watkins, K. A literature review of the passenger benefits of real-time transit information.
Transp. Rev. 2018, 39, 327–356. [CrossRef]
26. Katrin, K.D.; Vermeulen, H.A. Psychological Effects of and Design Preferences for Real-Time Information
Displays. J. Public Transp. 2006, 9, 1–19. [CrossRef]
27. Brakewood, C.; Barbeau, S.J.; Watkins, K. An experiment evaluating the impacts of real-time transit
information on bus riders in Tampa, Florida. Transp. Res. Part A Policy Pract. 2014, 69, 409–422. [CrossRef]Sustainability 2020, 12, 9541 17 of 20
28. Ha, S.W.; Kim, J. Designing a Scalable, Accessible, and Effective Mobile App Based Solution for Common
Mental Health Problems. Int. J. Hum. Comput. Interact. 2020, 36, 1354–1367. [CrossRef]
29. Dell’Olio, L.; Ibeas, A.; Cecin, P. The quality of service desired by public transport users. Transp. Policy 2011,
18, 217–227. [CrossRef]
30. Daniels, R.; Mulley, C. Explaining walking distance to public transport: The dominance of public transport
supply. J. Transp. Land Use 2013, 6, 5–20. [CrossRef]
31. Chaloux, N.; Boisjoly, G.; Grisé, E.; Elgeneidy, A.M.; Levinson, D.M. I only get some satisfaction: Introducing
satisfaction into measures of accessibility. Transp. Res. Part F Traffic Psychol. Behav. 2019, 62, 833–843.
[CrossRef]
32. Guzman, L.A.; Oviedo, D. Accessibility, affordability and equity: Assessing ‘pro-poor’ public transport
subsidies in Bogotá. Transp. Policy 2018, 68, 37–51. [CrossRef]
33. Luo, D.; Cats, O.; Van Lint, H.; Currie, G. Integrating network science and public transport accessibility
analysis for comparative assessment. J. Transp. Geogr. 2019, 80, 102505. [CrossRef]
34. Song, Z.; Cao, M.; Han, T.; Hickman, R. Public transport accessibility and housing value uplift: Evidence
from the Docklands light railway in London. Case Stud. Transp. Policy 2019, 7, 607–616. [CrossRef]
35. Tahmasbi, B.; Haghshenas, H. Public transport accessibility measure based on weighted door to door travel
time. Comput. Environ. Urban Syst. 2019, 76, 163–177. [CrossRef]
36. Saif, M.A.; Zefreh, M.M.; Adam, T. Public Transport Accessibility: A Literature Review. Period. Polytech.
Transp. Eng. 2018, 47, 36–43. [CrossRef]
37. Virkar, A.R.; Prita, D.M. A Review of Dimensions of Tourism Transport affecting Tourist Satisfaction. Indian J.
Commer. Manag. Stud. 2018, 9, 72. [CrossRef]
38. Woldeamanuel, M.G.; Cyganski, R. Factors Affecting Travellers’ Satisfaction with Accessibility to Public
Transportation. In Proceedings of the European Transport Conference, Glasgow, UK, 10–12 October 2011;
pp. 1–19.
39. Chin, C.-H.; Law, F.; Lo, M.-C.; Ramayah, T. The Impact of Accessibility Quality and Accommodation Quality
o n Tourists’ Satisfaction and Revisit Intention to Rural Tourism Destination in Sarawak: The Moderating
Role of Local Communities’ Attitude. Glob. Bus. Manag. Res. Int. J. 2018, 10, 115–127.
40. Outwater, M.L.; Spitz, G.; Lobb, J.; Campbell, M.; Pendyala, R.; Sana, B.; Woodford, W. “Tcrp H-37
Characteristics of Premium Transit Services that Affect Mode Choice: Summary of Phase 1”, United States,
2010. Available online: https://rosap.ntl.bts.gov/view/dot/34320 (accessed on 16 November 2020).
41. Carrel, A.; Halvorsen, A.; Walker, J.L. Passengers’ Perception of and Behavioral Adaptation to Unreliability
in Public Transportation. Transp. Res. Rec. J. Transp. Res. Board 2013, 2351, 153–162. [CrossRef]
42. Nesheli, M.M.; Ceder, A. Improved reliability of public transportation using real-time transfer synchronization.
Transp. Res. Part C Emerg. Technol. 2015, 60, 525–539. [CrossRef]
43. Jenelius, E. Public transport experienced service reliability: Integrating travel time and travel conditions.
Transp. Res. Part A Policy Pract. 2018, 117, 275–291. [CrossRef]
44. Ho, C.Q.; Hensher, D.A.; Wang, S. Joint estimation of mode and time of day choice accounting for arrival
time flexibility, travel time reliability and crowding on public transport. J. Transp. Geogr. 2020, 87, 102793.
[CrossRef]
45. Duan, L.; Tavasszy, L.; Rezaei, J. Freight service network design with heterogeneous preferences for transport
time and reliability. Transp. Res. Part E Logist. Transp. Rev. 2019, 124, 1–12. [CrossRef]
46. Chepuri, A.; Joshi, S.; Arkatkar, S.; Joshi, G.; Bhaskar, A. Development of new reliability measure for bus
routes using trajectory data. Transp. Lett. 2019, 12, 363–374. [CrossRef]
47. Barabino, B.; Cabras, N.A.; Conversano, C.; Olivo, A. An Integrated Approach to Select Key Quality Indicators
in Transit Services. Soc. Indic. Res. 2020, 149, 1045–1080. [CrossRef]
48. Tyrinopoulos, Y.; Antoniou, C. Public transit user satisfaction: Variability and policy implications.
Transp. Policy 2008, 15, 260–272. [CrossRef]
49. Hussain, B.; Torok, A. Designing the Appropriate Data Collection Method for Public Transport Passenger
Satisfaction Analysis. Int. J. Traffic Transp. Eng. 2018, 8, 177–183. [CrossRef]
50. Cantwell, M.M.; College, T.; Dublin, I.; Caulfield, B.; O’Mahony, M. Examining the Factors that Impact Public
Transport Commuting Satisfaction. J. Public Transp. 2009, 12, 1–21. [CrossRef]
51. Soza-Parra, J.; Raveau, S.; Muñoz, J.C.; Cats, O. The underlying effect of public transport reliability on users’
satisfaction. Transp. Res. Part A Policy Pract. 2019, 126, 83–93. [CrossRef]Sustainability 2020, 12, 9541 18 of 20
52. Christopher, A. A Comfort Index for Public Transportation Riders; Concordia University: Montréal, QC, Canada, 2016.
53. Mugion, R.G.; Toni, M.; Raharjo, H.H.; Di Pietro, L.; Sebathu, S.P. Does the service quality of urban public
transport enhance sustainable mobility? J. Clean. Prod. 2018, 174, 1566–1587. [CrossRef]
54. Eboli, L.; Mazzulla, G.; Pungillo, G. Measuring Bus Comfort Levels by using Acceleration Instantaneous
Values. Transp. Res. Procedia 2016, 18, 27–34. [CrossRef]
55. Kouwenhoven, M.; De Jong, G. Value of travel time as a function of comfort. J. Choice Model. 2018, 28, 97–107.
[CrossRef]
56. Hansson, J.; Pettersson, F.; Svensson, H.; Wretstrand, A. Preferences in regional public transport: A literature
review. Eur. Transp. Res. Rev. 2019, 11, 38. [CrossRef]
57. Wi˛ecek, P.; Kubek, D.; Aleksandrowicz, J.H.; Stróżek, A. Framework for Onboard Bus Comfort Level
Predictions Using the Markov Chain Concept. Symmetry 2019, 11, 755. [CrossRef]
58. Tsiotsou, R.H.; Wirtz, J. Consumer Behavior in a Service Context. In Handbook of Developments in Consumer
Behaviour; Wells, V., Foxall, G., Eds.; Edward Elgar: Cheltenham, UK, 2014; pp. 147–201.
59. Allen, J.; Muñoz, J.C.; Ortúzar, J.D.D. Understanding public transport satisfaction: Using Maslow’s hierarchy
of (transit) needs. Transp. Policy 2019, 81, 75–94. [CrossRef]
60. Barabino, B.; Coni, M.; Olivo, A.; Pungillo, G.; Rassu, N. Standing Passenger Comfort: A New Scale for
Evaluating the Real-Time Driving Style of Bus Transit Services. IEEE Trans. Intell. Transp. Syst. 2019, 20,
4665–4678. [CrossRef]
61. Ingvardson, J.B.; Ingvardson, J.B. The relationship between norms, satisfaction and public transport use:
A comparison across six European cities using structural equation modelling. Transp. Res. Part A Policy Pract.
2019, 126, 37–57. [CrossRef]
62. Ibrahim, A.N.H.; Borhan, M.N.; Yusoff, N.I.M.; Ismail, A. Rail-based Public Transport Service Quality and
User Satisfaction—A Literature Review. Promet Traffic Transp. 2020, 32, 423–435. [CrossRef]
63. Lois, D.; Monzón, A.; Hernández, S. Analysis of satisfaction factors at urban transport interchanges:
Measuring travellers’ attitudes to information, security and waiting. Transp. Policy 2018, 67, 49–56. [CrossRef]
64. Todd, T.L. Victoria Transport Policy Institute A New Transit Safety Narrative. J. Public Transp. 2014, 17,
114–135. [CrossRef]
65. Imam, R. Measuring Public Transport Satisfaction from User Surveys. Int. J. Bus. Manag. 2014, 9, 106.
[CrossRef]
66. Sham, R.; Wahab, S.N.; Anuar, M.M.; Hong, T.W.; Tan, Y.J. Safety Indicator for Taxi Users in Urban Area.
Int. J. Supply Chain Manag. 2019, 8, 1035–1041.
67. Rundmo, T.; Nordfjærn, T. Judgement of Transport Security, Risk Sensitivity and Travel Mode Use in Urban
Areas. Sustainability 2019, 11, 1908. [CrossRef]
68. Geetika, S.N. Determinants of Customer Satisfaction on Service Quality: A Study of Railway Platforms in
India. J. Public Transp. 2010, 13, 97–113. [CrossRef]
69. Agarwal, R. Public Transportation and Customer Satisfaction. Glob. Bus. Rev. 2008, 9, 257–272. [CrossRef]
70. Ha, S.T.; Ibrahim, W.H.W.; Lo, M.c.; Mah, D.Y.S. Factors Affecting Satisfaction and Loyalty in Public Transport
using Partial Least Squares Structural Equation Modeling (PLS-SEM). Int. J. Innov. Technol. Explor. Eng. 2019,
8, 569–575. [CrossRef]
71. Amin, M. Internet banking service quality and its implication on e-customer satisfaction and e-customer
loyalty. Int. J. Bank Mark. 2016, 34, 280–306. [CrossRef]
72. Kamaruddin, R.; Osman, I.; Pei, C.A.C. Customer Expectations and its Relationship Towards Public Transport
in Klang Valley. J. Asian Behav. Stud. 2017, 2, 29. [CrossRef]
73. Zhang, C.; Liu, Y.; Lu, W.; Xiao, G. Evaluating passenger satisfaction index based on PLS-SEM model:
Evidence from Chinese public transport service. Transp. Res. Part A Policy Pract. 2019, 120, 149–164.
[CrossRef]
74. Börjesson, M.; Rubensson, I. Satisfaction with crowding and other attributes in public transport. Transp. Policy
2019, 79, 213–222. [CrossRef]
75. Nguyen, X.P. The Bus Transportation Issue and People Satisfaction with Public Transport in Ho Chi Minh
City. J. Mech. Eng. Res. Dev. 2019, 42, 10–16. [CrossRef]
76. Cordera, R.; Nogués, S.; González-González, E.; Dell’Olio, L. Intra-Urban Spatial Disparities in User
Satisfaction with Public Transport Services. Sustainability 2019, 11, 5829. [CrossRef]You can also read