Sustainable City: Energy Usage Prediction Method for Electrified Refuse Collection Vehicles - MDPI
←
→
Page content transcription
If your browser does not render page correctly, please read the page content below
smart cities
Article
Sustainable City: Energy Usage Prediction Method
for Electrified Refuse Collection Vehicles
Rui Zhao 1 , Tudor Stincescu 1 , Erica E. F. Ballantyne 2, *      and David A. Stone 1
 1    Department of Electronic and Electrical Engineering, The University of Sheffield, Sir Frederick
      Mappin Building, Mappin Street, Sheffield S1 3JD, UK; r.zhao@sheffield.ac.uk (R.Z.);
      tstincescu1@sheffield.ac.uk (T.S.); d.a.stone@sheffield.ac.uk (D.A.S.)
 2    Sheffield University Management School, The University of Sheffield, Conduit Road, Sheffield S10 1FL, UK
 *    Correspondence: e.e.ballantyne@sheffield.ac.uk; Tel.: +44-114-222-3378

 Received: 28 August 2020; Accepted: 18 September 2020; Published: 21 September 2020

 Abstract: With the initiative of sustainable smart city space, services and structures (3S), progress
 towards zero-emission municipal services has advanced the deployment of electric refuse collection
 vehicles (eRCVs). However, eRCVs are commonly equipped with oversized batteries which not
 only contribute to the majority of the weight of the vehicles but also remain a consistent weight,
 independent of the stage of charge (SoC), thus crucially jeopardising the significance of eRCVs in
 sustainability and economic strategies. Hence, customising the battery capacity in such a way that
 minimises its weight while storing ample energy for stalwart serviceability could significantly enhance
 its sustainability. In this study, taking only addresses as input, through an emergent two-stage data
 analysis, the energy required to collect refuse from a group of addresses was predicted. Therefore,
 predictions of the battery capacity requirement for the target location are possible. The theories and
 techniques presented in this paper were evaluated using real-life data from eRCV trials. For the
 same group of addresses, predicted results show an averaged error rate of 8.44%, which successfully
 demonstrates that using the proposed address-driven energy prediction approach, the energy required
 to collect refuse from a set of addresses can be predicted, which can provide a means to optimise the
 vehicle’s battery requirement.

 Keywords: eRCV; route planning; energy prediction

1. Introduction
     As shown in the statistics published on March 2020, greenhouse gas (GHG) emissions from the UK
transportation sector accounted for over 27 per cent of all UK GHG emissions [1], while the petroleum
burned in internal combustion engines (ICEs) accounted for around 43 per cent of GHG emissions from
the overall figure of the year 2019 [1]. Although refuse collection vehicles are only a limited proportion
of the 0.5 million heavy goods vehicles (HGVs) registered in Great Britain, the significance of GHG
emissions from HGVs has been amplified due to the large increase in new battery-electric cars [2].
Recent studies show that UK households generate over 28 million tonnes of waste yearly, along with
other waste, most of which is sent to incinerators or landfills or used for recycling [3]. However,
regardless of these waste management methodologies, the reverse supply chain relies on the collection
and transportation of waste, which rely heavily on refuse collection trucks. In 2017, the demand for
new supplementary refuse collection vehicles (RCVs) increased by more than 20 per cent [4].
     Diesel-fuelled internal combustion is a tried and tested vehicle propulsion technology, used by
waste collection vehicles across the UK and around the world. However, with research demonstrating
the importance of sustainability in achieving a smart city [5], the progress towards net-zero greenhouse
gas emissions [6] necessitates its demise. Like any typical HGV, an RCV’s energy consumption and

Smart Cities 2020, 3, 1100–1116; doi:10.3390/smartcities3030054                www.mdpi.com/journal/smartcities
Smart Cities 2020, 3                                                                                  1101

corresponding emissions are significant. Current literature shows that an RCV can consume over
540 million litres of fossil fuels per year [7]. In conjunction with considerably high energy consumption,
tailpipe emissions also have proven contributions to global hazardous gas accumulation. With their
support for sustainability as well as international agreements including the Paris Agreement of 2015,
both the UK and other major powers have been committed to reducing their GHG emissions [8]. In order
to reduce the environmental impacts introduced from municipal waste collection, RCVs powered
by alternative energy sources, such as compressed natural gas (CNG) and hybrid hydraulic systems,
have been introduced. Although the deployment of CNG-RCVs in the US is rising [9], RCVs in the
UK are still rarely powered by natural gas. However, literature shows that the tailpipe emission of a
CNG-RCV is, in fact, higher than a diesel RCV, since the fuel efficiency of a CNG engine is significantly
lower than a diesel-powered internal combustion engine (ICE) [10]. Further, the escaped and unburned
natural gas from both the CNG fleet and refuelling infrastructure also contributes a large amount of
GHG emissions as the global warming potential of natural gas is 34 times higher than that of carbon
dioxide [11]. Considering that each CNG refuelling station can only support 20–30 RCVs, has its own
environmental impacts and may have leakages or other forms of pollution [10,12], the environmental
benefits, from the GHG reduction point of view, are scant. Greater than 70% of a hydraulic hybrid
RCV’s braking energy can be recovered [13]; however, its energy is still sourced initially from the
combustion of fossil fuels.
      As a means of driving a vehicle, electric motors have an extended history compared with ICEs.
Over the last decade, there has been a significant increase in the adoption of electric vehicle (EV)
powertrains [12,13]. These are shown to be less polluting with a smaller carbon footprint when
compared to their traditional ICE counterparts, and the growth of renewable energies means that
the GHG emissions relating to electricity generation are dwindling. In addition to its environmental
benefits, the electric refuse truck could also offer significant financial benefits. Published articles
indicate that operating electric refuse truck fleets could produce a daily fuel reduction of 100,000 litres
for waste management operators with 800 vehicles [14], and the economic significance may become
increasingly apparent with higher levels of fossil fuel prices [15]. The Department for Energy and
Climate Change, UK, predicts that the mean fuel price will be increased by at least 22 percent from
2012 through 2030 [16], whilst other reports also indicate the prices of fossil fuels continuing to
rise in the near-term [17]. In addition to a reduced operation cost, the costs of initial infrastructure
such as charging stations will also become lower, further emphasising the cost benefits of operating
electric-powered RCV fleets.
      However, large scale application of electric refuse collection vehicles (eRCVs) remains rarely seen
on the market. On the one hand, an all-electric RCV can be three times the price of a conventional diesel
RCV [10], mainly caused by its expensive battery pack and corresponding management system. On the
other hand, worldwide research shows that an electric vehicle is generally four times the weight of a
similar ICE vehicle, mainly due to its onboard energy storage components. Therefore, a considerable
amount of energy is consumed to operate the RCV itself to maintain traction [10]. Hence, for an
electric waste truck, optimising and reducing the weight of its onboard energy storage system could
significantly improve its fuel economy while reducing its initial procurement cost.
      When operating a fleet of conventional diesel-power RCVs, a waste management operator could
control the amount of diesel refuelled in advance of the collection round to minimise the energy wasted
caused by carrying superfluous fuels. Considering vehicle fuel tanks are commonly constructed from
thin layers of metal or polyethene [18], their weight is relatively low when compared to their contents.
These characteristics provide the flexibility and efficacy to optimise the kerb weight of an RCV by
adjusting its fuel level. However, when operating a fleet of electric waste trucks, this strategy no
longer applies. Firstly, electric collection vehicles use secondary batteries such as lithium batteries
as a replacement technology to deliver energy [19], which means the weight of the energy storage
system (battery) is permanent, therefore pre-determining the kerb weight of an eRCV that cannot be
adjusted by changing its ”fuel” level (the state of charge). Secondly, the modern vehicle battery pack is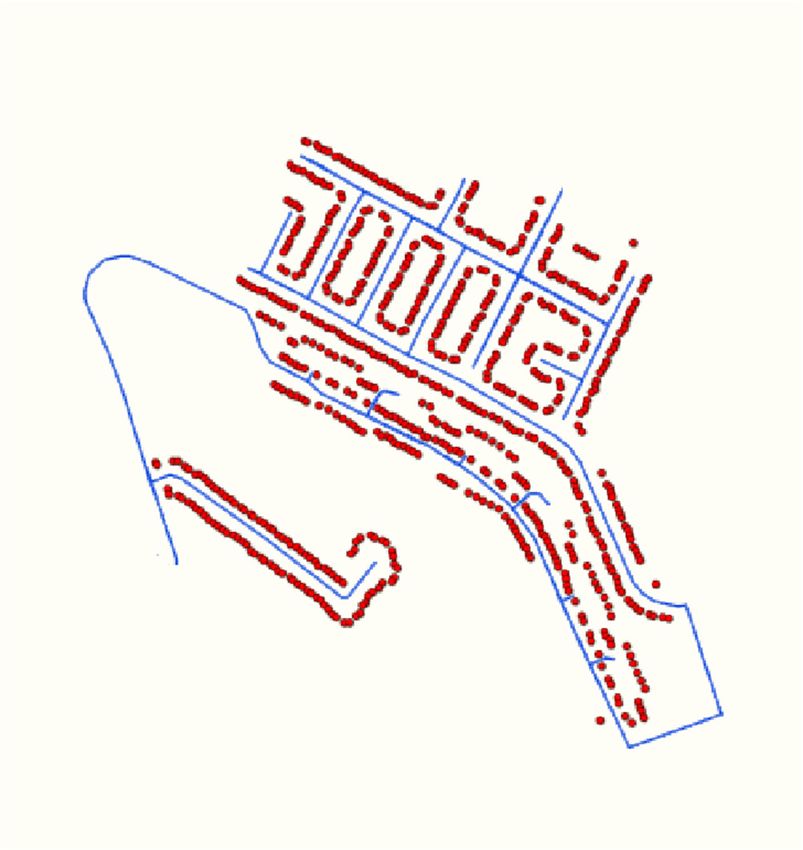
Smart Cities 2020, 3                                                                                   1102

internally modularly designed using industrial standard battery cells [20], which naturally provide
customer designed battery capacity without profoundly affecting the ease of manufacture.
      However, in order to moderately optimise the battery capacity, the minimum energy required to
operate the desired collection service is preconditioned. Even though pre-defined driving cycles are
commonly used for measuring tailpipe emissions and fuel economy of small-sized passenger cars [21],
the waste collection vehicle, commonly working under conditions such as low speed and frequent
stop-start cycles, is expected to produce inconsistent results when tested or simulated under these
driving cycles. Meanwhile, street characteristics and urban terrain have been recognised as additional
critical factors for driving energy calculation [22]. These characteristics trends are distinctive among
cities; thus, definitive studies and calculations are preferred. Although research has demonstrated
the advantage, technology and strategy of utilising sensors to collect data for analytical purposes [23],
the nature of this proposed energy prediction restricts the methodology to being static data driven,
since it is a solution that relies on addresses and GIS databases.
      In order to effectively analyse the energy usage of a desired eRCV fleet, in this paper, comprehensive
analyses and calculations, driven by both geographic data and collection addresses, are presented.
The approach proposed in this paper can be classified into two stages, converting addresses to a
simulated drive route and then calculating the energy usage of this simulated route. To begin with,
a methodology is proposed for producing a simulated driving route, representing an electric collection
truck’s departure from the depot, the collection from a given group of addresses, and finally the drive
back to the depot. Next, a vehicle designated model, which calculates the energy usage from the
previously generated drive route, is outlined. By combining the algorithm of route generation with
the model of energy usage calculation, this paper demonstrates how the exact amount of energy to
collect from a given set of address is predicted. The paper also contains a brief overview of modern
route-finding and vehicle modelling techniques specific to electric vehicles.

2. Materials and Methods

2.1. Current Collection Vehicle Development and Electric Transition
     In cities like London, there are more than 500 collection vehicles on the road every day [24],
operated by local councils and waste management enterprises. An RCV generally operates a low-speed
duty-cycled profile on restricted residential areas, and together with the onboard equipment used
for bin lifting and waste compression, the energy consumption is considerably high [9].Due to its
frequent start-stop manoeuvres, low average speed and considerably high payload, the RCV consumes
significantly more energy even compared with a conventional heavy goods vehicle. A case study for the
Royal Borough of Greenwich’s fleet shows that a 26 ton diesel powered refuse truck, when operating
in an urban environment, consumes up to nearly 1 litre of diesel per kilometre [25]. Furthermore,
those products of combustion, such as carbon dioxide and nitrogen oxides, lead to substantial
environmental influences. When utilising fossil fuels, such as petroleum diesel, which is constructed
by alkanes, cycloalkanes and aromatic hydrocarbons, up to 25 carbon atoms per molecule, a significant
amount of carbon dioxide is exhausted as the primary product from the oxidation reactions [26]. In the
meantime, the burning of aromatic hydrocarbons also produces gases such as nitrogen oxide which
contribute to poor air quality. Furthermore, the combustion also produces particulate matter that may
also be a primary pollutant in urban areas. Research shows that long-term exposure to NOx and PM2.5
could result in reduced life expectancy among the public [27].
     Refuse collection has a variety of structural advantages, making it suitable for electric transition,
especially when compared with other heavy transportation or collection vehicles. On the one hand,
an electric RCV that is purely powered by battery technology does not generate tailpipe emissions,
thus keeping pollution away from the urban area. On the other hand, its frequent start-stop nature can
be easily achieved when driven by electric motors. The instant torque can provide extra control when
starting, while the braking energy can be easily regenerated by charging the battery. The European
Smart Cities 2020, 3                                                                                 1103

Commission is working dynamically in promoting the adoption of new energy-efficient vehicles,
including eRCVs. In the UK, some waste management operators have begun the electrification process
to convert their conventional RCV fleets. A local London council has started to trial eRCVs and has
been swapping their in-service vehicles in a variety of locations [28]. Other major councils such as
Sheffield, Greenwich and Westminster are have also planned or commissioned their own experimental
eRCV fleets [25,29,30].
     However, refuelling a diesel RCV clearly requires far less time than charging an eRCV. In order to
dispel the range anxiety as well as demonstrate robust serviceability, most of those eRCVs are fitted
with a large battery, resulting in a vehicle that is able to double-shift without recharging. For example,
the battery pack of the experimental eRCV deployed in the Royal Borough of Greenwich is able to power
the vehicle for a 14-h shift [31]. However, this requires larger batteries, which causes additional energy
consumption during the standard collection period and significantly increases the procurement cost.

2.2. Research on Energy Prediction
       There are several existing methods for predicting energy consumption. Some of them are
traditional, heuristic approaches based on computing instantaneous energy usage (power) and adding
the results over time. Newer solutions have a higher degree of novelty and include metaheuristic
algorithms used in the context of combinatorial optimisation, such as particle swarm optimisation
and Bellman–Ford.
       The first and most commonly used method is the coulomb count method [32], also known as the
current integration method, which takes advantage of the exponential time-dependency of charge with
respect to current and states that electric charge is the time integral of current.
       The main drawback of this method is that due to the continuous nature of the integration operation,
the measurement cannot be reset within the simulation. Other more complex methods exist; however,
for the purpose of this simulation project the coulomb counting method was deemed sufficient and
was successfully integrated in the software drivetrain model.
       Another commonly used method is the voltage monitoring approach [32]. It converts instantaneous
measured voltage to relative state of charge (SoC) based on a specified voltage–SoC discharge curve
of the battery. However, the voltage–SoC relationship is usually loosely defined compared to the
dependency between voltage and current or temperature. This can be countered by regularly applying
a correction factor to the simulation, but nonetheless estimations based on this method tend to be
less accurate as variations in the voltage–SoC curve tend to be very small in the optimal battery
operation range.
       Combinations of the previously presented methods exist, and have been successfully implemented
in systems, but the combined approach also requires the modelling of a decision factor that is able to
switch between the predictions generated by the two approaches. A Kalman filter has been proven
to be a good decisional factor, thanks to its ability to control a “trust” factor that can switch between
predictions [33,34].
       Other metaheuristic techniques have been applied to the energy use prediction problem with
varying degrees of success. One study suggests that the more flexible the algorithm, the more capable
it is of fitting the model equation system [35].

2.3. Research on Route Prediction
     While most frequently chosen algorithms towards automated route plan development such as
travel distance sensing, A* or Dijkstra-derived methods usually perform in a robust manner, generating
solutions that are right most of the time, they can be further improved in the context of route planning
for electric vehicles, particularly given their different driving characteristics compared to traditional
ICE powertrains, such as instant maximum torque delivery and limited range that is significantly
influenced by road and outside weather features [36].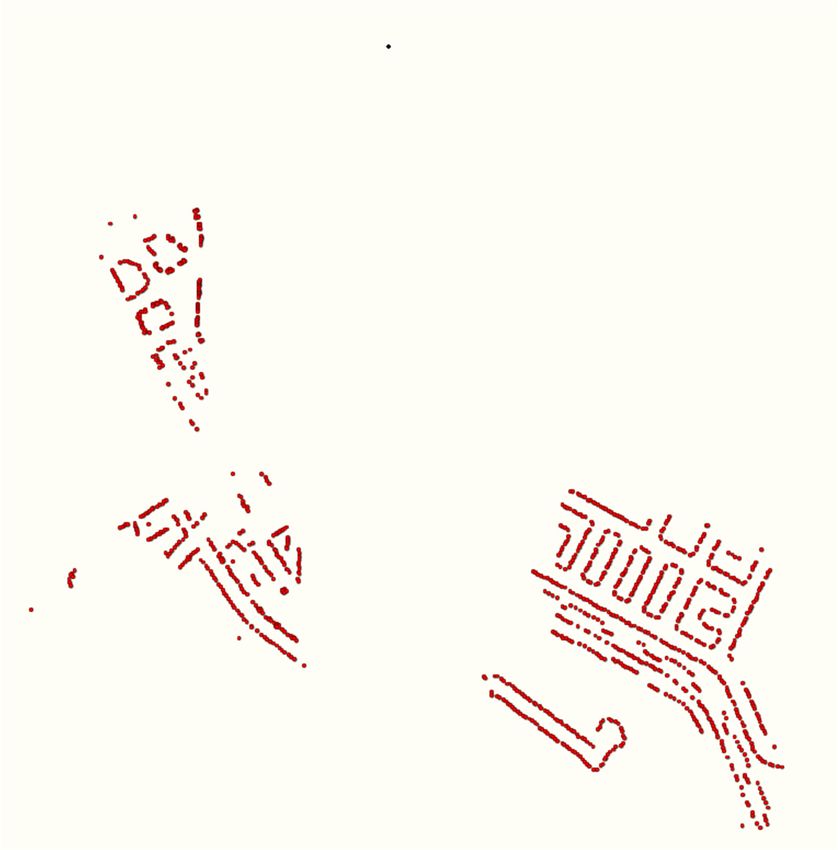
Smart Cities 2020, 3                                                                                   1104

      Existing research describes novel methods in energy-efficient routes specifically tailored for EV
cars given several data points, ranging from simple heuristic algorithms to metaheuristic touching
AI territory capabilities. Several applied mathematical methods have been found, considered and
applied to an EV car context, with varying degrees of success depending on the degree of algorithm
flexibility and complexity. Applied to a force-based, first-order vehicle model similar to that previously
described, methods such as particle swarm optimisation (PSO), a variation of the simple bee algorithm,
have been found to decrease energy usage by 9.2% compared to a Google Maps route, opening up
entirely new research strategies in the field, potential directions ranging from improving the PSO
algorithm to introducing and applying new algorithms to the presented problem [37]. Similarly,
other optimisation approaches like the ant colony algorithm exhibit abilities to optimise solutions to the
problem given enough calculation factors [38]. A Tabu Search-based solution has also been considered,
and due to its flexibility in problem solving it has been found to be a robust solution for solving similar
routing problems [39]. Finally, a Bellman–Ford approach has been attempted, and while the method
works well with small-scale data, performing consistently towards finding the optimum problem
solution, it is not a consistent method for solving large-scale data. One solution to this may consist
of map pre-processing, although this may be impractical depending on the size of the map. Finally,
the metaheuristic techniques described in other papers written by the same authors yield better results,
although they are slower to process on small data (maps) but have higher degrees of accuracy [35].

3. The Methodology of Address-Driven Energy Prediction
      Conventionally, a local council holds a large number of locations to be visited for waste collection.
With the expanding sprawl of the urban area increasing the number of locations that need to be visited,
the collection schedule is becoming more solidified. When introducing electrical waste trucks to
the collection fleets, the risk of service interruption is therefore of major importance. As illustrated
in [28–30], empirical data presented in various articles demonstrate that most eRCV providers were
advancing a large, in terms of capacity, battery as the credential for robust service availability. However,
the weight of eRCVs’ onboard energy storage device, the battery, is not proportional to the amount of
energy stored, and carrying an over-sized battery could significantly undermine the eRCV’s advantage
of sustainability. In this section, a methodology is presented to model the energy utilisation of an eRCV,
thereby predicting the energy usage for any given refuse collection route, the overall objective being
to determine the optimal SoC strategy for each vehicle, with a view to reducing the battery capacity
and thus reducing the vehicle’s kerb weight. The result could also contribute to lowering overall
costs associated with eRCVs and predicting available battery capacity at the end of the collection day,
for example, for grid support.
      Through an emergent address analysis process, the schedule address book for a given day provided
by the local authority waste management division can be converted into a dataset that is classified with
the catalogue of roads. This dataset consists of all geographic coordinates, i.e., longitude, latitude and
altitude, correlating to exact locations of the bins to be collected. In order to gain a complete route
that is able to be used for the total energy usage calculation, the depot of the RCV fleet is also added
and set to be the origin and termination point for the collection route. Based on these addresses and
coordinates, together with other requirements and regulations, such as the RCV only being able to
collect bins on a downhill cycle, an imitated route that potentially represents a real-world driving route
can be generated. This generated route has an excellent time-domain resolution and envisions the
states of the vehicle, and furthermore it is able to visualise a simulated speed, distance and elevation at
each second of the simulated route, hence providing the same data as the data recorded from a satellite
positioning-logging device installed on a collection truck. With the information provided by the virtual
route data, a novel vehicle model solution was implemented, which shows the energy drained through
the cruise and collection activities from the battery, through electronic power converters of the vehicle,
to the main drivetrain and other auxiliary components such as the garbage compactor and in-cab
air conditioner. The simulated energy figure focuses on both the overall usage of a given route and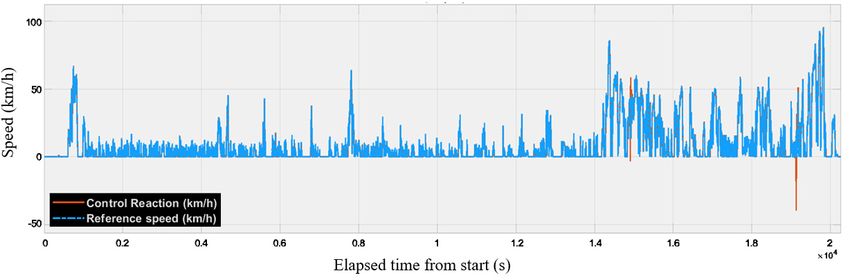
Smart Cities 2020, 3 1105
instantaneous power consumption in a one-second average interval. A simplified system topology is
shown in Figure 1, which indicates its three main subsystems: address decode, route simulation and
energy
Smart Citiesusage
2020, 3prediction. In the following section, a detailed theory of operation is introduced.
FOR PEER REVIEW 6
Route No. x
List of collection locations
Geographic coordinates Route No. 3
Semantic addresses
Route No. 2
Collection strategies
. .. Route No. 1
Drive path and road map simulator
Route-specific Natural language decoding
collection locations Collection sequency generator
Route-specific energy usage Drive path generator
.. .
Energy required to operate route 1 ..... X
RCV energy usage modelling Simulated driving dataset
Drive train energy simulator Real-time speed
On-board equipment simulator Real-time distance
Real-time elevation
Slope rate compensator
. ..
Minimum battery .. .
capacity requirement
Figure
Figure1.1.System
Systemtopology
topologyofofthe
theproposed
proposedaddress-driven
address-drivenenergy
energyprediction
predictionmethodology.
methodology.
Utilisingthis
Utilising thismethodology,
methodology,all allplanned
plannedaddress
addressgroups
groupscan
canbebeanalysed
analysedand
andproduce
produceaacluster
cluster
ofoffigures
figuresthat
thathold
holdenergy
energyusage
usagedata
datareferring
referringtotothe
thetheoretical
theoreticalenergy
energyrequired
requiredtotocollect
collectrefuse
refuse
fromeach
from eachgroup
groupofofaddresses.
addresses.Based
Basedon onthese
theseroute-level
route-levelenergy
energyfigures,
figures,optimisation
optimisationofofthe
theonboard
onboard
batterycan
battery cantherefore
thereforebebeconducted.
conducted.First,
First,through
throughre-constructing
re-constructingthetheaddress
addressgroup,
group,thetheroute
routewith
with
salientenergy
salient energyconsumption
consumptioncan canbe
bemodified.
modified.Secondly,
Secondly,aadedicated
dedicatedbattery
batterypack
packcan
canbebedesigned
designedsoso
that its
that its stored
storedenergy
energycancan
match the requirement
match of the waste
the requirement of themanagement operator while
waste management maintaining
operator while
a limited weight.
maintaining a limited weight.
3.1.Driving
3.1. DrivingPath
PathSimulation
Simulation
AsAsintroduced
introducedininthetheprevious
previoussections,
sections,the
thefirst
firststage
stageofofthe
theproposed
proposedaddress-driven
address-drivenenergyenergy
prediction approach is generating a simulated virtual route from the addresses
prediction approach is generating a simulated virtual route from the addresses which a collectionwhich a collection
vehicleisisscheduled
vehicle scheduledtoto visit.
visit. The
The data
data source
source of
of the
the simulated
simulateddrive
driveroute
routeisisthe
thecollection
collectionrota,
rota,used by
used
drivers of the in-service diesel RCV, obtained from the local authority waste management
by drivers of the in-service diesel RCV, obtained from the local authority waste management division. division.
Therota,
The rota,asasgrouped
groupedbybycollection
collectionrounds,
rounds,details
detailseach
eachaddress
addresstotobe
becollected
collectedwith
withboth
bothgeographic
geographic
information and addresses written in natural language. The data structure
information and addresses written in natural language. The data structure of the rota is shownof the rota is shown
in
in Table
Table 1. 1.
Table 1. Data structure of the rota provided by the local authority.
Table 1. Data structure of the rota provided by the local authority.
Item Format
Item Format
Round Round Integer
Integer A number
A number used
used totomark
markeach
each collection
collection run,
run,e.g., 00000001
e.g., 00000001
Address String Address in natural language, e.g., Number 10, ABC Road, London
Address
Postcode String
String Address in natural language, e.g., Number 10, ABC Road,
Exact postcode of the address showing above, e.g., AB1 2CD London
Postcode
Roundgroup String
String Exact postcode
Indication of day
of which the address
of the weekshowing above,
this round will e.g., AB1unused
operate, 2CD
Roundgroup
Latitude String FloatIndication of which day Latitude of thethis
of the week address
round will operate, unused
Longitude FloatFloat
Latitude Longitudeofofthe
Latitude theaddress
address
Longitude Float Longitude of the address
With a rota following the structure shown in Table 1, the address to be visited by a given vehicle at
Withday
a given a rota
can following the structure
be identified. Next, the shown in Table
“Address” string1,of
the address
each addressto be visited byusing
is analysed a given vehicle
a simplified
atnatural
a given day canprocessing
language be identified.
(NLP)Next, the While
engine. “Address” stringeach
processing of each address
address, is analysed
its house numberusing a
and the
simplified natural language processing (NLP) engine. While processing each address, its house
number and the street of the address are decoded; therefore, all addresses are grouped by street name.
The address data to be processed are written in a loosely structured pattern with house number and
street name included in the string. Hence, in contrast to a conventional genetic six-step NLP engine,
only the content determination, text structuring and referring expression generation are being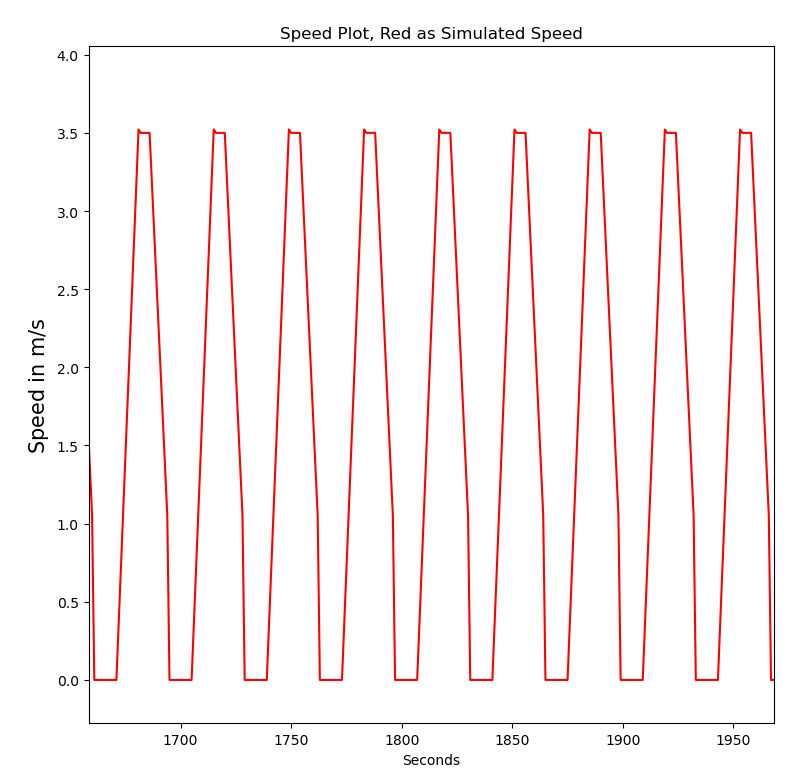
Smart Cities 2020, 3                                                                                  1106

street of the address are decoded; therefore, all addresses are grouped by street name. The address data
to be processed are written in a loosely structured pattern with house number and street name included
in the string. Hence, in contrast to a conventional genetic six-step NLP engine, only the content
determination, text structuring and referring expression generation are being processed, while the
sentence aggregation, lexicalisation and linguistic realisation are trimmed out. During this process, a
limited number of addresses are spread out due to difficulties in finding the house number and/or
street name; such examples could be addresses similar to “The end of the road, ABC street”. In order
to decode those addresses, a geo-location decoder is implemented. By querying their latitude and
longitude data from a geographic information system (GIS) information provider, such as Google
Maps, these uncertain addresses can be approximated. Although a query may only return its nearby
house number, a negligible effect is observed from the final result, since an RCV will stop for a cluster
of refuse bins, instead of at each bin location.
       Due to the continuity of house numbers for each street, the extremum is identified and followed by
its elevation data requested from the GIS system, where the starting and finishing location of a collection
street is identified. Next, the finishing point of a collection street is used as an origin, and the next
starting point in another collection street with minimum cruise distance is located, keeping the driving
path at a minimum length. This process is recursive, until all streets within a route are processed,
therefore generating a set of driving segments which could make up the whole virtual driving route
when linked together. For each segment, a driving path that follows the actual road map is therefore
generated, which represents a real-world driving path an RCV could follow. After connecting all
segmental paths as well as the path between the depot and collection area, the complete driving route
can be produced.
       Based on this virtual driving route, a novel trapezoidal approximation approach is implemented
so that a second-by-second distance and speed dataset is created. During the collection stage,
this trapezoidal approximation assumes an RCV is operating on a pre-defined start-stop interval,
i.e., it will stop after a given distance to empty a cluster of bins. Initially, the algorithm simulates
the acceleration of the RCV with a pre-set positive slope, from stationary, until the speed reaches
a pre-defined maximum value. At the end of each second, the simulated vehicle speed and travel
distance are recorded. Then, the algorithm puts the vehicle into constant speed driving until the
remaining distance is just enough to complete deceleration, while also recording the simulated speed
and travel distance according to the same period. Finally, the algorithm simulates the deceleration
stage, with a pre-set negative slope, from its max speed to 0. Then, a zero-speed interval with random
length with a pre-set interval is added, which represents the driver emptying the bins before initialising
the next cycle. During the cruise section from one street to the other, this approach assumes that
the RCV stops at each traffic light for a pre-defined period. Therefore, the process is similar to the
collection stage but with different speed and distance factors.
       The outcome from the proposed algorithm is a dataset similar to a recorded dataset from an
onboard satellite positioning-logging device. Hence, it can be used as the input of the energy
consumption model and calculate the energy required to collect from this group of addresses.

3.2. Energy Consumption Modelling
     The presented vehicle model simulates a battery-electric vehicle (BEV) heavyweight powertrain
that has been adapted to reflect the performance and behaviour of an eRCV during a normal refuse-bin
collection routing operation. Key capabilities include the ability to account for the behaviour of the
auxiliary vehicle power systems, such as heating, cooling and the refuse compression system. It also
approximates the effect of road slope increase on power usage. The model is also capable of simulating
energy harvesting through braking.
     The proposed simulation solution was initially developed in MATLAB using the related Simulink
and SimScape versions in the base workspace and environment. Several model approaches were
developed in order to estimate different capabilities of various simulation blocks within Simulink.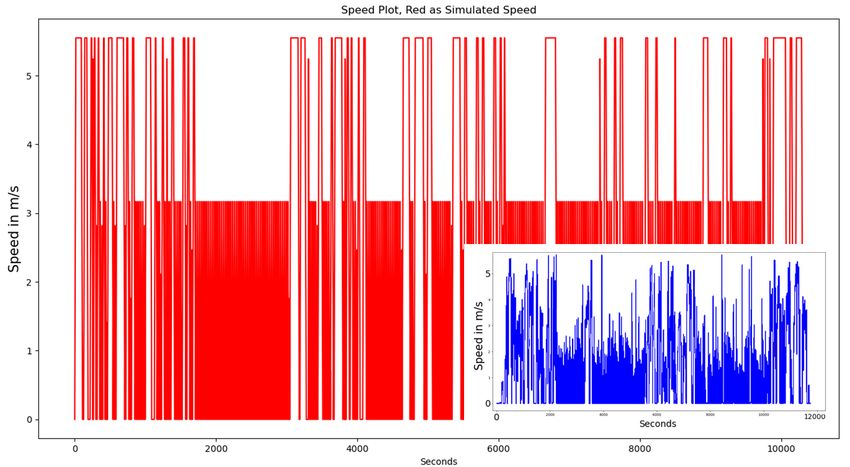
Smart Cities 2020, 3                                                                                               1107

After careful consideration, the most promising design in terms of versatility and ease of use was
chosen. The final model, as shown in Figure 2, was developed starting from a multi-level power source
drivetrain model available in the Simulink SimScape library. Compared to basic Simulink blocks
for which the output can be seen only if an observer block is attached to the signal line (e.g., scope,
  Smart Cities 2020, 3 FOR PEER REVIEW                                                                        8
bar, final value). SimScape allows for complete parameter observation thanks to the Solver Explorer
application.
  be seen down   Here,totime-based   evolution
                          a library-defined      of alllevel.
                                              block      system andalso
                                                              This   subsystem  parameters
                                                                        allows for a much can  be seen
                                                                                            quicker anddown   to a
                                                                                                         better
library-defined      block  level.
  understanding of the model.      This also allows  for   a much  quicker and better understanding of the model.

                                                          (a)

                                                         (b)

       Figure2.2.Electric
      Figure      Electricrefuse
                           refuse collection
                                  collection vehicle
                                             vehicle (eRCV)
                                                      (eRCV)software
                                                             softwaremodel,
                                                                      model,(a)
                                                                              (a)model
                                                                                  modeltopology, (b)(b)
                                                                                         topology,    detailed
                                                                                                        detailed
       blockdiagram
      block  diagramshowing
                       showingthetheaero
                                      aero and
                                           and break
                                               break sub-module.
                                                      sub-module.

      The
       Thechosen
            chosen approach
                     approach  consists  of of
                                  consists   a simple
                                                a simpleunidirectional  model
                                                           unidirectional       thatthat
                                                                            model     feeds  input
                                                                                           feeds   datadata
                                                                                                 input  into the
                                                                                                             intosystem
                                                                                                                   the
and  outputs
  system  and iteratively   with respect
               outputs iteratively           to the time
                                      with respect         step
                                                      to the    choice.
                                                             time         The input
                                                                   step choice.       signalsignal
                                                                                 The input    processing  blockblock
                                                                                                    processing   adapts
  adapts
input     input
       data whichdata   which
                    is then  fedisinto
                                   thenthefed  into current
                                             direct  the direct current
                                                             (DC)  motor(DC)     motor
                                                                           control       control
                                                                                    module.       module.
                                                                                               Then,       Then,
                                                                                                     the block     the
                                                                                                                outputs
  block  outputs  the  power     demand     to the  motor   which   in turn  draws   the  required
the power demand to the motor which in turn draws the required energy from the battery model        energy  from   the
  battery the
through    model
              DC/DCthrough     the DC/DC
                        conversion     module. conversion    module.
                                                    Additionally,    theAdditionally,
                                                                         DC motor block  the also
                                                                                              DC outputs
                                                                                                   motor block    also
                                                                                                           mechanical
  outputs mechanical
rotational  movementrotational
                          parameters  movement      parameters
                                         to the other            to the
                                                         side of the    other The
                                                                      model.   side gearbox
                                                                                    of the model.   The gearbox and
                                                                                               and transmission    block
  transmission  block   ratios  the DC  motor    output   accordingly,   then feeds  in the  resulting
ratios the DC motor output accordingly, then feeds in the resulting parameters to the aerodynamics     parameters   to
  the aerodynamics     subsystem.     Here,   the control   module    applies any  required    braking
subsystem. Here, the control module applies any required braking and takes the block output as the     and  takes  the
  block output
system          asto
         reaction   the system
                      the  input.reaction to the input.
       Finally, key   simulation    information is
      Finally, key simulation information           is outputted
                                                       outputtedto  toaanumber
                                                                         numberofofplotplotmonitors,
                                                                                              monitors,grouped
                                                                                                         grouped with
                                                                                                                    with
  respect to monitoring areas. The speed analysis scope block shows the evolution in time of two-speed
respect to monitoring areas. The speed analysis scope block shows the evolution in time of two-speed
  values, the input dataset and the model’s speed that is mapped and corrected by the control module
values, the input dataset and the model’s speed that is mapped and corrected by the control module
  to the former input. The block is capable of showing the speed–time performance in both km/h and
to the former input. The block is capable of showing the speed–time performance in both km/h and
  mph using linear conversion, as seen in Figure 3. Furthermore, this block is useful in diagnosing any
mph using linear conversion, as seen in Figure 3. Furthermore, this block is useful in diagnosing any
  problems that may arise with the system’s controlled response.
problems that may arise with the system’s controlled response.
Smart Cities 2020, 3 1108
Smart Cities
Smart Cities 2020,
2020,33FOR
FORPEER
PEERREVIEW
REVIEW 9 9
Figure
Figure 3. Vehicle speed
speed controlmonitoring.
monitoring.
Figure3.3.Vehicle
Vehicle speedcontrol
control monitoring.
Similarly,
Similarly,the power info block consists of
of several scope
scope blocksthat that measure mechanical and
Similarly, the
the power
power infoinfoblock
blockconsists
consists ofseveral
several scopeblocks
blocks thatmeasure
measuremechanical
mechanical andand
electrical power-related parameters
electrical that are
are alsouseful
useful fordiagnosing
diagnosing any problems that may arise,
electrical power-related
power-relatedparameters
parametersthat that arealso
also usefulfor
for diagnosingany anyproblems
problems that may
that mayarise,
arise,
such
suchas motor
as motorshaft
shaftrevolutions
revolutions per
per minute
minute (RPM),
(RPM), instantaneous
instantaneous battery
battery losses
losses and
and
such as motor shaft revolutions per minute (RPM), instantaneous battery losses and absolute power
absolute
absolute power
power
deployment/harvest
deployment/harvest
deployment/harvest asas
functions
as functionsof
functions oftime
of timethat
time synchronise
thatsynchronise with
synchronisewith the
withthe speed
thespeed analysis
speedanalysis
analysis scope,
scope,
scope, as
asas presented
presented
presented
in in
Figure
in Figure
Figure4.4.
4.
Figure 4. Power information output. Model output example. Top left—power at motor and battery
Figure
Figure
(kW), 4.
4.Top Power
Power information
information
Right—battery output.
output.
losses Model
(kW),Model output
Bottomoutput example.
example.
Left—motor RPM, Top
Top left—power
left—power
Bottom at
at motor
motor and
Right—SoC. andbattery
battery
(kW),
(kW), TopTop Right—battery
Right—battery losses
losses (kW),Bottom
(kW), BottomLeft—motor
Left—motorRPM,
RPM,Bottom
BottomRight—SoC.
Right—SoC.
To ensure a reasonable degree of precision while maintaining functionality and flexibility during
theToTo ensure
ensure
simulation, athe
reasonable
a reasonable degreeofof
degree
model employs precisionused
precision
commonly while
while maintaining and
maintaining
measurement functionality and
and flexibility
flexibility
control techniques during
during
that have
the
thebeensimulation,
simulation, the model
the amodel
tailored for givenemploysemploys commonly
commonly
set of physical used measurement
used measurement
constraints. Vehicle response and
and to control
control techniques
techniques
the input datasetthat that
havehave
is achieved been
been tailored
tailored
using for for aset
a given given set of physical
of physical
proportional–integral–derivative constraints.
constraints.
(PID)Vehicle Vehicle
controlresponseresponse
assisted toby to the input
thefurther
input datasetdataset is system
is achieved
mathematical achieved
using
using proportional–integral–derivative
proportional–integral–derivative
dampening, as presented in Figure (PID)
5. PID (PID)
control
values control
assisted byassisted
were chosenfurther by further
mathematical
initially using themathematical
system MATLAB
built-in system
dampening,
dampening,
ascontrol
presented as
response presented
in Figuretuning
5. PID in Figure
system,
valuesthen5. PID values
werefine-tuned were chosen
by trial
chosen initially initially
andthe
using error. using
An MATLAB
built-in the built-in
algebraic control MATLAB
constantresponse
was
control
connected
tuning response
system,to the
then tuning
PID system,
controller
fine-tuned thentoand
output
by trial fine-tuned
avoid by algebraic
solution
error. An trial and constant
convergence error. An
problems.
wasalgebraic
connectedconstant
to thewas
PID
connected
controller to thetoPID
output avoidcontroller
solutionoutput to avoidproblems.
convergence solution convergence problems.Smart Cities 2020, 3 1109
Smart Cities 2020, 3 FOR PEER REVIEW 10
Smart Cities 2020, 3 FOR PEER REVIEW 10
P I D Form
10P 0.5I 0
D Parallel
Form
Figure 5. 10 0.5 and proportional–integral–derivative
Control module system design 0 Parallelmain
(PID) controller
Figure 5. Control module system design and proportional–integral–derivative (PID) controller
specifications.
main specifications.
Figure 5. Control module system design and proportional–integral–derivative (PID) controller main
specifications.
Similarly,the
Similarly, theproposed
proposedmodel
model showcases
showcases quick
quick system
system diagnosis
diagnosis methods
methods at a at a system-block
system-block level
level through
through conventional
Similarly, the proposed
conventional Simulink
Simulink model monitoring,
showcases
monitoring, but
quick
but also also employing
system
employing diagnosisthe SimScape
methods
the SimScape results
at aexplorer
results explorer
system-block
module.
module.
Finally, Finally,conventional
level through
performanceperformance assessments
Simulink
assessments of of allexisting
monitoring,
of all the ofbut
thealso
existing mathematical
employing
mathematical the solvers
SimScape
solvers feasible
results
feasible thefor
for explorerthe
given
given
model model
module. were performed
wereFinally,
performedperformance inassessments
in order order
to to choose
choose the allthe best-suited
of best-suited
of the existing model
for thefor
modelmathematical thesolvers
application.
application. feasible for the
given model were performed in order to choose the best-suited model for the application.
4. Evaluation
4.
4. Evaluation
The proposed
The proposed driving route simulation
simulation algorithm
algorithm and and the
the energy
energy consumption
consumption model model werewere
Theusing
evaluated
evaluated proposed driving route
data randomly simulation
sampled from thealgorithm androta
collection thementioned
energy consumption
mentioned above.
above. TheThemodel
sample
sample were
used
used
forevaluated
evaluation
for evaluation using
is data
plottedrandomly
in Figure sampled
6. from the collection rota mentioned above. The sample used
for evaluation is plotted in Figure 6.
Depot
Depot
Figure
Figure6.
Figure The
6.6.The plot
Theplot of
plotof the
ofthe sample
thesample data used
sample data
data usedfor
used forevaluation.
for evaluation.
evaluation.
Utilising
Utilising
Utilising the
thethealgorithm
algorithm presented
algorithmpresented
presented above,
above,
above, a simulated
aasimulated
simulated virtual
virtual
virtual drivedrive
drive path path
pathwas
was was created
created
createdand and is
andisisshown
shown
shown
in Figure 7. As can be seen from the figure, the proposed algorithm successfully generated a validateda
in in
FigureFigure
7. As 7.
canAs
be can
seen be seen
from thefrom the
figure, figure,
the the
proposed proposed
algorithm algorithm successfully
successfully generated agenerated
validated
validated
virtual
virtual virtual
driving driving
drivingpath
paththat path
that that all
covers
covers covers all desired
alldesired
desired addresses
addresses
addresses whilewhile
while ensuring
ensuring
ensuring repeated
repeated
repeated sections
sections
sections areatare
are ata aat
minimum.
aminimum.
minimum.Smart Cities 2020, 3 1110
Smart Cities 2020, 3 FOR PEER REVIEW 11
Smart Cities 2020, 3 FOR PEER REVIEW 11
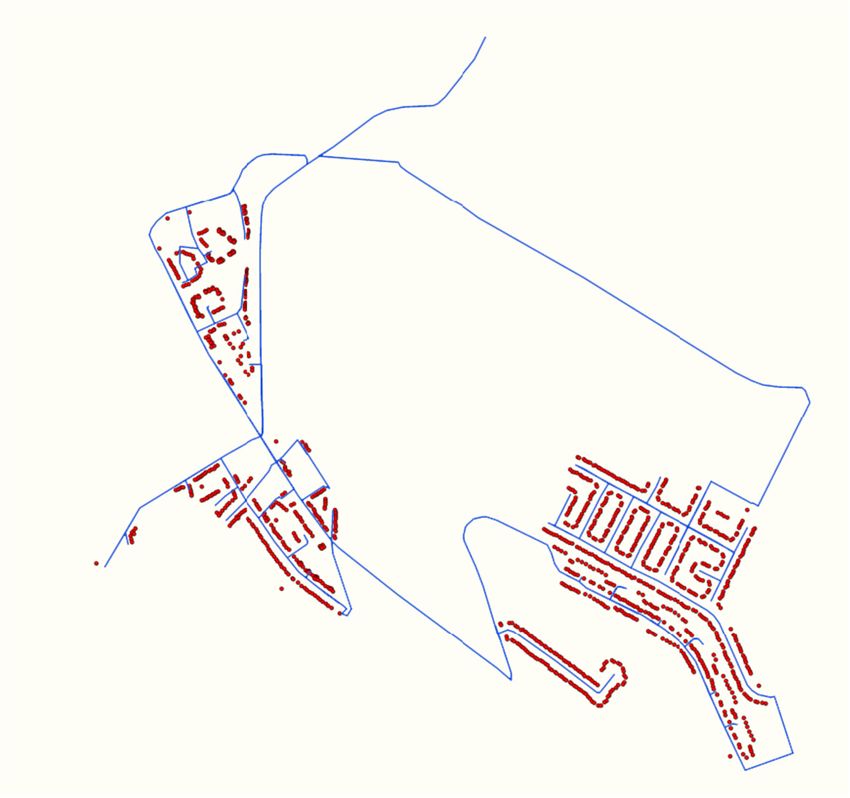
Figure
Figure
Figure 7. 7.
7. Simulatedvirtual
Simulated
Simulated virtual
virtual driving
driving
driving route
route
route forfor
for thethe
the select sample
select
select address
sample
sample set,
set,utilising
address
address a agiven
set, utilising
utilising aroad
givengiven
road
structure.
road structure.
structure.
Figure
Figure 8 shows a comparisonbetweenbetween the
the simulated
simulated virtual
virtualdriving
drivingroute
routeand
anddriving route
Figure 88 shows
shows aa comparison
comparison between the simulated virtual driving route and driving
driving route
route
collected
collected from
from a a real
real vehicle
vehicle using
using a a Global
Global PositioningSystem
Positioning System(GPS)-based
(GPS)-basedlogging
loggingdevice.
device. As
As can
can be
collected from a real vehicle using a Global Positioning System (GPS)-based logging device. As can
be from
seen seen from
thethe the figure,
figure, a negligible
a negligible difference canbebefound
difference found between these routes, demonstrating thethe
be seen from figure, a negligible differencecan
can be foundbetween
betweenthese
theseroutes,
routes, demonstrating
demonstrating the
efficacy
efficacy of of the proposed route simulation algorithm.
efficacy of the
the proposed
proposed route
route simulation
simulation algorithm.
algorithm.
(a) (b)
Figure
Figure 8.8.Comparison
(a) Comparisonbetween
between real
real (a)
(a) and
and simulated
simulated(b)
(b)driving
(b)route.
driving route.
From
From the
the Figure 8.virtual
simulated
simulated Comparison between
virtualdriving
driving routereal
route (a) and
shown
shown simulated
above,
above, the (b) driving route.
thecorresponding
corresponding speed profile
speed was
profile was
generated
generated using
using theparameters
the parametersshown
shownininTable
Table2. 2.
From the simulated virtual driving route shown above, the corresponding speed profile was
generated using the parameters shown in Table 2.Smart Cities 2020, 3 1111
Table 2. Parameters used in trapezoidal approximation.
Smart Cities 2020, 3 FOR PEER REVIEW 12
Parameter Value
Table 2. Parameters used in trapezoidal approximation.
Maximum distance between two clusters of bins 25 m
Maximum Parameter
speed during cruise Value
30 km/h
Maximum distance
Maximum between
speed two collection
during clusters of bins 25m
12.6 km/h
Maximum
Stop time for speed during
drivers cruisebins
to empty 30 km/h
10 s
Maximum speed during collection 12.6km/h
Positive slope for acceleration 0.3522 m/s2
Stop time for drivers to empty bins 10s
Negative slope for deceleration 0.3057 m/s2
Positive slope for acceleration 0.3522 m/s2
Stop time at traffic lights 38 2s
Negative slope for deceleration 0.3057 m/s
Stop time at traffic lights 38s
As can be seen from Figure 9a, the speed profile can be split into cruise sections and collection
sections As can on
based be seen from characteristics,
its speed Figure 9a, the speed profile can be
corresponding to split into cruise
real-world RCVssections
which and collection
tend to drive at a
sections based on its speed characteristics, corresponding to real-world RCVs which tend to drive at
higher speed during cruise sections and operate at a significantly lower speed when collecting bins.
a higher speed during cruise sections and operate at a significantly lower speed when collecting bins.
Figure 9b,c shows the speed profile during collection.
Figure 9b,c shows the speed profile during collection.
(a)
(b) (c)
Figure 9. (a) Simulated speed profile with an embedded blue figure showing the corresponding real-
Figure 9. (a) Simulated speed profile with an embedded blue figure showing the corresponding real-life
life speed profile, (b) speed profile during collection with maximum distance between clusters of bins
speed profile, (b) speed profile during collection with maximum distance between clusters of bins set
to 50m, (c) speed profile during collection with maximum distance between clusters of bins set to 25m.Smart Cities 2020, 3 FOR PEER REVIEW 13
Smart Cities 2020, 3 1112
set to 50m, (c) speed profile during collection with maximum distance between clusters of bins set to
25m.
Figure 9b illustrates the four speed states of the proposed trapezoidal speed approximation:
Figure 9b illustrates the four speed states of the proposed trapezoidal speed approximation:
acceleration, constant speed, deceleration and parking for moving bins. When the maximum distance
acceleration, constant speed, deceleration and parking for moving bins. When the maximum distance
between two clusters of bins is set to a smaller value where pre-defined maximum collection speed
between two clusters of bins is set to a smaller value where pre-defined maximum collection speed
(12.6km/h) cannot be achieved, a triangle-like speed profile is obtained. The speed profile of such a
(12.6km/h) cannot be achieved, a triangle-like speed profile is obtained. The speed profile of such a
configuration
configuration is shown
is shown inin
Figure
Figure9c.9c.
Next,
Next, the energy consumptionmodel
the energy consumption modelwas was also
also evaluated usingreal-life
evaluated using real-lifedata,
data,butbutinin two
two stages.
stages.
First, real-life driving routes were used to evaluate the efficacy of the proposed
First, real-life driving routes were used to evaluate the efficacy of the proposed modelling modelling methodology.
Themethodology.
results obtained The from
resultsthe proposed
obtained frommodel were compared
the proposed model were withcompared
the real-life SoC
with thefigure collected
real-life SoC
together with thetogether
figure collected drivingwith
route. Duringroute.
the driving the evaluation, driving cycles
During the evaluation, were
driving chosen
cycles were at random
chosen at
from provided datasets with behaviour observed for over 130 kilometres
random from provided datasets with behaviour observed for over 130 kilometres of driving cycles inof driving cycles in total.
Throughout this evaluation
total. Throughout stage, the
this evaluation average
stage, error rate
the average error(i.e.,
ratethe difference
(i.e., in SoC
the difference in percentage
SoC percentage at the
endatofthe
theend of the simulation
simulation betweenbetween
real-lifereal-life
data and data and simulation)
simulation) was calculated
was calculated to be 6.08%.
to be 6.08%. The
The figure
figure
drops dropsiftoadjusting
to 5.8% 5.8% if adjusting for marker
for outlier outlier marker attenuation.
attenuation. A comparative
A comparative histogram,
histogram, using using
datadatafrom
from simulated results and real-life data logged from trialling eRCVs, showcasing
simulated results and real-life data logged from trialling eRCVs, showcasing several of these error several of these
error
rates perrates periscycle,
cycle, is presented
presented in Figure
in Figure 10. The
10. The chosen
chosen drivingcycles
driving cyclesrepresent
represent ananaverage
averagerubbish
rubbish
collection route, with a mix of driving features, including intense acceleration,
collection route, with a mix of driving features, including intense acceleration, start-stop phases as wellstart-stop phases as
well as sustained speed (cruising). While some minor differences can be seen
as sustained speed (cruising). While some minor differences can be seen from the figure, they did not from the figure, they
did not significantly affect the end result in terms of power usage, maintaining a high degree of
significantly affect the end result in terms of power usage, maintaining a high degree of dependability.
dependability.
E N D O F S I M U L ATI O N S O C COM PA R I S O N
81.5
81
Real Data Simulation
71.8
69
68
64.6
67
59.6
48.3
46
45
SOC(%)
43
32.2
32
1 2 9 10 12 14 15
DRIVING CYCLE NUMBER
Figure
Figure 10.10.Comparison
Comparison between
betweenreal-life andand
real-life simulated end-of-collection
simulated SoC using
end-of-collection SoCa real-life
using adriving
real-life
route.
driving route.
In In orderto tovalidate
order validatethe
theeffectiveness
effectiveness of
of the
the proposed
proposed address-driven
address-driven energy
energyprediction
prediction
methodology, the integrated system was evaluated during the late development
methodology, the integrated system was evaluated during the late development phase. This phase. This
evaluation
evaluation was primarily focused on the bin-collection stage, where the eRCV uses most of its
was primarily focused on the bin-collection stage, where the eRCV uses most of its energy. As can be energy.
As can be seen from Figure 10, a simulated drive route for each bin-collection stage was generated
seen from Figure 10, a simulated drive route for each bin-collection stage was generated and fed into
and fed into the model. Results were compared between the real-life energy usage and the energy
the model. Results were compared between the real-life energy usage and the energy usage calculated
usage calculated from the generated drive route. It can be seen from Figure 11 that the average
from the generated drive route. It can be seen from Figure 11 that the average additional error rate in
additional error rate in SoC prediction was 2.64%.
SoC prediction was 2.64%.Smart Cities 2020, 3 1113
Smart Cities 2020, 3 FOR PEER REVIEW 14
END OF SIMULATION SOC COMPARISON
No Approximation Bin Collection Approximation
16.6
15
SOC ERROR WRT REAL DATA (%)
13
11.5
11.5
11.4
10.8
10
9.5
8.2
7.5
7.4
8
6.7
2.7
2.3
2.2
2
0.6
0.2
1 2 3 4 5 6 7 8 9 10
DRIVING CYCLE NUMBER
Figure11.
Figure 11. Comparison
Comparisonbetween real-life
between and simulated
real-life end-of-collection
and simulated SoC using
end-of-collection simulated
SoC using driving
simulated
route.
driving route.
AsAscan
can
bebe seen
seen from
from thethe above
above evaluation,
evaluation, the
the results
results successfullydemonstrate
successfully demonstratethe
theconsistency
consistencyand
and accuracy of the proposed drive route simulation algorithm and energy prediction model,
accuracy of the proposed drive route simulation algorithm and energy prediction model, thus validating thus
validating
the thethe
efficacy of efficacy of theaddress-driven
proposed proposed address-driven energy prediction
energy prediction methodology.
methodology.
5. 5.Conclusions
Conclusions
Municipalservices
Municipal servicessuch
such as
as refuse
refuse collection
collectionplay
playaavital
vitalrole
roleinincontemporary
contemporary communities
communities andand
require an increasing number of vehicles. To reduce noise pollution and GHG emission, eRCVs have
require an increasing number of vehicles. To reduce noise pollution and GHG emission, eRCVs have
been proposed as replacements to the polluting diesel-powered rubbish collection vehicles. However,
been proposed as replacements to the polluting diesel-powered rubbish collection vehicles. However,
the energy storage component, primarily the chemical battery of the eRCV, has a unique feature
the energy storage component, primarily the chemical battery of the eRCV, has a unique feature
compared with the conventional energy storage compartment, such as the fuel tank, where the
compared with the conventional energy storage compartment, such as the fuel tank, where the battery
battery maintains the same weight independent of its SoC. Research has shown that the battery
maintains the same weight independent of its SoC. Research has shown that the battery contributes the
contributes the majority of the vehicle’s kerb weight, and thus carrying an oversized battery could
majority
cruciallyofjeopardise
the vehicle’s thekerb weight,of
significance and
thethus
eRCV carrying
in termsanofoversized
efficiencybattery could crucially jeopardise
and cost.
the significance of the eRCV in terms of efficiency and cost.
This paper introduces a methodology for predicting the amount of energy required to cover a
set This paper introduces
of addresses a methodology
by implementing for predicting
higher proportions the amount
of route planningof energy required
and energy to cover
modelling
a schemes.
set of addresses by implementing
The detailed algorithm for higher proportions
route building and of route planning
comprehensive andofenergy
theory modelling
modelling for
schemes. The detailedisalgorithm
energy calculation presented.forTheroute building and
methodology comprehensive
proposed theorywas
in this paper of modelling
evaluatedfor energy
using
calculation is presented.
randomly sampled The in-service
data from methodology proposed
collection in this
schedules paper
in the UK.was
The evaluated usingfrom
results obtained randomly
the
sampled dataphase
evaluation fromsuccessfully
in-service collection
validatedschedules
the proposedin the UK. Theand
algorithm results obtained
energy model.from the evaluation
Based on the validated
phase successfully validated model, a set of algorithm
the proposed calculationsand
for energy
each planned
model.route can be processed. The
cluster of energy figures obtained will illustrate the energy
Based on the validated model, a set of calculations for each planned usage, and thus
routebattery
can becapacity
processed.
The cluster of energy figures obtained will illustrate the energy usage, and thus capacity
requirements, for each given route. Therefore, optimisation of the onboard battery for a
battery capacity
designated eRCV
requirements, fleet given
for each can beroute.
achieved, reducingoptimisation
Therefore, the battery weight to the maximum
of the onboard battery degree
capacity andfor a
achieving a further level of sustainability. The proposed energy prediction methodology
designated eRCV fleet can be achieved, reducing the battery weight to the maximum degree and could enable
municipal
achieving serviceslevel
a further to further reduce theirThe
of sustainability. energy usageenergy
proposed and establish more
prediction sustainable smart
methodology could city
enable
space, services and structures.
municipal services to further reduce their energy usage and establish more sustainable smart city space,
services and structures.You can also read