Sustainable Consumption Facts and Trends - From a business perspective The Business Role Focus Area - WBCSD

Page created by Lloyd Franklin
 
CONTINUE READING
Sustainable Consumption Facts and Trends - From a business perspective The Business Role Focus Area - WBCSD
Sustainable
 Consumption
Facts and Trends
                     From     a business
                              perspective

                   The Business Role Focus Area
Sustainable Consumption Facts and Trends - From a business perspective The Business Role Focus Area - WBCSD
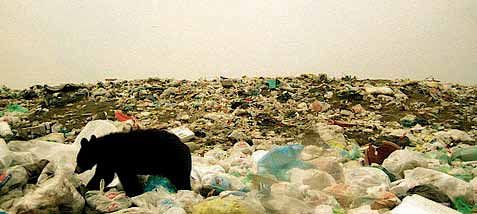
About this document
This document takes stock of recent developments
and trends in global consumption patterns. It presents
an overview of documented facts and trends on the
relationship between business activities, consumer
behavior, and environmental and social challenges.
The primary purpose of this paper is to stimulate
further discussion among businesses and to be used in
dialogue with stakeholders. We have used existing data
from a variety of sources, including intergovernmental
organizations, non-governmental organizations (NGOs),
governments, academics, consumer groups and
businesses, including our own members. In all cases, we
have sought to use the best data available.

This document has been developed by the World Business
Council for Sustainable Development (WBCSD)’s Business
Role Focus Area and members of the Consumers &
Sustainable Consumption workstream: adidas, BCSD
Argentina, Coca-Cola, EDF, General Motors, Henkel,
Interface, KPMG, Nokia, Pakistan State Oil, Philips, Procter
& Gamble, PricewaterhouseCoopers, Sony, Teijin, Umicore
and Weyerhaeuser.

The Business Role Focus Area aims to engage, equip and
mobilize business leaders to demonstrate the evolving
role of business in a sustainable society. Dialogues with
stakeholders around the world have confirmed that society
expects business to act, and that leading businesses of the
future will be those with products and services that address
society’s most urgent challenges.1

Cover image
The concept of sustainable consumption has been an
often confusing, or “wooly”, topic of multiple themes,
concepts and issues. In identifying the key facts and trends
surrounding this subject, and in developing a deeper
understanding of key issues from a business perspective,
the path towards a sustainable consumption future
becomes untangled, clear, good for business and good for
sustainable development.
Sustainable Consumption Facts and Trends - From a business perspective The Business Role Focus Area - WBCSD
Contents

                    4   Message from the co-chairs of the
                        Business Role Focus Area

                    5   Foreword: A statement of intent
                        from the sustainable consumption &
                        consumers workstream

                    6   Executive summary: The issue at a
                                glance
          7
                                       Introduction:
                                         Sustainable
     8                                    consumption

                                           Chapter 1: Global
10                                         drivers of consumption

                                            Chapter 2: Global
                                            consumption patterns &
15                                         impacts

                                      Chapter 3: The role of the
         22                         consumer

                                    Chapter 4: The role of
         34                         business

                                    Chapter 5: The challenge
          37                       ahead & options for change

               38              Resources

                               Notes
Sustainable Consumption Facts and Trends - From a business perspective The Business Role Focus Area - WBCSD
Message from the co-chairs
of the World Business Council
for Sustainable Development’s
Business Role Focus Area
There are now clear signs that consumption issues are
increasingly of central concern to business. Further, in
response to these challenges, we as business leaders
are keen to signal to our stakeholders our willingness to
formulate innovative responses and solutions.

In 2005 a group of CEOs from the WBCSD created a
manifesto for tomorrow’s global businesses that stated:
“Leading businesses of the future will be those whose
core business directly addresses global challenges.” This
document also represents a milestone on the journey for
business seeking to define its role in tomorrow’s society.

The compelling statements of the companies who have
contributed to this new report, along with the data
presented, make it clear that the role of business is to
work in partnership with our customers and stakeholders
to define, “what is a sustainable product?” and “what
is a sustainable lifestyle?” Determining the answers to
these questions will help us achieve more sustainable and
responsible consumption.

The statement of intent from the companies contributing
to this work (page 5) states that business is at the
beginning of this journey. We are confident that business
can add significant value in addressing this global
challenge, just as we have made significant progress in the
area of sustainable production.

We would like to congratulate the companies who have
so readily contributed their insights and experience to this
important discussion. We would also like to thank them for
taking a courageous leadership stance in driving forward
a shared understanding of what is meant by sustainable,
responsible consumption from a business perspective. As
our world faces rising fuel prices, serious issues of hunger
and poverty, scarcity of water, arable land and other natural
resources … the question of human consumption and how
we deal with it has never been more urgent.

Samuel A. DiPiazza, Jr,          Idar Kreutzer,
Global CEO,                      CEO,
PricewaterhouseCoopers           Storebrand

                                                  4
Sustainable Consumption Facts and Trends - From a business perspective The Business Role Focus Area - WBCSD
A statement of intent
  From the WBCSD’s Business Role Focus Area workstream on                                             Foreword
 Sustainable Consumption & Consumers
 Current global consumption patterns are unsustainable. Based on the
facts and trends outlined in this document, it is becoming apparent that
efficiency gains and technological advances alone will not be sufficient
to bring global consumption to a sustainable level; changes will also
 be required to consumer lifestyles, including the ways in which
  consumers choose and use products and services.

    We recognize the need for business to play a leadership
     role in fostering more sustainable levels and patterns of
                                                                                     “We need to connect sustainable
       consumption, through current business processes such
                                                                                     production with sustainable
         as innovation, marketing and communications, and
             by working in partnership with consumers,                               consumption. This means
                 governments and stakeholders to define                              understanding current and future
                      and achieve more sustainable                                   consumption patterns, then
                             lifestyles.                                             harnessing innovation to develop
                                                                                     more sustainable products, services
“The target of this work is to           innovative products – not merely            and behavior change initiatives. This
demonstrate that WBCSD members           in the sense of ‘green’ products,           publication will help us all learn from
want to be proactive in addressing the   but in the sense of offering smarter        those leading the way in identifying
global challenges related to shortage    consumer-relevant solutions that            opportunities for sustainable value
of resources, water scarcity, climate    link product quality to the shared          creation for consumers, businesses
change and loss of biodiversity.         responsibility of producers and             and society as a whole.”
Understanding and adjusting to the       consumers. The environmental                Dr. Peter White, Director of Global
requirements of future consumers         footprint of the product in terms           Sustainability, Procter & Gamble
who will increasingly want to make       of production and disposal and – in
                                                                                     “Technology innovation has driven
ethical choices will be important        many cases even more importantly –
                                                                                     the explosive growth of the 20th
to the whole business community.         the proper use of the product with
                                                                                     century – growth that now presents
Overlooking this trend would be          respect to its environmental impact
                                                                                     us with a new set of local and global
shortsighted and a risk for any          will be decisive. To address this,
                                                                                     challenges. Rising effectively to these
company, and we believe it is the        we must work more closely with
                                                                                     challenges requires us to work closely
responsible companies who will be        consumers, communicating top
                                                                                     with our consumers to redefine the
successful in the long run. Companies    performance, the added value of
                                                                                     value that we offer to them, and to
can also influence consumer behavior     sustainable products and enabling
                                                                                     redefine our corporate values in line
towards more sustainable choices,        behavioral changes.”
                                                                                     with our vision of a sustainable and
both through product development         C-A Weinberger, Corporate Senior Vice
                                                                                     prosperous society.”
and consumer information. It is          President and Global Chief Marketing
                                         Officer, Henkel                             Hidemi Tomita, General Manager,
our aim that this trend analysis on
                                                                                     Corporate Social Responsibility
sustainable consumption will act as a
                                         “Addressing sustainable consumption         Department, Sony Corporation
trigger for innovation and ultimately
                                         requires innovative thinking that goes
for more sustainable consumption.”                                                   “I see an important role for business
                                         ‘beyond the fence’. The fundamentals
Kirsi Sormunen, Vice President & Head                                                in the discussion about sustainable
                                         of business activity in society will be
of Environmental Activities, Nokia                                                   consumption in helping to find
                                         impacted by resource shortages and
                                                                                     an optimal balance between self-
“The role of business and the role       environmental degradation. This
                                                                                     regulating market mechanisms on
of consumers are intrinsically linked    document seeks to explore trends
                                                                                     the one hand and legislative, ‘level
in terms of the sustainable use of       in business approaches that align
                                                                                     playing field’ initiatives on the other.”
products. Consumers choose to buy a      corporate values and marketing
                                                                                     Dr. Andrew Griffiths, Director EHS
product for a combination of reasons.    activities in the context of the creation
                                                                                     Europe, Umicore
One is and will remain excellent         of marketable, sustainable solutions.
performance at an adequate price.        Once this broadened view is                 “The role of business is to make
In the future, delivering performance    established, it opens new dimensions        markets work. This document is a call
that is both based on sustainability     of market opportunity but not at the        to action to make markets work for
and recognized as added value will       cost of the environment.”                   sustainable consumption.”
become increasingly important for        Frank Henke, Vice President & Global        Cassie Phillips, Vice President,
consumer choices. This development       Director, Social and Environmental          Sustainable Forests and Products,
offers great potential as a driver for   Affairs, adidas Group                       Weyerhaeuser

                                          5
Sustainable Consumption Facts and Trends - From a business perspective The Business Role Focus Area - WBCSD
Executive summary

     To meet the challenge of sustainable development, businesses can help to foster
     more sustainable levels and patterns of consumption. There is a significant
     opportunity for business to help consumers choose and use their goods and
     services sustainably. In order to do so, business must create sustainable value
     for consumers by supplying products and services that meet their functional
     and emotional needs – now and for future generations – while respecting
     environmental limits and common values.

                                                                     The issue at a glance...
 1. Global drivers of consumption
 Global consumption levels and patterns are driven at the most fundamental level by:
 •   Rapid global population growth – Population of 9 billion expected by 2050
 •   The rise in global affluence and associated consumption – Global middle class expected to triple by 2030;
     low-income consumers represent a market of US$ 5 trillion
 •   A culture of “consumerism” among higher income groups, who account for the greatest per capita share of global
     consumption

 2. Global consumption patterns & impacts
 Global consumption is putting unsustainable and increasing stress on:
 •   The Earth’s ecosystems – 60% of the Earth’s ecosystem services have been degraded in the past 50 years
 •   The supply of energy and material resources needed for industrial growth – Natural resource consumption is
     expected to rise to 170% of the Earth’s bio-capacity by 2040
 •   Human social systems and well-being – Human well-being does not necessarily rely on high levels of consumption

 3. The role of the consumer
 Consumer attitudes and behaviors:
 •   Consumers are increasingly concerned about environmental, social and economic issues, and increasingly willing to
     act on those concerns
 •   Consumer willingness often does not translate into sustainable consumer behavior because of a variety of factors –
     such as availability, affordability, convenience, product performance, conflicting priorities, skepticism and force of
     habit

 4. The role of business – mainstreaming sustainable consumption
 The business case: Business approaches to sustainable consumption can be grouped into three broad categories:
 •   Innovation – business processes for the development of new and improved products, services and business are shifting
     to incorporate provisions for maximizing societal value and minimizing environmental cost
 •   Choice influencing – the use of marketing and awareness-raising campaigns to enable and encourage consumers to
     choose and use products more efficiently and sustainably
 •   Choice editing – the removal of “unsustainable” products and services from the marketplace in partnership with
     other actors in society

 5. The challenge ahead & options for change
 •   To be able to lead sustainable lifestyles based on informed purchasing decisions and changes in behavior, consumers
     need the support of all actors: business, governments and civil society
 •   Business sees a need for further dialogue with stakeholders (such as consumers, retailers, marketers, policy-makers,
     NGOs) and between businesses to define sustainable products and lifestyles and to formulate actionable responses
 •   Leading businesses have the capacity to mainstream sustainable consumption and stakeholders welcome the
     opportunity to work alongside business moving forward.

                                                                               6
Sustainable Consumption Facts and Trends - From a business perspective The Business Role Focus Area - WBCSD
Introduction:
                                                                                   Sustainable consumption

Sustainable production & consumption from a                                        Policy agendas
business perspective                                                               Governments and policy-makers at all levels have a
Sustainable production and consumption involves business,                          vital role to play in creating the right legal, fiscal and
government, communities and households contributing                                cultural environment for sustainable businesses to thrive.
to environmental quality through the efficient production                          For example, national sovereignty and differing legal
and use of natural resources, the minimization of wastes,                          frameworks require nations and regions to cooperate in
and the optimization of products and services. The WBCSD                           today’s world of global markets and global environmental
recognizes the need for business to take a leadership role                         and social challenges.
in promoting sustainable patterns of production and
                                                                                   The need for policies that foster sustainable consumption
consumption that meet societal needs within ecological
                                                                                   has been recognized as a priority at international and
limits. Business can best work towards these goals through
                                                                                   European levels, informed, in part, by support and
responsible environmental management, enhanced
                                                                                   influence from the business community.
competitiveness and profitable operations.
WBCSD Policy Statement, May 1995
                                                                                   •   International: The development of a ten-year framework
Source: WBCSD, Sustainable Production & Consumption from a Business Perspective,       on sustainable consumption and production is led by
1997.
                                                                                       the United Nations Environment Programme (UNEP) and
                                                                                       the United Nations Department of Environmental and
                                                                                       Social Affairs (UN DESA) through the Marrakech Process.
                                                                                       This includes organizing regional consultations; building
An international agenda
                                                                                       regional strategies and implementation mechanisms,
The sustainable consumption challenge emerged as a                                     with regional and national ownership; implementing
key issue in 1992 at the United Nations Conference on                                  concrete programs and projects; and monitoring,
Environment and Development in Rio de Janeiro. Ten years                               evaluating and sharing information on progress.
later, at the World Summit on Sustainable Development
in Johannesburg, the international community was
                                                                                   •   European Union: The sustainable development strategy
                                                                                       adopted by the European Council in June 2006 included
called upon to improve global living conditions and to
                                                                                       the task of developing an action plan for sustainable
“encourage and promote the development of a ten-year
                                                                                       production and consumption in Europe. This plan
framework of programs on sustainable consumption and
                                                                                       includes leveraging innovation through leadership and
production (SCP) in support of regional and national
                                                                                       networking; using dynamic performance requirements,
initiatives to accelerate the shift towards SCP.”
                                                                                       sustainability labels, eco-design instruments and
                                                                                       standardization to result in the production of better
                                                                                       products; measures to encourage leaner and cleaner
Working definition of sustainable production &                                         production processes; fostering smarter consumption
consumption                                                                            by means of retailer agreements, market-based
                                                                                       instruments, value added tax rates, the EU Eco-Label,
“The use of goods and services that respond to basic needs
                                                                                       advertising, and green procurement; and working for
and bring a better quality of life, while minimizing the use
                                                                                       global markets that reward first movers and provide
of natural resources, toxic materials and emissions of waste
                                                                                       a level the playing field for producers of sustainable
and pollutants over the life cycle, so as not to jeopardize
                                                                                       technologies and products.
the needs of future generations.”
United Nations Commission on Sustainable Development (UNCSD),
                                                                                   •   Business: In 2007 the WBCSD developed policy
Symposium on Sustainable Consumption, Oslo, 1994.2                                     recommendations on climate change as input
                                                                                       into the post-Kyoto negotiation process.3 These
                                                                                       recommendations include: encouraging energy
                                                                                       efficiency; broadening the range of fuels in the transport
                                                                                       sector; and creating awareness and incentives for
                                                                                       widespread take-up of low-carbon products, services
                                                                                       and lifestyles by consumers.

                                                                 7
Global drivers of consumption

1                                 Global consumption levels and patterns are driven at the most
                                  fundamental level by:

                                  •   Rapid global population growth
                                  •   The rise in global affluence – middle- and lower-income consumers
                                  •   A culture of “consumerism” among higher income groups

                                                                                        10
    Population growth and economic development are driving
                                                                                         9
    consumption around the world and will continue to do so
    as billions of consumers – especially in China, India and                            8

    other emerging economies – add to the demand for goods                               7

                                                                       Billion people
    and services. The market pressure created by competitive                             6
                                                                                                                                                                                       Sustainable
    spending and conspicuous consumption turn the affluence                              5                                                                                             population
    of some into the exclusion of many.                                                                                                                                                at a middle
                                                                                         4                                                                                             income level

    There will be an estimated 9 billion people in                                       3

    2050.                                                                                2

                                                                                                                                                                                       Sustainable
    World population is projected to reach 9 billion by 2050,                            1
                                                                                                                                                                                       population
                                                                                                                                                                                       at a high
    driven largely by growth in developing countries and                                                                                                                               income level
                                                                                              1950

                                                                                                      1960

                                                                                                                1970

                                                                                                                            1980

                                                                                                                                   1990

                                                                                                                                          2000

                                                                                                                                                   2010

                                                                                                                                                           2020

                                                                                                                                                                  2030

                                                                                                                                                                         2040

                                                                                                                                                                                2050
    countries with lower per-capita incomes.4 Recent studies
    show that we are already exceeding the Earth’s ability                                    World                                                Asia (excl. Middle East)
                                                                                              Developing countries                                 China
    to support our lifestyles, and have been doing so for
                                                                                              Developed countries                                  India
    approximately twenty years.5
                                                                       Figure 1: World population is projected to reach 9 billion by 2050;
    World GDP is projected to grow by 325%                             unsustainable at a middle income level (global average).
                                                                       Source: World Resources Institute (WRI)/Earthtrends, 2008.6
    between 2007 and 2050.
    On average, around 60% of gross domestic
                                                                       GDP is set to overtake that of the US by 2025; India’s GDP is
    product (GDP) is accounted for by consumer
                                                                       expected to rival that of Japan at around the same time, and
    spending on goods and services.
                                                                       come close to that of the US by 2050. By 2050, the GDPs of
    World GDP is projected to grow by 325% between 2007 and            Mexico, Brazil, Russia and Indonesia are all projected to have
    2050 as strong GDP growth is forecast to be accompanied by         outgrown that of the UK (currently the world’s 6th largest
    population growth. The already populous nations of China           economy). Most of the other emerging market economies
    and India are likely to be among the fastest growing – China’s     look set to overtake the UK in GDP terms by 2050.7

                                                                                                     The expanding world middle class
    The number of middle-class consumers worldwide                        4,500                      People with income
                                                                                                     between US$ 6,000 and US$ 30,000
    is expected to triple by 2030.                                                                   in millions of people
                                                                         4,000
    Projected rises in the GDP of developing countries are
    expected to accompany a three-fold increase in the number             3,500                                              World

    of middle-income consumers. By 2025 there are expected                2,500
                                                                                                                             World excl.
    to be 220 million middle-income consumer households in                                                                   China and India

    China alone – approximately four times as many as there              2,000                                               China
    were in 2004.8 According to Goldman Sachs, 70 million
                                                                          1,500
    people each year are entering an income bracket equivalent                                                               India

    to between US$ 6,000 and US$ 30,000 in purchasing                    1,000

    power parity terms. This phenomenon may continue for
                                                                                        500
    the next twenty years, accelerating to 90 million new
    middle-income consumers per year by 2030. If this proves                             0
    to be the case, then 2 billion people will have joined the                               1960            1970          1980    1990          2000 2010        2020 2030 2040            2050

    ranks of the middle class by that date, bringing almost 80%        Figure 2: Middle classes in developing countries projected to grow by 300% by
                                                                       2030.
    of the world population into the middle-income bracket.9           Source: Goldman Sachs, 200810.

                                                                                                                       8
Signs of a new “global middle class” with
common consumption patterns are emerging.
Globalization and economic integration are giving more
consumers access to more products and services. Local and
national boundaries are breaking down in the setting of
social standards and aspirations in consumption.

Market research is starting to identify categories of “global
middle-class consumers” and “global elites” that share a
preference for global brands.

                                                                                                 Low-income consumers account for almost two-thirds of the world’s
             Health
                                        ICT Transportation                                       population and have a combined spending power of approximately
                                                                                                 US$ 5 trillion.
                                    Water      Other
                                                                                                 Four billion people earn less than US$ 3,000 per year (the equivalent of US$ 3.35
                                                                                                 per day). Low-income consumers have a combined spending power of
                                                                                                 approximately US$ 5 trillion. Food tends to dominate low-income household
             Energy
                                                                                                 budgets (Figure 3a). As incomes rise, the share spent on food often declines, the
                                                                                                 share for housing remains relatively constant, and the shares for transportation
                                                            Food                                 and telecommunications grow rapidly11 (Figure 3b); in Africa, 71% of
                                                                                                 expenditure comes from low-income consumers, who make up 95% of the
             Housing                                                                             population.

                                                                                                                                  Population        Market size of Percentage of Percentage of the
                                                                                                                                                   the low-income the region's region's purchasing
                                                                                                                                                      segment       population        power
Figure 3a. Relative estimated values of low-income
market sectors. Total consumer expenditure in                                                     Asia (incl. Middle East) 2.86 billion US$ 3.47 trillion                        83%                     42%
these sectors equals US$ 5 trillion. The size of
each segment on the graph reflects its share of                                                   Eastern Europe                  254 million US$ 458 billion                    64%                     36%
expenditure among low-income consumers.
Source: IFC/WRI, The Next Four Billion, 2007.                                                     Latin America                   360 million US$ 509 billion                    70%                     28%
                                                                                                  Africa                          486 million US$ 429 billion                    95%                     71%

                                                                                                 Figure 3b. Estimated low-income market by region.
                                                                                                 Source: IFC/WRI. The Next Four Billion, 2007. For more information see also WBCSD, Doing Business with the World, 2007.

                                         Footprint by national average per person income, 1961-2003
                                                                                                                                Consumption and wealth: A culture of
                                    7
                                                                                                                                consumerism
                                    6                              High-income countries                                        Relatively wealthy consumers account for by far the
Global hectares per person (2003)

                                                                                                                                greatest per-capita share of consumption expenditure and
                                    5
                                                                                                                                environmental footprint. According to estimates by World
                                    4                                                                                           Wildlife Fund (WWF), three planets would be required were
                                                                                                                                everyone to adopt the consumption patterns and lifestyles
                                    3                                                                                           of the average citizen from the United Kingdom; five
                                                                   Middle-income countries                                      planets, were they to live like the average North American.12
                                    2

                                                                                                                                The United Nations Development Programme (UNDP)
                                    1                              Low-income countries
                                                                                                                                describes conspicuous consumption as places where there
                                         Note: Dotted lines reflect estimates due to dissolution of the USSR                     is heavy societal pressure to maintain high consumption
                                    0
                                        1960             1970              1980              1990             2000   03         patterns and where competitive spending and displays of
Figure 4: Consumers in wealthy countries account for the greatest per-capita                                                    wealth are encouraged by society.
environmental footprint.
Source: WWF, Living Planet Report, 2006.

                                                                                                    9
Global consumption patterns & impacts

2                                           Global consumption patterns and trends are putting unsustainable
                                            and increasing stress on:

                                                •    The Earth’s ecosystems
                                                •    The supply of material resources needed for industrial growth
                                                •    Human social systems and well-being

    “Peak demand for electricity in Pakistan has been growing
    at 6.6% per annum since 2001, and the supply shortage
    has occurred much earlier than expected. It is, therefore, in
    everyone’s interests for us to help consumers save energy.”
    Pakistan State Oil Company, 2007.                                                                          Studies show that two-thirds of
                                                                                                               the Earth’s ecosystem services
                                                                                                               are in decline.
       Balance sheet: Ecosystem services
                                                                                                               Nature provides essential resources
        Provisioning services                             Regulating services                                  to the system of production-
        Food                           crops              Air quality regulation                               consumption, including provisioning
                                    livestock             Climate regulation – global
                                                                                                               services, or products, such as
                        capture fisheries                  Climate regulation – regional and local
                                                                                                               timber and fish, and regulation
                               aquaculture                Water regulation
                                                                                                               services, such as climate control,
                                wild foods                Water purification and waste treatment
                                                                                                               pollination, irrigation and flood
        Fiber                         timber        +/-   Disease regulation                        +/-
                               cotton, silk         +/-   Pest regulation                           +/-
                                                                                                               regulation. According to the
                                   wood fuel              Natural hazard regulation                            Millennium Ecosystem Assessment
        Genetic resources                                 Cultural services                                    (MA), 60% are being degraded
        Biochemicals, medicine                            Spiritual and religious values                       or used unsustainably, including
        Water                   freshwater                Aesthetic values                                     70% of provisioning and regulating
                                                          Recreation and ecotourism                            ecosystem services.13 Ecosystem
            globally enhanced
            globally degraded                                                                                  services enhancements over the past
                                                                                                               50 years have primarily involved
       The MA evaluated the global status of provisioning, regulating and cultural services.                   food production: crops, livestock,
       An upwards arrow indicates that the condition of the service globally has been enhanced
       and a downwards arrow that it has been degraded in the recent past.                                     and aquaculture (Figure 5). 10-30%
                                                                                                               of mammal, bird and amphibian
    Figure 5: Changes in the provision of ecosystem services show declines in                                  species are currently threatened with
    two-thirds of the Earth’s provisioning and regulating ecosystem services.
    Source: Millennium Ecosystem Assessment, 2005.                                                             extinction.14

                        Asia                                                                                   Almost 30% of the Earth’s terrestrial
                                                                                                               area, comprising 2 billion hectares
      Europe and Russia
                                                                                                               of forest and 1.5 billion hectares of
    Central America and
          the Caribbean                                                                                        grassland, has been converted to
                                                                                                               urban areas or cropland (Figure 6).15
          North America
                                                                                                               According to estimates, almost a third
           South America                                                                                       of the Earth’s plants and animals
      sub-Saharan Africa
                                                                                                               have been lost since 1970.16 Current
                                                                                                               extinction rates are approximately
         Middle East and
            North Africa                                                                                       one hundred times higher than the
                  Oceania
                                                                                                               fossil record. The MA predicts that
                                                                                                               extinctions could increase further by a
                               0                10            20               30            40           50
                                                                                                               factor of ten.17
                               % of land converted

    Figure 6: Conversion of natural ecosystems to urban areas or cropland by region, 2005.
    Almost half of Asia’s land area has already been converted.
    Source: WRI/EarthTrends, 2005.

                                                                                                          10
Valuing and paying for natural resources
Market mechanisms can be powerful complements to existing strategies for conserving critical ecosystems services such as
water, fiber and food. Markets for ecosystems can be created via:

1. Certification – helping consumers make informed choices
2. Direct payments – creating positive incentives for resource managers to supply ecosystem services
3. Tradable permits – using regulated markets to manage environmental liabilities.

For more information, see International Union for Conservation of Nature (IUCN)/WBCSD, Business and Ecosystems, 2007.18

                                                                                                                                         Ecological footprint and biocapacity by region, 2003
It is reported that natural resource consumption
                                                                                                     10
by humans has increased to 125% of global                                                                                                                                                                             North America                                          Latin America and
                                                                                                                                                                                                                                                                             the Caribbean
                                                                                                                                                                                                                      Europe EU
carrying capacity, and could rise to 170% by 2040.                                                                                                                                                                                                                           Asia-Pacific
                                                                                                                  8                                                                                                   Europe non-EU
                                                                 Global hectares per person (2003)

                                                                                                                                                                                                                                                                             Africa
According to WWF, humanity’s “ecological footprint”                                                                                         -3.71                                                                     Middle East and
                                                                                                                                                                                                                                                                            Biocapacity available
                                                                                                                                                                                                                      Central Asia
(a measure of the pressure on Earth from human                                                                    6
                                                                                                                                                                                  +3.42
                                                                                                                                                                                                                                                                            within region

consumption of natural resources) has increased to 125%                                                                                                     +0.82

of global carrying capacity and could rise to 170% by                                                             4
                                                                                                                                                                      -1.20
2040.19                                                                                                                                             -2.64
                                                                                                                  2
                                                                                                                                                                                                                                                                                                        +0.24
The most important direct drivers of biodiversity loss and                                                                                                                                                                                 -0.60

ecosystem service changes are: habitat change (such as                                                            0
                                                                                                                                           326      454       349 270              535                                                     3489                                                               847
land-use changes, physical modification of rivers or water                                                                                                                                     Population (millions)
withdrawal from rivers, loss of coral reefs, and damage to
sea floors due to trawling), climate change, invasive alien      Figure 7: More developed/populous regions consume at rates beyond available
                                                                 natural resources.
species, overexploitation and pollution.20 For this reason,      Source: World Wildlife Fund (WWF), Living Planet Report, 2006.
economic activity and population density tend to be
                                                                 wants vary considerably. According to the United
correlated with the size of the ecological footprint. Figure 7
                                                                 Nations Environment Programme/Wuppertal Institute
shows that North America, the EU and the Asia-Pacific
                                                                 Collaborating Centre on Sustainable Consumption and
region currently consume at rates well beyond their natural
                                                                 Production (UNEP CSCP), on average, almost a third of
resources (referred to as “biocapacity” in Figure 7).
                                                                 each person’s material requirements are for housing,
The materials required to satisfy human needs and                and a fifth are for food.

Food and drink have the highest levels of ecological
                                                                                                                                         1,600
impact per dollar spent, according to WWF.
                                                                                                                                         1,400
                                                                                                     Global hectares per person (2003)

In its One Planet Business report, the WWF states that
                                                                                                                                         1,200
each US$ 1 million spent by consumers on food has an
ecological footprint of approximately 1,500 hectares                                                                                     1,000

(Figure 8). Food and drink are reported to have the                                                                                         800

highest footprint per dollar spent, followed by household                                                                                   600
equipment and housing.
                                                                                                                                            400

In terms of absolute consumption impacts, food, transport                                                                                   200
and housing are seen as the most significant.21 Food is
                                                                                                                                                0
described as the most important ecological footprint
                                                                                                                                                       Food

                                                                                                                                                                 Alcoholic bev.
                                                                                                                                                                & tobacco, etc.

                                                                                                                                                                                    Clothing

                                                                                                                                                                                                Housing

                                                                                                                                                                                                            Housing
                                                                                                                                                                                                          equipment

                                                                                                                                                                                                                        Health

                                                                                                                                                                                                                                 Personal mobility

                                                                                                                                                                                                                                                     Communication

                                                                                                                                                                                                                                                                     Recreation
                                                                                                                                                                                                                                                                      & culture

                                                                                                                                                                                                                                                                                  Education

                                                                                                                                                                                                                                                                                                     Hotels
                                                                                                                                                                                                                                                                                              & restaurants

                                                                                                                                                                                                                                                                                                                Other

because of great impacts at both the production and
consumption stages. Housing is reported to use both the
most materials and the most energy, contributing to its
high footprint.22
                                                                 Figure 8: Ecological footprint per US$ 1 million spent by consumers.
                                                                 Source: Global Footprint Network (GFN)/WWF, One Planet Business Global Evidence Base, 2006.

                                              11
Global consumption patterns and impacts

 Type of economy              Example countries                                  Main sustainability challenge

 Consumer                     US, Japan, Western Europe                          Dramatically lowering resource use while maintaining economic output
                                                                                 (“Factor 10”)

 Emerging                     China, South-East Asia,                            Leapfrogging to sustainable structures of consumption and production
                              some countries in South America                    without copying western examples first

 Developing                   Many countries in Africa,                          Developing dedicated solutions for the “low-income segment of the
                              some countries in South America                    population”; providing a basis for sustainable growth

Figure 9: Sustainable consumption challenges by type of economy.
Source: Sustainable Consumption Research Exchanges (SCORE!), System Innovation
for Sustainability 1: Perspectives on Radical Changes to Sustainable Consumption and         according to Sustainable Consumption Research Exchanges
Production, 2008.
                                                                                             (SCORE!) an EU funded network project in support of
                                                                                             the UN’s 10 year framework program on sustainable
Studies show that consumption pattern impacts                                                consumption and production.
vary considerably by geography, income and
                                                                                             Figure 12 highlights the need for solutions that are
demographics.
                                                                                             appropriate to local conditions. Sustainability experts
Consumption levels and patterns vary considerably by                                         from Brazil, China, Germany, Hungary, India, Italy, Mexico,
geography, income and demographics. The associated                                           Russia and the US describe the challenges and priorities
sustainability challenges also differ markedly per type of                                   they see I their countries and regions. While many of
economy (Figure 9). Poorer people (who are responsible                                       the challenges of sustainable development are similar
for emitting the lowest levels of greenhouse gases) are                                      everywhere, priorities and perspectives differ widely
disproportionately vulnerable to the loss of biodiversity                                    from region to region. Emerging economies in particular
and ecosystem services. They will also suffer most from                                      expect multinationals to contribute to the development
the impacts of climate change, such as flooding, reduced                                     of their countries. In industrialized countries, maintaining
access to clean freshwater, health and social problems                                       competitiveness is seen as a key challenge.

                                                                                             Figure 10: Higher levels of human development
                                                                                             tend to be associated with unsustainable
                                                                                             ecological impacts.
                                                                                             Source: Global Footprint Network (GFN), 2006.

            Exceeds Earth’s average capacity
            per person, low development

            World average biocapacity available per person, ignoring the needs of wild species

            Within Earth’s average capacity
            per person, low development

0                          0.1                           0.2                           0.3                    0.4                        0.5         0.6             0

                                                                                                                            Human Development Index            Count

    Europe EU                          Asia-Pacific                       Latin America and             Middle East and
                                                                         the Caribbean                 Central Asia                            More than    100 millio
    Europe non-EU                      Africa                                                                                                  1 billion    1 billion
    North America

                                                                                                               12
Well-being is not necessarily correlated with high
           levels of consumption
           The New Economics Foundation’s Happy Planet Index
           ranks a nation’s progress based on the amount of the
           Earth’s resources its inhabitants use and the length and
           happiness of people’s lives. Although this is a contentious
           area of research, it yields some interesting insights.
           According to the study, a high consumption level does
           not necessarily guarantee happiness. It claims that people
           can live long, happy lives without using more than their
           “fair share” of the Earth’s resources. While no country
           combines high GDP with low life satisfaction, many poorer
           countries achieve levels of life satisfaction just as high as
           their wealthier neighbors.23 Above a minimum level, there
           is no apparent correlation between per capita GDP and life
           satisfaction.
                                                                                                                                                                     The UN’s Human Development Index associates increased
                                                                                                      12                                                             development and GDP with unsustainable ecological
                                                                                                                                                                     impacts (Figure 10). The inhabitants of those nations
                                                          Exceeds Earth’s average
                   Threshold for high human development

                                                                                                      11                                                             with the highest levels of human development, such as
                                                          capacity per person,                                                                                       Canada and the US, consume ecosystem services at rates
                                                          high development                                                                                           far higher than the Earth can regenerate them. Nations in
                                                                                                      10                                                             which consumption levels do not overstress the Earth’s
                                                                                                                                                                     regenerative capabilities, such as India and China, tend
                                                                                                                                                                     to fall below the UN’s threshold for adequate human
                                                                                                      9
                                                                                                           Ecological footprint (global hectares per person, 2003)

                                                                                                                                                                     development. As development proceeds in these countries,
                                                                                                                                                                     the strain on biological resources is likely to increase.
                                                                                                      8

                                                                                                                                                                     Human health is an important element of well-being, and
                                                                                                      7
                                                                                                                                                                     one that can be affected both positively and negatively by
                                                                                                                                                                     consumer products and services. In recent years the health
                                                                                                      6                                                              effects of over-consumption of products such as tobacco
                                                                                                                                                                     and products with a potential to fuel obesity have exposed
                                                                                                                                                                     manufacturers to significant legal liabilities.
                                                                                                      5
                                                                                                                                                                                                 Claims and litigation on tobacco and obesity, US
                                                                                                                                                                                       40                                                                      80
                                                                                                      4

                                                                                                                                                                                                         Tobacco-related damages
                                                                                                                                                                                       30                                                                      60
                                                                                                      3
                                                                                                                                                                                                         Tobacco-related rulings
                                                                                                                                                                     Million dollars

                                                                                                                                                                                                         Obesity-related rulings
                                                                                                                                                                                       20                                                                      40
                                                                                                                                                                                                                                                                    Rulings

                                                                                                      2

                                                                                                                                                                                       10                                                                      20
                                                                Meets minimum criteria                1
                                                                for sustainability

                                                                                                      0                                                                                0                                                                       0
                                                                                                                                                                                            70

                                                                                                                                                                                                    74

                                                                                                                                                                                                           78

                                                                                                                                                                                                                    82

                                                                                                                                                                                                                              86

                                                                                                                                                                                                                                    90

                                                                                                                                                                                                                                          94

                                                                                                                                                                                                                                                98

                                                                                                                                                                                                                                                      02
                                                                                                                                                                                        19

                                                                                                                                                                                                   19

                                                                                                                                                                                                         19

                                                                                                                                                                                                                   19

                                                                                                                                                                                                                            19

                                                                                                                                                                                                                                   19

                                                                                                                                                                                                                                         19

                                                                                                                                                                                                                                               19

                                                                                                                                                                                                                                                     20

0.7                                         0.8                          09                     1.0
                                                                                                                                                                     Figure 11: Trends in legal claims and litigation cases regarding tobacco, obesity,
ry population (colored by region):                                                                                                                                   and food marketing practices in the US show risks to human health and well-
                                                                                                                                                                     being can also be risks for business.
                                                                                                                                                                     Source: SustainAbility/Insurance Information Institute, The Changing Landscape of
                                                                                                                                                                     Liability: A Director’s Guide to Trends in Corporate Environmental, Social and Economic
on –     30 million –                                     10 million –   5 million –   less than                                                                     Liability, 2004.
         100 million                                      30 million     10 million    5 million

                                                                                           13
Global consumption patterns and impacts

   Key areas                    Expectations in industrial countries                        Expectations in emerging economies

   Economic                     Remain competitive and offer development                    Contribute to the country’s development, especially in
   development                  opportunities to emerging economies                         structurally weak regions

   Ethics and                   Promote the adoption of environmental and social            Act ethically and legally
   management                   standards, throughout the value chain, especially
                                                                                            Establish high environmental and social standards, and
                                among suppliers
                                                                                            set an example for suppliers and competitors
                                Create transparency, regarding economic, ecological
                                                                                            Help to build management competencies and
                                and social aspects of corporate activities, especially in
                                                                                            institutions
                                emerging economies
                                Support human rights

   Employees and jobs           Promote job security through employee training and          Create jobs and train employees
                                development
                                                                                            Ensure occupational safety and health protection
                                Proactively address challenges like equal opportunity
                                                                                            Promote and raise employee awareness of
                                and population aging
                                                                                            environmental protection

   Products and                 Ensure product safety                                       Develop and market quality products for those at the
   marketing                                                                                bottom of the affluence pyramid
                                Offer quality products at fair prices
                                                                                            Ensure that products are safe and environmentally
                                Promote sustainable consumption through ethically
                                                                                            compatible
                                and ecologically sound products, and by informing
                                consumers and raising their awareness                       Consider the cultural and social context

   Resource efficiency    Stronger focus on products: dematerialization of                  Transfer know-how and modern energy- and resource-
   and climate protection the economy by moving from product- to service-                   conserving technologies
                          oriented business models
                                                                                            Satisfy growing consumer needs with products that use
                                Help to reduce greenhouse gas emissions                     limited resources efficiently

   Social commitment            Work toward meeting the United Nations’                     Support and promote, in particular, disadvantaged
                                Millennium Development Goals                                children and young people
                                Help to solve social problems, also by encouraging          Raise public awareness of environmental protection
                                employee volunteering
                                                                                            Promote education and research for sustainable
                                                                                            development

Figure 12: Expectations of businesses in industrialized and emerging economies.
Source: Henkel, 2007.

Key issues for business
from IUCN/WBCSD, Business and Ecosystems, 2007.

• Financial – Changes in fiscal and tax regimes to internalize environmental and social
  costs resulting in higher cost of capital and more rigorous lending requirements
• Regulatory & legal – Increased regulatory constraints as governments seek to protect
  degraded ecosystem services and human health
• Reputational – Risk to reputation, brand equity, and license to operate for businesses
  most directly linked with threatened ecosystems, resources or risks to health and well-
  being
• Operational – Substantial increase in cost of important inputs (such as water or
  agricultural products); increased vulnerability of assets to floods or other natural
  disasters; conflict and corruption that may arise in areas plagued by scarcity of
  ecosystem services

                                                                                               14
The role of the consumer

                Consumer attitudes & behaviors
                                                                                                                                                 3
                •   Consumers are increasingly concerned about environmental, social and economic
                    issues, and increasingly willing to act on those concerns; however
                •   Consumer willingness is not translating into sustainable consumer behavior.
                    A variety of barriers have been identified, such as availability, affordability,
                    convenience, product performance, conflicting priorities, skepticism and force of
                    habit.

                                               Chapters 1 and 2 examined current and projected patterns of global
                                               consumption and its impacts. This Chapter examines the consumers themselves,
                                               including their attitudes to sustainable consumption, relevant aspects of their
                                               lifestyles, and their role in driving more sustainable patterns of consumption.

Awareness and concern                                               Global consumer attitudes to sustainability
According to recent studies of consumer attitudes in                A 2008 survey by the National Geographic Society and
developed markets, awareness of environmental and social            GlobScan on consumer choice and the environment
issues is entering the mainstream:                                  reported on current behavior in fourteen countries
                                                                    (including Canada, China, France, Germany, India, Mexico,
•    96% of Europeans say that protecting the environment is
                                                                    Russia, the UK and the US). The study found signs that
     important for them personally. Two-thirds of this group
                                                                    consumers in all countries “feel empowered when it comes
     say that it is “very important”.24
                                                                    to the environment and are taking some action in their
•    Nearly one in four US adults now subscribes to a new           daily lives to reduce consumption and waste.”27
     set of values that typically includes “environmentalism,
                                                                    A global Synovate survey conducted in 2007 in association
     feminism, global issues and spiritual searching”. These
                                                                    with Aegis, and repeated in 2008 in association with BBC
     “cultural creatives” are well educated, relatively affluent,
                                                                    World,28 also found that consumers in most countries are
     and typical of the kind of consumer responsible for the
                                                                    becoming more aware and willing to act on environmental
     success of hybrid cars.25
                                                                    concerns. The US had the largest rise of all, from 57% in
•    In the UK, 18% of consumers are willing, able and              2007 to 80% in 2008. Chinese consumers also showed
     motivated to take action on environmental issues.              increased willingness to act on their concerns about
     These “positive greens” are strongly influenced by             climate change.
     sustainability issues in their consumption choices and
     lifestyles, but remain attached to conventional car use,
                                                                     Reported behavior change                          2007 (%)        2008 (%)
     frequent flying and supermarkets.26
                                                                     Saving power                                            76             81
                                                                     Recycling                                               65             70
                                                                     Reducing water consumption                              65             69
                                                                     Using less packaging and bags                           56             68
    Important note for this chapter: The data gap                    Buying green products                                   53             61

    Data linking the use of ecosystem services with                  Buying energy efficient devices                          53             59

    consumption is less prevalent than data on the direct            Informing oneself about climate change                  46             58

    impacts of production. According to the United                  Figure 13: Consumer awareness and willingness to act on environmental
    Nations Environment Programme/Wuppertal Institute               concerns is rising in most countries.
                                                                    Source: Synovate/Aegis, 2007; Synovate/BBC World 2008.
    Collaborating Centre on Sustainable Consumption and
    Production (UNEP CSCP), 80% of data currently collected
    focuses on impacts from manufacturing; however 80% of           Because this behavior is self-reported, it is an unreliable indicator of real
                                                                    behavior; however, repetition of the survey in successive years is indicative
    the impacts themselves occur during end use.                    of the trend towards greater consumer concern and engagement on climate
                                                                    change.
    There is a need for further research linking self-reported
    behavior (as represented by the majority of existing
    studies) with empirical data on real behavior, because
    self-reported behavior is a poor descriptor or predictor of
    real behavior.

                                                 15
The role of the consumer

Willingness
Consumers in rapidly developing and developed markets – particularly China, Australia, Sweden and the US – report a
propensity to buy from companies with a reputation for environmental and social responsibility (Figure 14)29; and, in a
study by the European Union, 75% of respondents agreed that they would pay more for environmentally friendly products
(Figure 15).

                   80                                                    Percentage of respondents agreeing to the                                                                               Don’t know
                                                                         statement “I would be more likely to purchase
                                                                         products or services from a company with a
                                                                                                                                                                        Totally disagree
                   70                                 67
                                                                         good reputation for environmental
                                                                         responsibility.”
                   60
                                                                                                                                                                                                                            Please tell me whether
                        52                                                                                                                                                                             Totally agree        you totally agree, tend to
                   50                                                                                                                                    46                   Tend to         5 6                           agree, tend to disagree
% of respondents

                                                                                                                                                                  42                                    25
                                                                                                         40                                                                  disagree                                       or totally disagree with
                   40
                                                                                                                 35                                                                     14                                  the following statement:
                                             34                                                  33
                                    32                                                                                                  32
                                                                                                                               30
                   30                                                  28        27
                                                              23
                                                                                                                                                                                                                            You are ready to buy
                                                                                                                                                 18
                                                                                                                                                                                                                            environmentally friendly
                   20
                                                                                                                                                                                                  50                        products even if they
                                                                                                                                                                                                                            cost a little bit more.
                   10
                                                                                                                                                                                             Tend to agree
                    0
                        Australia

                                    Brazil

                                             Canada

                                                      China

                                                              France

                                                                       Germany

                                                                                 Great Britain

                                                                                                 Italy

                                                                                                         Japan

                                                                                                                 Netherlands

                                                                                                                               Norway

                                                                                                                                        Russia

                                                                                                                                                 Spain

                                                                                                                                                         Sweden

                                                                                                                                                                  USA

                                                                                                                                                                        Figure 15: Consumers report a willingness to pay more for “environmentally
                                                                                                                                                                        friendly” products or services.30
                                                                                                                                                                        Source: European Commission Directorate General Environment/Eurobarometer 295,
Figure 14: Consumers globally report a greater propensity to buy from                                                                                                   Attitudes of European Citizens towards the Environment, 2008.
companies with a reputation for environmental responsibility
Source: Tandberg, 2007.

While these studies are not necessarily a reliable
indicator of behavior, they are indicative of shifting
consumer values and ideals.

Consumer attitudes in emerging markets: Focus on India

In 2008, the WBCSD’s Future Leaders Team31 spoke                                                                                                                        >   The role of brands. Middle and high income Indian
with young business professionals about sustainable                                                                                                                         consumers are very brand conscious, so brand owners
consumption in India. These young business people also                                                                                                                      can play a major role, both in changing their practices
represented young Indian consumers, mainly from the                                                                                                                         and in educating their consumers.
middle and upper socio-economic groups. Following are
                                                                                                                                                                        >   The role of business. Participants felt that sustainability
some of the insights gathered with regard to sustainable
                                                                                                                                                                            and CSR should be embedded into corporate strategies,
consumption – and its prospects – in India:
                                                                                                                                                                            including the responsible investment of company assets
>                  Consumption patterns. Indian household incomes are set                                                                                                   and the encouragement of social entrepreneurship.
                   to almost triple over the next two decades.                                                                                                              Significant opportunities exist in the development of
                                                                                                                                                                            new sustainable markets, such as for eco-products, non-
>                  Consumer awareness. Awareness and understanding of
                                                                                                                                                                            petroleum-based products, sustainable buildings and
                   sustainable consumption among consumers was low; the
                                                                                                                                                                            public transport.
                   majority of Indian consumers still buy small, unpackaged
                   goods from low-cost, family-run shops. Even to wealthier                                                                                             >   The role of governments. Support from government
                   Indian consumers, sustainable consumption was felt to                                                                                                    is essential, since some businesses will always seek to
                   imply only consuming less; the concept of consuming                                                                                                      place profit before cost, even if the majority behaves
                   differently is “a significant but missing factor”.                                                                                                       responsibly: “One of the most important aspects is
                                                                                                                                                                            to work closely with government – setting the law,
                                                                                                                                                                            regulations and tax framework.” (HSBC)

                                                                                                                                                                                         16
The gap between consumer attitudes and behavior
       Willing to pay
                         21
            and does                                                                        People don’t always act on environmental and
   Willing to pay but
                         13                                                                 social concerns
   doesn’t currently                           Can’t afford     Lack of
                                                     to pay     knowledge
                                                                is a barrier                Despite significant shifts in levels of awareness, concern
                                         Won’t             8 13                             and general attitudes to environmental and social issues,
     Concerned but                       compromise
    not willing to act
                         53
                                         convenience
                                                       9                                    many consumers have not made the same shifts in general
                                                           9 13
                                                                                            behaviors, lifestyles and purchasing decisions. Consumers
                                                        Both    Don’t want to
Not concerned about                               price and     compromise                  are more likely to adopt environmentally responsible
                         13                    convenience      quality
    the environment                                                                         behaviors if both cost-efficient and convenient. A McKinsey
                                                  are issues
                                                                                            survey of consumers in Brazil, Canada, China, France,
                                                                                            Germany, India, UK and the US found that 53% were
Figure 16: Global retail consumers segmented by willingness to pay for products             concerned about environmental and social issues, but not
with environmental & social benefits – Survey of consumers in Brazil, Canada,               willing to take action at the shops (Figure 16); a further
China, France, Germany, India, the UK and the US.
Source: The McKinsey Quarterly, March 2008.                                                 13% were willing to pay more, but currently did not do so.

In the UK, where the                                                                                                                    1,000kg/household
government provides financial                                                                                                           High CO2 impact
and practical help to install                                                                  Avoid
insulation and recycle rubbish,                                                             unnecessary
                                                                                               flights                                                          High impact and
consumers are more likely                                                                   (short haul)                                                        common behavior
to take those actions than to
purchase fewer short-haul
                                                                                   Use
                                                                                                                        Impact (CO2)

flights (the costs of which                                                    more efficient
have fallen dramatically) or                                                     vehicles
                                                                                                 Use car                                                   Install insulation
to abandon their cars in favor                                                                    less for
of public transport (which is                                                                   short trips
                                                   Low proportion
among the most expensive in                        of population                                                                              Waste less food
the world) (Figure 17). More
                                                   0%                                                                                                               Increase
effective ways to reduce carbon                                                    Current behavior                                                                 recycling
emissions, such as avoiding                                                                                                            Better energy
                                                                                                                                       management
unnecessary flights, using more                                     Install
                                                               microgeneration                                                                                                         100%
efficient vehicles and using the
                                                                                                                                                                                High proportion
car less for short trips, were less                                                                                                                                               of population
                                                                        Adopt lower
widely adopted.                                                         impact diet                                                       More              Buy energy
                                                                                                                                       responsible           efficient
                                                                                                                                       water usage           products

Figure 17: Consumers favor cost-efficient or           Low impact and                                 Eat more food
convenient behavior changes over others                                                               that is locally
that would save more carbon, but require               uncommon behavior                                 in season
a sacrifice.                                                                                                                            0 kg/household
Source: DEFRA,UK, A Framework for Pro-
Environmental Behaviours, 2007.
                                                                                                                                        Low CO2 impact

                                                                17
The role of the consumer

                                                                                                                                                   Who is the “green/ethical/
                          There is currently no globally recognized or agreed                                                                      sustainable” consumer?
                          definition of a sustainable consumer/lifestyle.                                                                          Some market research companies
                                                                                                                                                   are starting to apply new taxonomy
                                                                                                                                                   to consumers to understand who is
                                                                              Rational                                       Emotional
                           Campaigners (18%)                                  demonstration                                  involvement           the green / ethical and sustainable
                           Deeply committed but require
                                                                              Fact based                                     Warmer
                           supporting evidence to trust
                                                                              Deep messages             Optimists (21%)      messaging, less       consumer.
                                                                              (Campaigners)             Committed and        explanation
                           Engaged /Responsible / Worried
                                                                              Clear, simple, easy       want to feel good    Tangible products     The segmentation model shown
                                                                              to understand                                  and services that
                                                                              (Confused)                Interested /         help tackle climate   here is one example of consumer
                                                                              Communicate               Fashionable /        change
                                                                                                                                                   segmentation tools starting to
Increasing engagement

                                                                              benefit to tackling        Confident             Foster the feeling
                                                                              climate change                                 they are              emerge.
                           Confused (25%)                                     Communicate at                                 contributing
                           Undecided and need clarity                         a corporate as                                 (optimists)
                           of why and how                                     well as product                                Products that are     Figure 18: Segmentation of US and UK consumers
                                                                                                        Followers(8%)
                                                                              and service level                              visible to others     according to their attitudes and behaviors
                                                                                                        Partially            (followers)
                           Detached / Uninformed / Open
                                                                                                        committed,
                                                                                                                                                   related to climate change, and most appropriate
                                                                                                        want to look good                          communications approaches. The UK Climate
                                                                                                        Unsure / Image-conscious                   Group, in Association with Sky and Lippincott,
                                                                                                                                                   compared US and UK consumers according to six
                           Unwilling (10%)
                                                                                                                                                   segments, and proposed optimum approaches
                           Accept climate change as an issue but not prepared to act           Respectful facilitation
                           Unconcerned / Inflexible                                                                                                 to engage them in sustainability. In both
                                                                                               Make it easy – demonstrate no extra effort and
                                                                                               no extra cost to them                               countries, only 28% of consumers were not open
                           Rejecters (18%)                                                     Respect their point of view: show they are not      to sustainable solutions. Figures for the UK were
                           Actively reject both the issue and taking action                    taken for granted, and that no compromise of        broadly similar to those for the US, although a
                           Uninterested / Individualistic / Confident                           price or quality has been made on their part        greater proportion of UK residents were categorized
                                                                                                                                                   as “campaigners” (27%), and fewer were
                                                                                                                                                   “confused” (19%).
                                Seeking functional benefits                                                     Seeking emotional benefits           Source: UK Climate Group/Sky & Lippincott, 2007.

Barriers to behavior change                                                         cross-section of sustainability experts                        of understanding; selfishness; and
                                                                                    (working in both private and public                            associated costs and taxes. The fourth
What is the reason for the difference
                                                                                    sectors, as well as the media) to be                           factor, “tragedy of the commons”,
between what people say they are
                                                                                    the most important obstacles to                                refers to the tendency of consumers
willing to do, and the decisions that
                                                                                    increased willingness to pay for the                           to be more willing to act if they see
they make in real life? Figure 19
                                                                                    full costs of the ecosystem services                           their peers acting as well; it reflects an
shows, in order of importance, those
                                                                                    that society uses. The three most                              “I will if you will” mentality.32
factors that are believed by a broad
                                                                                    significant factors were felt to be: lack                      Consumer organizations point out
                                                                                                                                                   that it is not generally enough for cost
                               Lack of understanding of problem / threat / value                                                           30      savings to be available over the total
                                                     Comfortable lifestyles / greed                                     15                         lifetime of a product; high “up-front”
                                                                                                                                                   costs can act as a deterrent.
                                  Associated high costs / perceived higher taxes                                 12

                                  Selfish entitlement / tragedy of the commons                                   11                                 Finally, there is some evidence that
                                  History / current / past prices / culture of “free”                    6                                         consumers are prone to the “rebound
                                                                                                                                                   effect” – a tendency to use products
                        Personal budget constraints / limited financial resources                         6
                                                                                                                                                   more in response to efficiency
                                      Short term thinking / rewards not obvious                          6
                                                                                                                                                   improvements, thereby reducing the
                                                               Apathy / indifference                    5
                                                                                                                                                   expected benefits of those efficiency
                                                                                 Poverty                5                                          improvements.33 For example,
                                                  Lack of political will / leadership               4                                              consumers in the US reportedly
                           Social inequity / rich vs poor / unequal spread of cost                  3                                              increase their use of air conditioning
                                              Being voluntary vs being regulated                    3
                                                                                                                                                   by up to 50% when they switch to a
                                                                                                                                                   “green” energy supply. Home heating
                                                                                                                                                   and personal transportation also tend
Figure 19: Why consumers are sometimes unwilling to pay more for environmental performance.
Source: National Geographic Society/GlobeScan, Greendex 2008: Consumer Choice and the Environment – A Worldwide                                    to have significant rebound effects.
Tracking Survey, 2008.

                                                                                                                                            18
Lack of understanding/confusion – on-pack claims
and labels
The products available in today’s supermarkets carry a wide
range of labels, on-pack claims and elements of design that
are meant to inform and reassure consumers on health,
safety, environmental or social concerns. Several brands,
including grocery retailers, have developed their own
labels; other brands use endorsements from non-certifying
(but trusted) third parties, or on-pack claims (such as
“natural”) to convey sustainability attributes (Figure 20).

Some products are certified by an internationally
recognized and respected body, such as a local, national or
regional authority. Examples of third-party labels include:
“organic” (e.g., USDA, Rainforest Alliance, Soil Association);
“healthy” (e.g., National Heart Foundation Approved, Low
Glycemic Index/gluten free); “sourced from sustainable
sources” (e.g., Forest Stewardship Council, Sustainable
Forestry Initiative, Marine Stewardship Council); “dolphin
friendly” (e.g., Greenseas); “ethically sourced” (e.g.,
Fairtrade); “eco-friendly” (e.g., EU “Flower”), “sustainable
                                                                                      
cleaning” (e.g., A.I.S.E “Washright” campaign). Along
with these labels, producers are also obliged to provide
nutritional values and a full list of ingredients.

Consumers International and the UK’s National Consumer
Council report that many consumers remain confused
about which products are better for society and the
environment. Nevertheless, labels can play an important
role in fostering sustainable consumption when used as
                                                                 Figure 20: A selection of third-party labels on consumer products.
part of a package of measures.                                   Source: WWF, 2006.

“Eco-promising”                                                    AISE campaign for sustainable washing
Business for Social Responsibility and Forum for the               The International Association for Soaps, Detergents and
Future34 identify several barriers to the effective use            Maintenance Products’ “Washright” campaign brings
of labels, on-pack claims and other means to inform                together members of the European detergent industry
consumers about the environmental credentials of                   (producers and retailers) in an attempt to reduce the
products and services:                                             burden on the environment and guard the health,
                                                                   safety and well-being of consumers, customers and
• Confusion among consumers about the differences
                                                                   employees. It is committed to high ethical standards
  between fairtrade, ethical, organic and other types of
                                                                   (beyond legal requirements) and to contributing to
  products
                                                                   economic development. Its work – which includes
• Unrealistic expectations of consumers, who are not               an ongoing dialogue with key stakeholders, and
  usually willing to spend time understanding these issues         information campaigns for consumers – is guided by
  and are rarely prepared to pay more for sustainable              an eleven-point sustainability charter, uses life cycle
  products                                                         assessment to analyze impacts, and is the subject of an
• The complexity of supply chains and the costs of                 annual, externally verified sustainability report.
  effective monitoring and reporting

• Suspicion of “greenwash” (environmental claims that
  could be considered false, unsubstantiated and/or
  unethical)

                                               19
You can also read