SWISS SUSTAINABLE INVESTMENT MARKET STUDY 2019
←
→
Page content transcription
If your browser does not render page correctly, please read the page content below
Department of Banking and Finance
                               Center for Sustainable Finance and Private Wealth

SWISS SUSTAINABLE INVESTMENT
MARKET STUDY 2019

MAIN SPONSORS
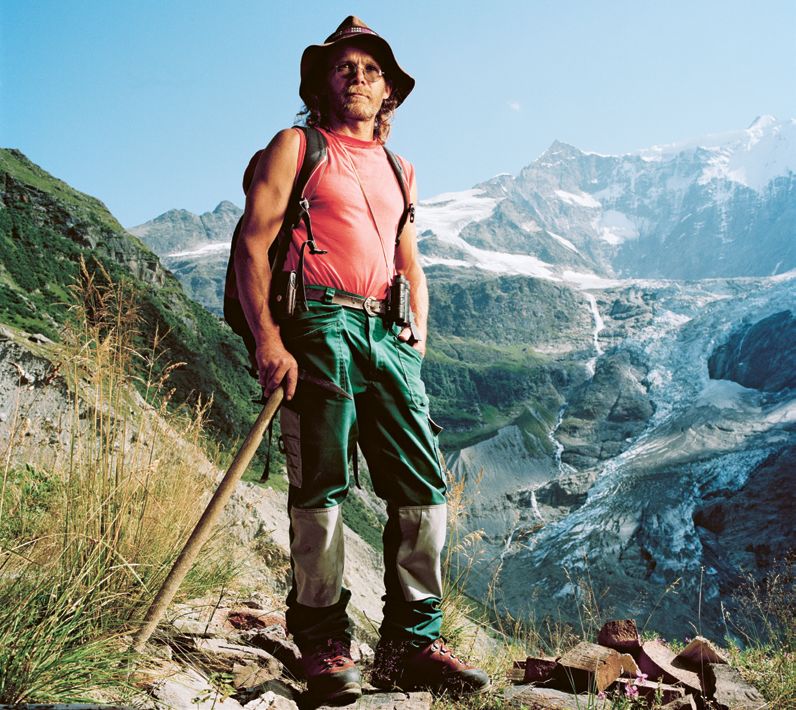
Cover : SWITZERLAND
CHRISTIAN KAUFMANN (48)
SHEPHERD
GRINDELWALD, SWITZERLAND

The alpine lodge that my grandfather built near a glacier collapsed down the slope three
years ago because so much of the ice melted. The glacier has lost at least eighty percent
of its volume in the last twenty-five years. That is drastic. When my grandfather opened
the lodge in the 1940s, the glacier was on almost the same level. But as it started to
retreat, the moraine became unstable and started to collapse, one piece after another.
It was frightening. At one point, you could see the cleft at the edge of the house, then
everything tumbled down. You can see where the ice was. That should get us thinking
that there is something wrong.

SWI S S S US TAINABLE F INANCE                                                              Swiss Sustainable Investment Market Study 2019   B
CONTENT                                                  Preface by Swiss Sustainable Finance                        2
                                                         Preface by the University of Zurich                         3
                                                         Welcome from the President of the Swiss Confederation       5
                                                         Executive Summary                                           8

                                                 1       INTRODUCTION                                               14

                                                 2       SWISS SUSTAINABLE INVESTMENT MARKET                        18
                                                 2.1     Overall Market Size and Characteristics                    18
                                                 2.2     Investor Types                                             22
                                                 2.3     Sustainable Investment Approaches                          24
                                                 2.4     Asset Allocation                                           31
                                                 2.5     Special Topics                                             34

                                                 3       BROAD SUSTAINABLE INVESTMENT POLICIES                      37

                                                 4       EXPECTED MARKET TRENDS                                     42
                                                 4.1     Market Trends – Asset Managers                             42
                                                 4.2     Market Trends – Asset Owners                               44

                                                 5       REGULATORY FRAMEWORK                                       48

                                                 6       INTERVIEWS WITH FINANCE ASSOCIATIONS
                                                 6.1     Interview with ASIP : Long-term prospects determine
                                                         pension funds’ investment strategies                       52
                                                 6.2     Interview with SIA : Climate risks – a twofold challenge
                                                         for insurance companies                                    54

                                                     7   CONCLUSION AND OUTLOOK                                     56

                                                         APPENDIX                                                   60
                                                         Sponsor Contributions                                      60
                                                         Glossary                                                   66
                                                         List of Figures                                            70
                                                         List of Abbreviations                                      71
                                                         Study Participants                                         72
                                                         Overview Table : Swiss Sustainable Investment Market       73
                                                         List of Sponsors                                           74
                                                         Imprint                                                    76

Swiss Sustainable Investment Market Study 2019           S W I S S S U S TA I N A B LE F I N A N C E                 1
PREFACE BY SWISS SUSTAINABLE FINANCE

ZURICH, JUNE 2019

This is the second time that Swiss Sustainable Finance (SSF) has pro-     The chapter on regulatory developments has grown considerably
duced the Swiss Sustainable Investment Market Study with the support      since last year’s report. The EU Action Plan on Financing Sustainable
of the Center for Sustainable Finance and Private Wealth at the Uni-      Growth is one reason for this, but certainly not the only one. A
versity of Zurich. Who would have thought that last year’s impressive     wide array of self-regulatory initiatives also play an important role
growth would persist? The 83% increase in sustainably managed assets      in aligning definitions and creating frameworks that help investors
in Switzerland definitely lies well beyond what we expected for 2018.     establish state-of-the-art processes.
      The present report provides in-depth insights into both the               This market study was compiled with the help of an SSF work-
structure and quality of this impressive market development. Even         group, which allowed the methodology to be closely aligned to the
without digging into the details, one trend is obvious : it is becoming   market. The data analysis was carried out jointly by the Center for
ever more normal to integrate sustainability factors into investment      Sustainable Finance and Private Wealth, which ensured systematic
decisions for large shares of assets – a trend described as a “virtuous   assessment of the data based on scientific principles. The study was
circle ” by Mark Carney, Governor of the Bank of England. Going for-      funded by the six main sponsors Credit Suisse, Raiffeisen, Robe-
ward, it will be crucial not just to focus on quantitative growth, but    coSAM, Swisscanto Invest, UBS and Vontobel, as well as the five sup-
also on the quality of such sustainable investment solutions and the      porting sponsors Candriam, Ecofact, Inrate, LGT, and Pictet Group.
impact they have on the real world.                                       We would like to take this opportunity to thank all the involved par-
      With a total of 77 respondents answering our questionnaire, we      ties for their valuable support.
have again managed to expand the coverage of our survey. As many                In his Welcome to this study, the President of the Swiss Confed-
of the large asset managers and asset owners are amongst the re-          eration Ueli Maurer stresses the importance of a continuing dialogue
spondents, we are confident the study gives a fair overview of the        between market players and authorities. SSF is part of this ongoing
Swiss sustainable investment market as it presents itself today. In       discussion and will keep bringing in the perspective of the different
two interviews, the managing directors of important asset owner           market players. With this we aim to help build the right frameworks
organisations provide their view on the role of sustainability for the    that allow Switzerland to remain a leading centre in sustainable fi-
investment processes of their members. Climate change is one of the       nance and to contribute its fair share to combatting climate change.
key issues they wish to tackle, be it with the intention of reducing
investment risks or contributing to a low-carbon world. The latter is
of utmost urgency, as impressively illustrated by the pictures we
chose for this report. The Swiss photographers Mathias Braschler
and Monika Fischer traveled to sixteen countries around the
world, taking photographs of and conducting interviews with people        Jean-Daniel Gerber                           Sabine Döbeli
whose existence is threatened by the consequences of climate change.      President SSF                                CEO SSF

SWI S S S US TAINABLE F INANCE                                            Swiss Sustainable Investment Market Study 2019                      2
PREFACE BY THE UNIVERSITY OF ZURICH

The results of this important report show that the practice of inte-    In our teaching programmes, we are experiencing strong demand
grating social and environmental sustainability aspects into invest-    from development finance agencies keen to learn about Blended Fi-
ment processes is no longer a niche activity, but has moved into the    nance and Impact Investing, as well as interest from high net worth
mainstream. This is part of the ongoing surge in momentum experi-       individuals and family offices from around the globe who are looking
enced in sustainability as a whole over the last year – both in Swit-   to actively develop their competencies to invest their assets in a
zerland and worldwide.                                                  sustainable manner. On top of that, investment professionals and
     At the Center for Sustainable Finance and Private Wealth (CSP)     private bankers are actively building up their capabilities to serve
at the University of Zurich, we are observing this important develop-   these clients.
ment from various angles :                                                     Our analysis of the sustainable investing capabilities of private
                                                                        banks reveals their greater awareness of the growing client demand
                                                                        and the ongoing drive to develop innovative investment solutions to
                                                                        fill the corresponding gaps in their product range and client servic-
                                                                        ing capacities.
                                                                               In academic research, the focus is moving from merely whether
                                                                        it “ pays to be green ” to focus on exactly how sustainability aspects
                                                                        can help investors make better investment decisions, how these de-
                                                                        cision-making processes operate, the role played by behavioural fi-
                                                                        nance, and – perhaps most importantly – the actual impact investors
                                                                        have on the real world.
                                                                               We are excited about the dynamic momentum, the exciting re-
                                                                        search and discoveries ahead of us, and the impact we hope to make
                                                                        as we forge ahead. This report, jointly prepared with Swiss Sustaina-
                                                                        ble Finance, is an essential part of this, and we very much hope that
                                                                        the insights it provides are as valuable to you as they are to us.

                                                                        Dr Falko Paetzold                             Prof. Dr Timo Busch
                                                                        Initiator and Managing Director               Senior Fellow

Preface                                                                 S W I S S S U S TA I N A B LE F I N A N C E                           3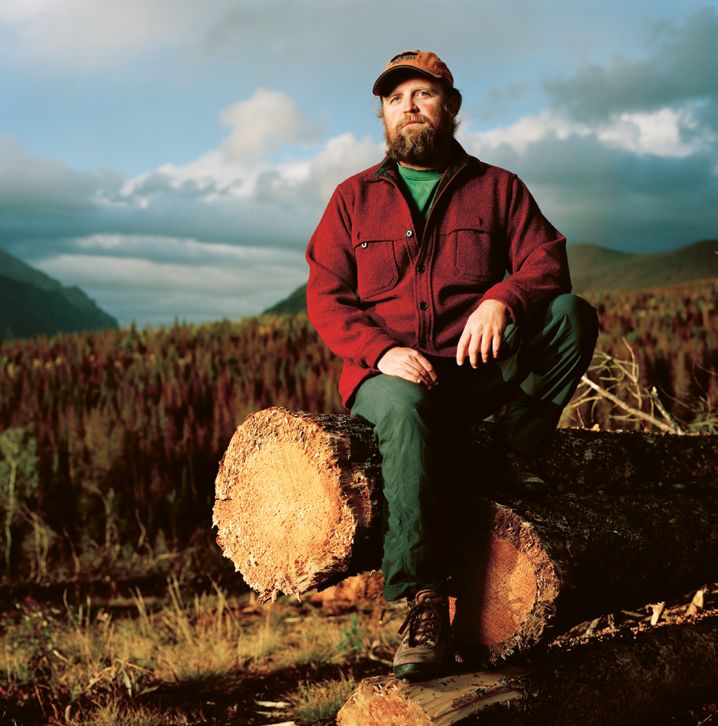
Given the global
challenges ahead,
the sector has
good reason to
continue along
this path.

SWI S S S US TAINABLE F INANCE   Swiss Sustainable Investment Market Study 2019   4
WELCOME FROM THE PRESIDENT
OF THE SWISS CONFEDERATION

Switzerland continues to show incredible potential as a centre of         vestment abroad. That is why we contribute to the activities of inter-
excellence in sustainable investment. This is showcased in the cur-       national bodies. Switzerland is also involved at intergovernmental
rent SSF Market Study, which deserves broad attention and shows           level, for example through a Memorandum of Understanding (MoU)
that our financial services industry is heading in the right direction.   with China, focusing on finance and the economy as part of the Belt
Given the global challenges ahead, the sector has good reason to          and Road Initiative. The central principles of this MoU signed in April
continue along this path and to follow the goal of making sustainable     2019 are sustainability, social and environmental responsibility, and
investment the norm.                                                      transparency in project finance and investment. This MoU is also
      There has been a continuous increase in the political and social    aligned to the UN’s sustainable development goals (SDGs).
pressure, as well as the willingness of investors, to take environmen-          The federal authorities will continue their intensive dialogue
tal, social and governance (ESG) issues into account. From the many       with the financial services industry. It is in our national interest to
discussions I have had with financial market players, I know they are     maintain a high level of international commitment as well.
aware of their important role and act accordingly. Sustainability pre-
sents a great opportunity – both in its own right and in combination
with digitalisation – to ensure that Switzerland continues to be a
highly competitive financial centre in the future.
      At the beginning of 2016, the Federal Council addressed the
issue of sustainability in the financial markets and adopted princi-
ples for a consistent Swiss policy. This policy is based on mar-
ket-economy measures, transparency and consideration of the long-
term effects of current decisions. The right framework conditions
favour sustainable economic development. This is why we are main-
taining such a close dialogue with the financial industry, as it knows
best where the opportunities are to be found, but also where the
obstacles lie.
      Businesses not only need favourable framework conditions in         Ueli Maurer
Switzerland, but should also have opportunities for sustainable in-       President of the Swiss Confederation

Welcome from the President of the Swiss Confederation                     S W I S S S U S TA I N A B LE F I N A N C E                          5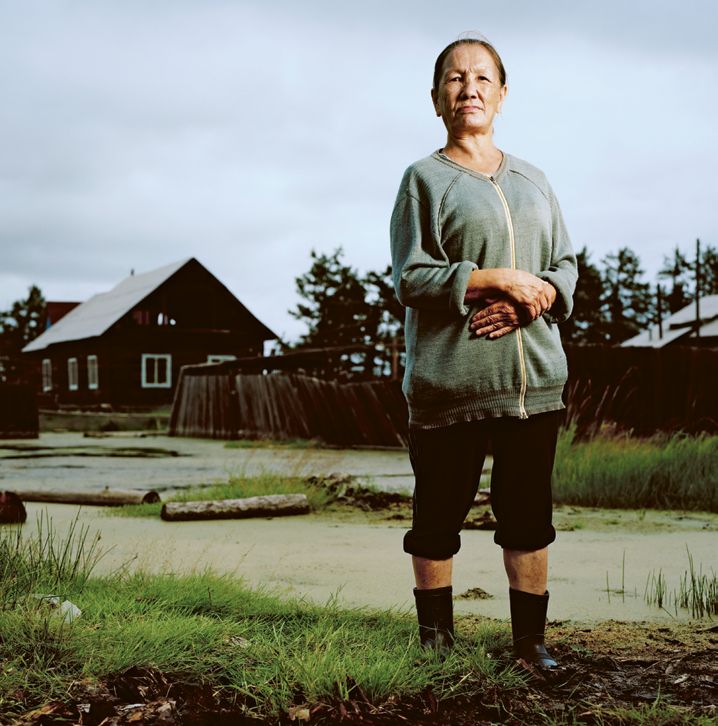
THE HUMAN FACE OF CLIMATE CHANGE
PHOTOS AND TEXT MATHIAS BRASCHLER AND MONIKA FISCHER

SWI S S S US TAINABLE F INANCE                         Swiss Sustainable Investment Market Study 2019   6
Compelling portraits of victims of climate change
The images we chose for this edition of the Swiss Sustainable Invest-
ment Market Study intentionally look beyond Switzerland. They tell
us stories of the striking effects of climate change from all regions
of the world. In 2009, the Swiss photographers, Mathias Braschler
and Monika Fischer travelled to 16 countries to photograph and in-
terview people whose existence is threatened by the consequences
of climate change. This project, “ The Human Face of Climate Change ”,
impressively illustrates the urgent need to adopt sustainable solu-
tions in every part of our lives, including our investment activities.
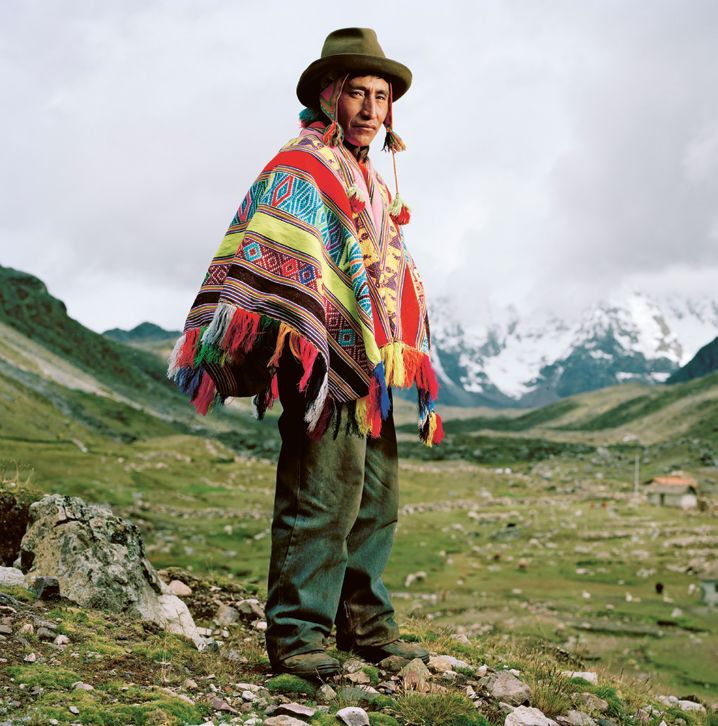
PERU
MARIANO GONZALO CONDORI (48)
FARMER
PUCARUMI, PERU
We are losing our glaciers. They are turning into water, and we have fewer snowfalls.
If this continues, surely the water will run out and then how are people going to live ?
This will surely bring a famine, animals will die, and there will not be much agriculture.
Potatoes used to grow only at an altitude of 3,200 meters, but now we can cultivate
them at 4,200 meters. Perhaps even higher later. When I was young, the soil was very
fertile, but now it has become poor. When it used to snow, everything was very white,
and Ausangate (Peru’s second highest mountain) looked beautiful. Now the snowfalls
are disappearing and it has become ugly. Scientists tell us there will only be water for
twenty-five years. We do not know what to do. We are very concerned.
The Human Face of Climate Change S W I S S S U S TA I N A B LE F I N A N C E 7EXECUTIVE SUMMARY
DEVELOPMENT OF SUSTAINABLE INVESTMENTS
IN SWITZERLAND (IN CHF BILLION)
Volume (CHF billion)
800
716.6
83 %
700
600
455.0 500
390.6
91 % 400
300
215.0 238.2
22 % 70.8
200
56.1 71.1 141.7
40.6 41.2 47.6 104.5
20.3 32.4 36.2
22.1 27.5 55.2 57.9
16.1 18.7 34.9 100
8.1 13.6
25.5 28.6 46.3 102 % 190.9
18.8 24.5 22.5 46.2
12.2 64.2 94.4
40.3
0
2008 2009 2010 2011 2012 2013 2014 2015 2016 2017 2018
Funds Mandates Asset Owners Source: OnValues, FNG and SSF
High double-digit growth of sustainable investments continues approaches, particularly ESG integration, by large asset managers
The market for Sustainable Investments (SI) in Switzerland in 2018 across a broad share of their products.
once again experienced record-high, double-digit growth. Based on On the level of funds, the doubling of volumes of sustainable
the responses to a market survey performed by Swiss Sustainable funds to CHF 190.9 billion brought this segment to 18.3 % of the
Finance (SSF), the total volume increased by 83 % to reach CHF 716.6 overall Swiss fund market.
billion. This figure covers all reported sustainable investment funds Substantial growth has also been seen in the asset owner seg-
(102 % increase), sustainable mandates (22 % increase) and sustaina- ment. The amount of sustainable investments reported by asset own-
ble assets of asset owners (91 % increase). The SI market growth ers (CHF 455.01 billion) accounts for two thirds of Switzerland’s total
can be ascribed to higher market coverage in this study (77 respond- SI market, and corresponds to approximately 31 % of the total assets
ents vs. 66 in the previous year), as well as a wider adoption of SI managed by Swiss pension funds and insurance companies.
SWI S S S US TAINABLE F INANCE Swiss Sustainable Investment Market Study 2019 8TOP 10 SWISS MARKET PLAYERS FOR SUSTAINABLE
INVESTMENTS BY ASSETS UNDER MANAGEMENT IN SWITZERLAND
(IN % AND CHF BILLION) (n=39)
Market Share in % Volume (CHF billion)
35 % 90
31.5 %
80
30 %
70
25 %
60
20.2 %
20 % 50
15 % 40
30
10 % 8.7 % 8.5 %
6.2 % 20
5% 4.2 % 4.2 %
10
2.0 % 1.8 %
1.1 %
0% 0
Partners UBS Group AG Vontobel* Credit Suisse AG Bank J. Safra Pictet Group** Zürcher RobecoSAM AG LGT Capital BlueOrchard
Group Sarasin Kantonalbank / Partners AG Finance Ltd
Swisscanto
Invest by Zürcher
Kantonalbank
* this includes assets from Raiffeisen Schweiz and Ethos Services SA
** combined AuM of Pictet Asset Management and Pictet Wealth Management (includes assets managed for Ethos Services SA)
Top 10 players by volume DEVELOPMENT OF INSTITUTIONAL AND PRIVATE
The top 10 market players manage around CHF 213.7 billion in sus- SUSTAINABLE INVESTMENTS (IN CHF BILLION) (n=61)
tainable funds and mandates, accounting for about 89 % of the total
SI market of asset managers covered by the SSF survey. Volume (CHF billion)
800
Both private and institutional investors drive growth
In terms of client types, both private and institutional investors in-
700
creased their SI volumes on an absolute basis. The 2019 report again
highlights the dominance of institutional investors in the SI field,
600
who now make up 88 % of all sustainable investments in Switzerland,
a modest increase of two percentage points compared to the previ-
ous year. 500
88 %
630.2 400
300
87 %
86 %
336.3
200
100
59 %
14 % 54.2 86.4 12 %
0
2017 2018
Private Institutional
Executive Summary S W I S S S U S TA I N A B LE F I N A N C E 9DEVELOPMENT OF SI APPROACHES
(IN CHF BILLION) (n=70)
490.4
ESG Integration
188.9
+160 %
379.0
Exclusions
142.6
+166 %
315.7
Norms-based Screening
217.8
+45 %
286.7
ESG Engagement
157.8
+82 %
159.5
ESG Voting
117.8
+35 %
89.6
Best-in-Class
65.1
+38 %
Sustainable Thematic 39.2
Investments 36.9
+6 %
16.3
Impact Investing
12.1
+35 %
0 100 200 300 400 500 600
2018 2017 Volume (CHF billion)
ESG integration approach gains lead position ASSET CLASS DISTRIBUTION
All of the SI approaches grew in volume. ESG integration is now in FOR SUSTAINABLE INVESTMENTS (IN %) (n=54)
the lead, with a total volume of CHF 490.4 billion, followed by exclu-
sions, with a volume of CHF 379 billion. Both approaches experi-
24.2 % Real Estate/Property
enced their highest growth rates of 160 % and 166 %, respectively.
21.3 % Equity
The norms-based screening approach accounted for CHF 315.7 billion.
19.9 % Corporate Bonds
In addition, the engagement approach had a striking increase of 14.4 % Sovereign Bonds
about 82 % compared to the previous year. The best-in-class and 8.0 % Private Equity
voting approaches, as well as sustainable thematic investments, also 4.3 % Private Debt
grew, but remained at modest levels, followed by impact investing 2.9 % Infrastructure
with the lowest volume. 0.9 % Monetary/Deposit
0.8 % Supranational Bonds
0.1 % Hedge Funds
Shifting importance of asset classes
0.03 % Commodities
The asset allocation distribution of sustainable investments has ex- 3.2 % Other
perienced some shifts between 2017 and 2018. With a share of 24.2 %,
real estate/property is the most popular category for SI in Switzer-
land now. The second largest asset class is equity with 21.3 %, fol-
lowed by corporate bonds with 19.9 %. Sovereign bonds are in fourth
place with 14.4 %. These shifts are definitely driven by the greater
interest shown by institutional investors and therefore their asset
allocation, which is more focused towards real estate and bonds.
SWI S S S US TAINABLE F INANCE Swiss Sustainable Investment Market Study 2019 10KEY DRIVERS FOR SI DEMAND IN THE NEXT 3 YEARS FOR ASSET MANAGERS
(IN AVERAGE LEVEL OF IMPORTANCE) (n=34)
Demand from institutional investors 4.3
Legislative 3.5
Demand from private investors 3.4
Materiality 3.2
Notion of fiduciary duty 3.1
International initiatives 3.1
External pressure 2.6
1 2 3 4 5
Not important Very important
KEY DRIVERS FOR FURTHER ADOPTION OF SI FOR ASSET OWNERS
(IN AVERAGE LEVEL OF IMPORTANCE) (n=33)
Pressure from the Board 3.8
Demand from beneficiaries 3.4
Political pressure 3.1
International initiatives 2.9
External pressure 2.7
1 2 3 4 5
Not important Very important
Swiss market optimistic about growth of sustainable investments Swiss financial centre lays the groundwork to move forward in
Going forward, Swiss asset managers and asset owners remain opti- sustainable investing
mistic about future growth of the SI market. Bottom-up drivers (i.e. Increasing international voluntary initiatives, the legislative develop-
investors’ demands), as well as top-down pressure (i.e. board-level ments at EU level as well as the strong market growth noted in this
pressure and legislation), have been identified as the most relevant report are all facets of one clear trend : we see strong dynamics in
drivers for this development. At the same time, performance con- the sustainable investment market in many parts of the world. As also
cerns remain a key barrier for asset owners, whereas these concerns outlined in this report, Swiss players ranging from federal entities
have lost in importance for asset managers. (SIF, FINMA, SNB), industry associations (ASIP, SBA, SFAMA, SIA) all
the way to the market players reflected in the survey, are taking
steps to improve the understanding and implementation of sustain-
able finance. SSF considers the recent market developments very
encouraging and is convinced they will help position Switzerland as
a key player in this increasingly relevant field.
Executive Summary S W I S S S U S TA I N A B LE F I N A N C E 11RUSSIA KOSHUNEVA LUIZA ARKADIEVNA (54) IN FRONT OF HER HOME PARTIALLY FLOODED BY MELTWATER SIBERIAN PENSIONER NAMZI VILLAGE, SAKHA REPUBLIC, RUSSIA For the last three years the winters have been warmer so the permafrost has melted and the lake has expanded so much that it has reached our home. Now many of our buildings are submerged. The cowshed, the outside shower, and our underground cool room are all flooded. The weather has changed a lot. When we were children, the temperature in winter fell as low as minus sixty-three degrees Celsius, but now it is much warmer. Other people in the village have similar problems. My aunt, who is now eighty-six, also has a home threatened by a lake. Many buildings in her area have been flooded. We will go to our local administration and ask for a new house in a higher area. SWI S S S US TAINABLE F INANCE Swiss Sustainable Investment Market Study 2019 12
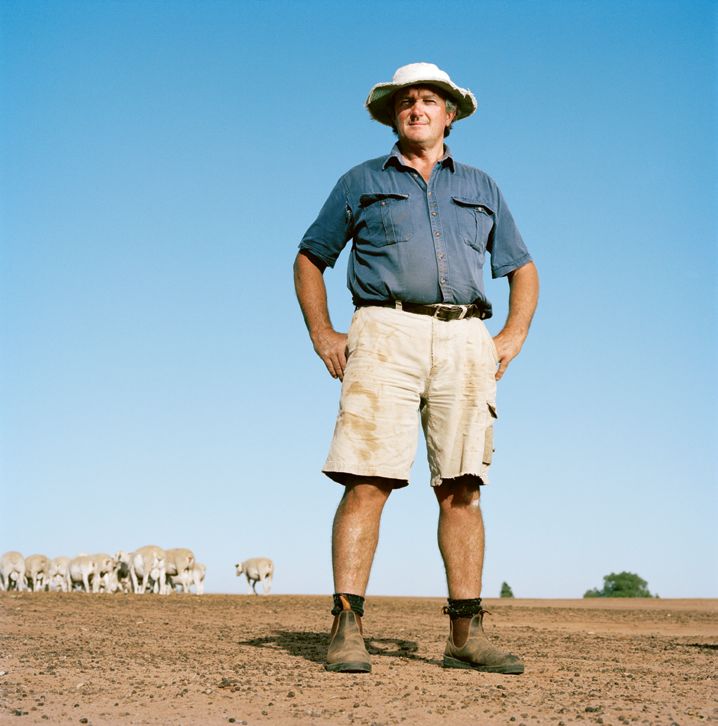
AUSTRALIA
KEN BUTCHER (57)
SHEEP FARMER
BOOROORBAN, NEW SOUTH WALES, AUSTRALIA

We’re in a situation now where I have virtually no feed. We are virtually out of water as
well, so I have to reduce stock. There is no choice. We have just about exhausted most
of our excess, which means going into debt. If it stays dry, there is no way of paying it
back. There comes a time when you have to walk away.
We seem to be running through longer periods of drier-than-normal conditions. I’ve
got to look at photographs to remind myself of what a normal year can be like. It is
depressing to see everything so dry and to see trees that you planted die. Some of my
neighbors take the worst option out and commit suicide to get away. I try to maintain
a positive outlook that hopefully things will get better.
—
After a severe, thirteen-year drought in southeast Australia, farmers are struggling to
make ends meet. Ken Butcher has tried to adapt by switching from Merino to Dorper
sheep, which are well adapted to a desert climate. But he has still been forced to re-
duce his stock from two thousand to six hundred sheep. On the day this portrait was
taken, he had just put an ad in the local newspaper to sell another four hundred.

The Human Face of Climate Change                                                            S W I S S S U S TA I N A B LE F I N A N C E   13
1 INTRODUCTION

Figure 1
DEFINITIONS OF SUSTAINABLE INVESTMENT (SI) APPROACHES

Best-in-Class                      Approach in which a company’s or issuer’s ESG performance is compared with that of its peers based on a
                                   sustainability rating. All companies or issuers with a rating above a defined threshold are considered as
                                   investable.

ESG Engagement                     Activity performed by shareholders with the goal of convincing management to take account of ESG criteria
                                   so as to improve ESG performance and reduce risks.

ESG Integration                    The explicit inclusion by investors of ESG risks and opportunities into traditional financial analysis and investment
                                   decisions based on a systematic process and appropriate research sources.

ESG Voting                         This refers to investors addressing concerns of ESG issues by actively exercising their voting rights based on
                                   ESG principles or an ESG policy.

Exclusions                         An approach excluding companies, countries or other issuers based on activities considered not investable.
                                   Exclusion criteria (based on norms and values) can refer to product categories (e.g. weapons, tobacco), activities
                                   (e.g. animal testing), or business practices (e.g. severe violation of human rights, corruption).

Impact Investing                   Investments intended to generate a measurable, beneficial social and environmental impact alongside a financial
                                   return. Impact investments can be made in both emerging and developed markets and target a range of returns
                                   from below-market to above-market rates, depending upon the circumstances.

Norms-based Screening              Screening of investments against minimum standards of business practice based on national or international
                                   standards and norms.

Sustainable Thematic Investments   Investment in businesses contributing to sustainable solutions, both in environmental or social topics.

Over the last year, sustainable finance has once again made headlines         These movements are helping to shape the sustainable investment
internationally. With increasing pressure from international organi-          market in Switzerland as well. We already have seen the Swiss market
sations such as the IPCC emphasising the urgency to meet climate              recognised globally as having leading capacities in green finance,
goals and the UN promoting more financing for the UN Sustainable              with both Zurich and Geneva jumping in the ranking of the Global
Development Goals (SDGs), the financial services industry must ad-            Green Finance Index.5 Additionally, through dialogue with our mem-
dress how it can be part of the solution.                                     bers, we see that Swiss players are also looking more actively into
      Financial actors can no longer ignore sustainability issues, with       ways to step up their efforts in sustainable investing.
climate change claiming its first S&P 500 bankruptcy in 2018.1 The                  Swiss Sustainable Finance (SSF) provides insights into such market
industry already sees positive signals, with the majority of assessed         developments in Switzerland by publishing the official Swiss Sustaina-
companies now disclosing information in their reporting in line with          ble Investment Market Study. The aim of this study is to summarise the
one or more of the TCFD recommendations.2 Additionally, various               status quo and provide a deeper understanding of the topic in order
initiatives aiming to create more sustainable financial markets that          to catalyse further growth of the Swiss sustainable investment market.
are able to withstand future challenges and benefit from arising op-                For the purposes of this study, sustainable investments (SI) are
portunities have taken big leaps forward in the last year. On the EU          considered synonymous with responsible investments and refer to
level, with the Action Plan on Financing Sustainable Growth, the first        any investment approach integrating environmental, social and gov-
package of four measures was adopted 3 and financial centres from             ernance (ESG) factors into the selection and management of invest-
all over the world are committing to working together to help spread          ments. As shown in Figure 1, there are eight different forms of SI,
sustainable finance practices.4 Within Switzerland, both the city of          which are all examined in more detail by SSF (for full definitions, see
Zurich and the city of Geneva are active members of the Financial             the glossary at the end of this report, or the SSF website).6 The gen-
Centres for Sustainability (FC4S), helping to drive forward the agen-         eral definition, as well as definitions applying to the different ap-
da for sustainable finance.                                                   proaches, are aligned with internationally applied definitions.7

SWI S S S US TAINABLE F INANCE                                                Swiss Sustainable Investment Market Study 2019                          14
Figure 2
CATEGORISATION OF SUSTAINABLE INVESTMENT APPROACHES
TRADITIONAL INVESTING SUSTAINABLE INVESTMENT APPROACHES PHILANTHROPY
Investment approach
Pre-investment decision Post-investment decision Pre investment decision
Exclusions Norms- Best-in- ESG ESG ESG Sustaina- Impact
based Class Integra- Voting Engage- ble Investing
Screening tion ment Thematic
Invest-
ments
No systematic Sole focus on environ-
Sustainability focus
consideration of ESG Align investments with personal values or established norms and mitigate ESG risks mental/social impact
and impact
Pursue ESG opportunities
Actively pursue positive impact
Select investees solving
a social/environmental
problem
Demonstrate
measurable
impact
Sole focus on Baseline expectation of market-rate financial risk/return Below No financial risk/
Financial risk /
return expectation
financial risk/return market
return objective
rate
risk/
return
Source: SSF 8
Figure 2 presents a classification of these approaches. All approach-
es can be categorised according to their sustainability focus or in-
tended effect, and lie in between traditional investing on the one
hand and philanthropy on the other. The framework also highlights 1 The Wall Street Journal (2019) : “ PG&E : The First Climate-Change Bankruptcy,
that the SI approaches differ with respect to when they are applied Probably Not the Last ”, available at : https://www.wsj.com/articles/pg-e-wildfires-
and-the-first-climate-change-bankruptcy-11547820006, accessed 02/05/2019.
during the investment process – either during the pre-investment or
2 TCFD (2018) : “ Task Force on Climate-related Financial Disclosures : Status Report ”,
post-investment phases. The framework displays the natural pro- available at : https://www.fsb-tcfd.org/wp-content/uploads/2018/08/FINAL-2018-
gression of the various approaches to include more and more con- TCFD-Status-Report-092518.pdf, accessed 02/05/2019.
siderations as one looks at the approaches from left to right. While 3 See regulation chapter
exclusions, for example, are used purely to “ align investments with 4 International Network of Financial Centres for Sustainability : https://www.fc4s.org/
personal values or established norms and mitigate ESG risks ”, impact 5 Finance Watch and Long Finance (2019) : “ The Global Green Finance Index 3 ”, avail-
investing additionally is seen to “ pursue ESG opportunities ”, “ active- able at : https://www.longfinance.net/media/documents/GGFI_3_v1.6.pdf, accessed
ly pursue positive impact ”, “ actively select investees solving a social/ 02/05/2019.
environmental problem ” and “ demonstrate measurable impact ”. It is 6 http://www.sustainablefinance.ch/en/glossary-_content---1--3077.html
important to note that different approaches are often combined. For 7 E.g. Eurosif (2018) : “ European SRI Study 2018 ”, p. 12: “Sustainable and responsible
investment (“ SRI ”) is a long-term oriented investment approach which integrates
example, norms-based screening is usually applied in combination ESG factors in the research, analysis and selection process of securities within an
with ESG engagement and exclusion. In many cases, the investor en- investment portfolio. It combines fundamental analysis and engagement with an
gages with companies that violate the defined international norms evaluation of ESG factors in order to better capture long-term returns for investors,
and to benefit society by influencing the behaviour of companies. ” Available at :
and, if engagement is unsuccessful, excludes companies from the http://www.eurosif.org/wp-content/uploads/2018/11/European-SRI-2018-Study.pdf
portfolio in a second step. 8 Adapted from Paetzold, F., Impact Investing, in SSF Handbook on Sustainable
Investments, 2018.
Introduction S W I S S S U S TA I N A B LE F I N A N C E 15Figure 3
SWISS SUSTAINABLE INVESTMENT MARKET STUDY
PARTICIPANTS (N=77)
46 % Asset Owners
36 % Asset Managers
18 % Banks/Diversified financials
Sustainable investments can also have different forms of application : For the purposes of this report, the following assets are counted
a more product-specific focus, or a focus on a broader range of AuMs towards the total volume of sustainable investments :
at the institutional level : — For asset owners, all self-managed assets for which one or more
— Specific sustainable investment products (investment funds and sustainable investment approaches apply are considered under
discretionary mandates) usually have a written sustainability sustainable investment volumes.
investment policy as part of the prospectus or contract. Nor- — For asset managers, all funds and mandates applying one or
mally, such sustainable investment products apply multiple ap- more sustainable investment approaches are included in the
proaches (e.g. exclusion criteria in combination with a best-in- total volume of sustainable investments. Volumes linked to
class approach or an ESG integration approach combined with product-independent SI policies were also collected and are
ESG voting and engagement). referred to in chapter 3 Broad Sustainable Investment Policies.
— On the other hand, sustainability criteria and approaches can be
applied to the full asset base of a fund manager or institutional
asset owner by integrating them in the investment process. The
application of sustainability in these cases relies on a general
sustainability policy/approach at the institutional level instead
of a product-specific policy referred to in the product prospec-
tus. Usually, such broad sustainable investment policies apply
one of the following approaches or a combination thereof : ex-
clusions, norms-based screening, ESG integration, ESG voting,
ESG integration.
SWI S S S US TAINABLE F INANCE Swiss Sustainable Investment Market Study 2019 16Methodology
The Swiss Sustainable Investment Market Study 2019 was prepared on the basis of company
data taken from organisations domiciled in or with operations in Switzerland that manage
sustainable investments. All available data was collected, reviewed and evaluated by Swiss
Sustainable Finance (SSF) and its academic cooperation partner, the University of Zurich. The
gathered data is from 31 December 2018 and was provided voluntarily by the study partici-
pants. From January to April 2019, data collection was conducted using questionnaires sent
out to a total of 215 asset owners and managers in Switzerland.
In order to avoid double counting, SSF provided clear guidance on the data to be reported
and participants were encouraged to respect the defined scope of the questionnaire. In align-
ment with the methodology of the 2018 Eurosif market report, asset managers were asked to
list all assets managed by their organisation within Switzerland for national and foreign cli-
ents. Asset owners were asked to provide details of their self-managed assets and separately
provide information on assets managed by asset managers on behalf of their organisation.
Since not every question was answered by all participants, the total quantity (n) of the respec-
tive answers is provided for all figures. A list of the participants who agreed to be named can
be found on page 72.
Figures in foreign currency (euros and US dollars) were adjusted by means of exchange rates in
Swiss francs (CHF). The year-end exchange rates applied for 2018 were CHF 1.1297 for one EUR
and CHF 0.9840 for one USD. For one chart, the volumes for institutional and private investors
were extrapolated to total reported SI volumes, since a small percentage of SI volumes man-
aged by asset managers were not attributed to institutional or private clients explicitly.
All study participants received a guideline on the underlying definitions and detailed infor-
mation on how to answer the questionnaire. Erroneous information, such as typing errors,
cannot be completely excluded. In order to provide an accurate picture of the Swiss sus-
tainable finance market, all data and information were checked for consistency. In case of
any anomalies in the data, the respective participants were contacted and potential issues
resolved.
A total of 77 Swiss players (2018 : 66) took part in this year’s edition tains an examination of the regulatory framework in Switzerland. It
of the Sustainable Investment Market Study which reflects a 17 % is followed by two interviews from industry bodies in Switzerland
increase in number of participants compared to the previous year.9 As (chapter 6). The report concludes with a summary of the findings and
shown in Figure 3, 36 % were asset managers, 18 % banks/diversified an outlook (chapter 7).
financials and 46 % asset owners. This represents an even balance
between asset managers and banks/diversified financials (collectively
referred to as asset managers) on the one hand and asset owners on
the other hand. In 2019, the number of study participants increased
to 42 10 asset managers (2018 : 34) and 35 11 asset owners (2018 : 32).
The main part of this report (chapter 2) is a detailed analysis of
the results from the market survey. Factors examined in detail in-
clude general market characteristics, investor types, sustainable in-
vestment approaches and asset allocation. Also included are discus-
sions on special topics, such as the SDGs and climate change. The
next section (chapter 3) covers the topic of broad SI policies, in order
to gain insights into the integration of sustainability aspects into
9 A list of study participants who consented to be named is provided on page 72.
mainstream assets. The following section on market trends anticipat-
10 Two asset managers participated through another company. Thus, the following
ed by asset managers and asset owners provides a deeper under- analysis is based on 40 asset manager data sets.
standing of the possible drivers and barriers for further growth of 11 One asset owner participated through another company. Thus, the following
the Swiss sustainable investment market (chapter 4). Chapter 5 con- analysis is based on 34 asset owner data sets.
Introduction S W I S S S U S TA I N A B LE F I N A N C E 172 SWISS SUSTAINABLE INVESTMENT MARKET
Figure 4
DEVELOPMENT OF SUSTAINABLE INVESTMENTS
IN SWITZERLAND (IN CHF BILLION)
Volume (CHF billion)
800
716.6
83 %
700
600
455.0 500
390.6
91 % 400
300
215.0 238.2
22 % 70.8
200
56.1 71.1 141.7
40.6 41.2 47.6 104.5
20.3 32.4 36.2
22.1 27.5 55.2 57.9
16.1 18.7 34.9 100
8.1 13.6
25.5 28.6 46.3 102 % 190.9
18.8 24.5 22.5 46.2
12.2 64.2 94.4
40.3
0
2008 2009 2010 2011 2012 2013 2014 2015 2016 2017 2018
Funds Mandates Asset Owners Source: OnValues, FNG and SSF
2.1 OVERALL MARKET SIZE AND CHARACTERISTICS Figure 5
SUSTAINABLE INVESTMENTS OF EXISTING
As of 31 December 2018, the total Swiss sustainable investment mar- VS. NEW STUDY PARTICIPANTS (IN CHF BILLION)
ket was worth CHF 716.6 billion – taking into account sustainable
investment funds, sustainable mandates and sustainable assets of Volume (CHF billion)
asset owners. This represents growth of 83 % compared to the pre-
800
vious year.12 Assets managed by asset owners made the greatest con-
tribution to this, with a growth rate of 91 %. With a volume of CHF
455 billion, sustainable assets managed by asset owners now account 700
for 63 % of the total sustainable investment market in Switzerland.
Investment funds represented CHF 190.9 billion and showed a re-
markable growth rate of 102 %, while mandates stood at CHF 70.8 213.2 600
billion and recorded an increase of 22 %.
Figure 4 shows the development of the market volume of sus-
tainable assets in Switzerland from 2008 to 2018. Since 2008, the 500
compound annual growth rate for sustainable funds and mandates
has been around 26 %. Asset owners were included for the first time
400
in the market survey in 2015. Over the past four years, the compound 241.8
annual growth rate of their assets has been about 69 %.
300
5.9
64.8
200
6.2
100
184.7
0
Existing participants’ funds New participants’ funds
Existing participants’ mandates New participants’ mandates
Existing asset owner participants New asset owner participants
SWI S S S US TAINABLE F INANCE Swiss Sustainable Investment Market Study 2019 18Figure 6
GROWTH FACTORS OF SUSTAINABLE FUNDS
AND MANDATES IN 2018 (IN %) (n=32)13
FUNDS 62 % Inflows MANDATES 7% Inflows
29 % Funds of 29 % Mandates of
new participants new participants
9 % New funds 19 % New mandates
45 % Mandate
conversions
As in previous years, the strong growth in volumes of asset owners growth, based on available data, a considerable share can be attrib-
can primarily be explained by a combination of new volumes from uted to conversion of existing funds. In view of the negative market
first-time respondents as well as higher sustainable investment vol- performance in 2018, it could have been expected that growth rates
umes reported by existing participants. As shown in Figure 5, newly would have been much lower ; however, it seems as though inflows,
participating asset owners contributed CHF 213.2 billion to the over- new fund launches and fund conversions more than outweigh this
all volume. For asset managers, the increase due to new study partic- negative market performance.
ipants was low, corresponding to CHF 12.1 billion (CHF 6.2 billion in Sustainable mandates increased by about 22 % (CHF 13 billion)
funds, CHF 5.9 billion in mandates). In sum, the majority (two thirds) compared to 2017. Based on available data, asset managers who
of the total growth can be attributed to new participants, while ex- participated in the survey for the first time generated 29 % of the
isting participants contributed the remaining third of the 83 % total growth in total mandate volume. The biggest proportion of the
growth. mandate growth (45 %) can be attributed to conversions of conven-
Figure 6 takes a closer look into the origins of the growth of tional mandates into sustainable mandates. New mandate launches
sustainable funds and mandates in 2018. Based on the data available contributed 19 % to the increase in mandate volume and inflows were
(for approximately one quarter of the total fund volume growth, the about 7 %. Here again, since most major markets (except sovereign
source of growth was specified), 62 % of the specified growth can be bonds) experienced performance losses in 2018, sustainable man-
attributed to inflows into the funds of existing participants. Another dates likely have new activities exceeding the total increase of CHF
significant portion is generated by funds of new study participants 13 billion.
– accounting for 29 % of the specified growth and for new fund Funds have been growing stronger than mandates over the past
launches (9 %). For the remaining three quarters of unspecified three years, which seems to be developing into a long-term trend.
12 Based on the SSF 2018 report, CHF 390.6 billion for the end of 2017.
13 The source of growth was only specified for approximately one quarter of the
total fund volume growth. For the mandates, the source of growth was specified
for the majority of the assets.
Swiss Sustainable Investment Market S W I S S S U S TA I N A B LE F I N A N C E 19Figure 7
TOP 10 SWISS MARKET PLAYERS FOR SUSTAINABLE
INVESTMENTS BY ASSETS UNDER MANAGEMENT IN SWITZERLAND
(IN % AND CHF BILLION) (n=39)
Market Share in % Volume (CHF billion)
35 % 90
31.5 %
80
30 %
70
25 %
60
20.2 %
20 % 50
15 % 40
30
10 % 8.7 % 8.5 %
6.2 % 20
5% 4.2 % 4.2 %
10
2.0 % 1.8 %
1.1 %
0% 0
Partners UBS Group AG Vontobel* Credit Suisse AG Bank J. Safra Pictet Group** Zürcher RobecoSAM AG LGT Capital BlueOrchard
Group Sarasin Kantonalbank / Partners AG Finance Ltd
Swisscanto
Invest by Zürcher
Kantonalbank
* this includes assets from Raiffeisen Schweiz and Ethos Services SA
** combined AuM of Pictet Asset Management and Pictet Wealth Management (includes assets managed for Ethos Services SA)
A comparison of the developments in the SI market with the overall
growth of the asset management market in Switzerland reveals the
particularly dynamic growth of sustainable investments. As of De-
cember 2018, the overall volume of the Swiss fund market stood at
CHF 1,041 billion.14 This represents a market decline of about -4.2 %
compared to the previous year. In contrast to the general market
trend, the substantial growth of the reported sustainable funds
(102 %) is a very positive outcome. The amount of sustainable funds
(CHF 190.9 billion) now corresponds to 18.3 % of the overall fund
market in Switzerland.
SWI S S S US TAINABLE F INANCE Swiss Sustainable Investment Market Study 2019 20Figure 8
RATIO OF SI VOLUME COMPARED TO TOTAL AUM
(IN NUMBER OF RESPONDENTS) (n=36)
Above 90 % 14
Between
5
20 and 90 %
Below 20 % 17
0 2 4 6 8 10 12 14 16 18
Number of respondents
Assets of Swiss pension funds stood relatively stable compared to One interesting question is what proportion of sustainable invest-
2017, at CHF 878.7 billion in 2018.15 The investments of Swiss insur- ments is held by asset managers compared to their total assets under
ance companies achieved a volume of CHF 587 billion by the end of management (AuM). Among 36 responding asset managers, 14 indi-
2017, which corresponds to a growth rate of 1.3 %.16 The growth rate cated that a share of above 90 % of total firm-wide assets could be
of 91 % for sustainable investments held by asset owners covered in classified as sustainable assets (Figure 8). This corresponds to 38 %
this study is hence way above the growth rate of the overall assets. of all participating asset managers, a much higher share than last
This SI growth was mainly determined by new study participants. year, when only 28 % of asset managers reported a share of above
Nevertheless, the outcome underlines the growing interest and rele- 90 %. The remaining asset managers reported lower shares. Five par-
vance of sustainable investments for asset owners. Based on inter- ticipants have between 20 % and 90 %, and 17 of them have less than
views, we can confirm that a number of asset owners have imple- 20 % of their total assets devoted to sustainable investments. This
mented sustainability approaches for the first time in the course of shows that both types of firms are well established in Switzerland :
the past year. In general, the amount of SI reported by asset owners specialised SI companies as well as those offering SI, while the main
(CHF 455.01 billion) now corresponds to 31 % of the overall invest- focus is on traditional products.
ments of pension funds and insurance companies. This share is most
likely an underestimation of the total share of sustainable assets
held by Swiss asset owners, as sustainable mandates outsourced to
asset managers were not counted towards asset owner volumes, be-
14 SFAMA (2019) : “ Swiss Fund Market Statistics – Month-End Analysis 31.12.2018 ”,
cause the main scope of this study was about sustainable assets available at : https://www.swissfunddata.ch/sfdpub/fundmarket-statistics, accessed
managed in Switzerland. 11/04/2019.
Figure 7 provides an overview of the leading Swiss asset man- 15 Willis Towers Watson (2019) : “ Global Pension Assets Study 2019 ”, available at
agers in terms of their sustainable investments managed in Switzer- https://www.thinkingaheadinstitute.org/en/Library/Public/Research-and-Ide-
as/2019/02/Global-Pension-Asset-Survey-2019, accessed 11/04/2019.
land. Collectively, the Top 10 market players manage around CHF
16 FINMA (2018) : “ Insurance Market Report 2017 ”, available at https://www.finma.ch/
213.7 billion in sustainable funds and mandates, handling about 89 % en/documentation/finma-publications/reports/insurance-reports/, accessed
of the total amount covered by the SSF survey. 12/04/2019.
Swiss Sustainable Investment Market S W I S S S U S TA I N A B LE F I N A N C E 21Figure 9
DEVELOPMENT OF INSTITUTIONAL AND PRIVATE
SUSTAINABLE INVESTMENTS (IN CHF BILLION) (n=61)
Volume (CHF billion)
800
700
600
2.2 INVESTOR TYPES
500
Figure 9 shows that volumes of sustainable investments by both 88 %
groups of investors, institutional as well as private, have significant- 630.2 400
ly increased over the past year. They now stand at CHF 630.2 billion
and CHF 86.4 billion, respectively.17 From 2017 to 2018, the volume
300
held by institutional investors has recorded a substantial increase of 87 %
86 %
around CHF 293.9 billion – this corresponds to a growth rate of 87%.18 336.3
200
The growth rate for private investors stood at 59 %, with an increase
in volume of CHF 32.2 billion. These numbers illustrate the continued
strong relevance of institutional investors within the Swiss sustaina- 100
59 %
ble investment market, which make up 88 % of all SI (a marginal rise 86.4 12 %
from 86 % in 2017).
14 % 54.2
0
With about 58 % of the total volume, insurance companies were 2017 2018
the largest group among SI institutional investors in 2018 (Figure 10). Private Institutional
They are followed by public pension funds or reserve funds, which
account for around 29 %, and by corporate/occupational pension
funds – accounting for around 11 %. In comparison, institutional in-
vestors such as foundations or public authorities currently do not
play significant roles in the overall sustainable investment market in
Switzerland.
Figure 10
INSTITUTIONAL INVESTOR DISTRIBUTION IN SI
(IN %) (n=57)
58.2 % Insurance companies
28.7 % Public pension funds or reserve funds
10.5 % Corporate/Occupational pension funds
0.9 % Foundations & endowments
0.7 % Religious institutions & charities
0.2 % Public authorities & governments
0.9 % Others
SWI S S S US TAINABLE F INANCE Swiss Sustainable Investment Market Study 2019 22Figure 11
DEVELOPMENT OF THE INSTITUTIONAL SI INVESTOR
LANDSCAPE (IN %) (n=57)
58 %
Insurance companies
45 %
29 %
Public pension funds or reserve funds
40 %
10 %
Corporate/Occupational pension funds
12 %
1%
Foundations & endowments
1%
1%
Religious institutions & charities
1%
0%
Public authorities & governments
1%
1%
Others
1%
0% 10 % 20 % 30 % 40 % 50 % 60 % 70 %
2018 2017
The relative importance of the various institutional investor types
has changed since 2017 primarily due to the expanded market cover-
age for asset owners. Some trends already reported in the 2017 re-
port continued in 2018. As illustrated in Figure 11, insurance compa-
nies, for example, continued to record a significant increase in
absolute volume, which corresponds to a relative increase of 13 per-
centage points. In the meantime, public pension funds or reserve
funds have fallen by eleven percentage points to about 29 %. Corpo-
rate and professional funds recorded only a slight reduction of two
percentage points from 12 % to 10 % this year. Nevertheless, it should
be noted that these numbers are relative figures. Since the total SI
volume of institutional investors has increased significantly, a shrinking
relative market share does not imply an absolute volume reduction.
17 Since not every asset manager participant answered the questions on this
topic, asset managers’ volumes for institutional and private investors have been
extrapolated to their total reported SI volumes for both years.
18 This increase can partly be explained by the higher number of asset owners who
participated in this survey compared to last year.
Swiss Sustainable Investment Market S W I S S S U S TA I N A B LE F I N A N C E 23Figure 12
DEVELOPMENT OF SI APPROACHES
(IN CHF BILLION) (n=70)
490.4
ESG Integration
188.9
+160 %
379.0
Exclusions
142.6
+166 %
315.7
Norms-based Screening
217.8
+45 %
286.7
ESG Engagement
157.8
+82 %
159.5
ESG Voting
117.8
+35 %
89.6
Best-in-Class
65.1
+38 %
Sustainable Thematic 39.2
Investments 36.9
+6 %
16.3
Impact Investing
12.1
+35 %
0 100 200 300 400 500 600
2018 2017 Volume (CHF billion)
2.3 SUSTAINABLE INVESTMENT APPROACHES Figure 13
ESG INTEGRATION (IN CHF BILLION) (n=40)
This chapter provides a detailed analysis of the different SI ap-
proaches in Switzerland. Figure 12 presents the total volumes to
which the various approaches were applied in 2017 and 2018, includ- 2018 175.4 49.2 265.8
ing both asset manager as well as asset owner data. In 2018, ESG
integration is now in the lead with a total volume of CHF 490.4 billion.
+160 %
Exclusions recorded the highest growth rate of 166 %. Also, the en- 2017 79.4 40.1 69.4
gagement approach showed a striking increase of about 82 % com-
pared to the previous year. Active ownership via voting stood at CHF
160 billion and experienced 35 % growth. The best-in-class approach 0 100 200 300 400 500 600
as well as sustainable thematic investments also grew, but remained
at modest levels, followed by impact investing. Funds Mandates Asset Owner Volume (CHF billion)
ESG INTEGRATION
Figure 14
Echoing the findings of the latest Eurosif report 19, ESG integration EXCLUSIONS (IN CHF BILLION) (n=45)
has gained massively in importance for Swiss asset managers and
owners. At CHF 490.4 billion, ESG integration now ranks first in Swit-
zerland and is applied to 68 % of all sustainable assets. With about 2018 124.7 56.6 197.7
160 % growth, the ESG integration approach has experienced re-
markable growth since 2017 (Figure 13). This can largely be attributed
+166 %
to new asset owner participant volumes and additionally to existing 2017 54.1 45.2 43.3
study participants who have introduced a more systematic ESG inte-
gration process to a larger share of their assets.
0 50 100 150 200 250 300 350 400
Funds Mandates Asset Owner Volume (CHF billion)
SWI S S S US TAINABLE F INANCE Swiss Sustainable Investment Market Study 2019 24Figure 15
APPLIED EXCLUSION CRITERIA FOR COMPANIES
(IN CHF BILLION) (n=43)
Weapons
163.8 13.5
(production and trade)
Violation of human rights 47.2 54.8
Labour issues 42.8 54.8
Tobacco 82.4 14.3
Severe environmental
35.7 54.7
degradation
Nuclear energy (production) 71.8 14.9
Corruption and bribery 41.8 43.0
Pornography 63.6 14.4
Gambling 53.0 14.9
Coal 48.1 14.5
GMOs 44.1 14.3
Alcohol 40.1 12.2
Animal Testing 7.7
Other 26.2 153.5
0 20 40 60 80 100 120 140 160 180 200
Asset Manager Asset Owner Volume (CHF billion)
EXCLUSIONS
With an increase of 166 %, the exclusion approach achieved the high- Figure 15 further shows that the choice of exclusion criteria differs
est growth rate this year, resulting in total volumes of CHF 379 billion. considerably between asset managers and asset owners. Asset own-
The exclusion approach is applied to 53 % of all sustainable invest- ers tend to apply criteria such as violation of human rights and la-
ments in Switzerland. With a share of 52 %, asset owners account for bour issues (both CHF 54.8 billion), severe environmental degrada-
about half of the overall volume (Figure 14). Assets that exclusively tion (CHF 54.7 billion) or corruption and bribery (CHF 43 billion). The
apply an exclusion of cluster munitions, anti-personnel mines and/or strong growth in the category “ other ” can be mainly explained by a
weapons of mass destruction, as defined in the Federal Act on War large new participant who implements their own exclusions based on
Material (WMA)20 are not counted towards the exclusion strategies. poor ESG performance and severe controversies.
The exclusion criterion for SI assets used most frequently was
the production and trade of weapons (Figure 15).21 As of 31 December
2018, these assets amounted to CHF 177.3 billion (2017 : CHF 102.5
billion). The volume from asset managers is pivotal in this context,
accounting for 92 % of the total volume. Other top criteria regarding
controversial business practices or areas are violation of human
19 Eurosif (2018) : “ European SRI Study 2018 ” available at : http://www.eurosif.
rights, covering CHF 102 billion (2017 : CHF 99.7 billion), labour issues org/2018sristudylaunch/, accessed 17/04/2019.
with CHF 97 billion (2017 : CHF 88.9 billion) and tobacco with CHF 96.7 20 According to the Swiss Federal Act on War Material (WMA), the direct financing
billion (2017 : CHF 86.1 billion). (and indirect if used to circumvent direct financing) of the development, manufacture
or acquisition of prohibited war materials (Article 8b WMA) is prohibited, which is why
SSF decided to no longer count such exclusions, if used exclusively, as sustainable
investments.
21 The mere exclusion of cluster munitions and anti-personnel landmines and weapons
of mass destruction is not included in these numbers.
Swiss Sustainable Investment Market S W I S S S U S TA I N A B LE F I N A N C E 25Figure 16
APPLIED EXCLUSION CRITERIA FOR COUNTRIES
(IN CHF BILLION) (n=20)
Dictatorship 9.3
Death penalty 7.4
Corruption 7.0
Violation of non- 5.4
proliferation treaties
Nuclear energy 2.2
Non-ratification of
environmental conventions 1.2
Other 9.3
0 1 2 3 4 5 6 7 8 9 10
Volume (CHF billion)
In 2018, the top exclusion criterion applied to countries by asset Survey respondents were also asked about the actions they take
managers was dictatorship (CHF 9.3 billion, see Figure 16). Exclusions when companies are found to be in breach of one of the applied
based on death penalty reached a slightly lower volume at CHF 7.4 norms. The responses indicate that asset managers and owners typ-
billion, followed by corruption with CHF 7.0 billion. Additionally, a ically take further action (Figure 19). The most common action for
range of other criteria were mentioned, such as a very high military asset managers (20 from 22 respondents) is to exclude these compa-
budget or violation of human rights, and a low ESG rating by MSCI. nies from their investment universe. Asset owners initially favour
active interaction with companies before withdrawing their invest-
NORMS-BASED SCREENING ment (16 from 18 respondents). A less common approach for asset
owners and managers was to change their weightings of such hold-
At CHF 315.7 billion, norms-based screening now ranks third in Swit- ings in response to violations.
zerland, having recorded an annual growth rate of 45 %. As shown in
Figure 17, this approach is used by slightly more asset managers
(62 %) than asset owners (38 %). Overall, norms-based screening is
applied to 44 % of all sustainable investments in Switzerland. The
funds managed under this approach recorded a 173 % volume growth Figure 17
in 2018 compared to 2017. This effect can mainly be attributed to a NORMS-BASED SCREENING (IN CHF BILLION) (n=34)
few large institutions which implemented norms-based screening for
substantial portions of their managed assets.
The most important norm against which portfolios are screened 2018 147.6 49.6 118.5
is the UN Global Compact (CHF 151.9 billion, see Figure 18). This is
followed by the OECD Guidelines for MNCs (CHF 108.7 billion), the ILO
+45 %
Conventions (CHF 83.9 billion) and the UN Guiding Principles on
2017 54.0 45.7 118.1
Business and Human Rights (CHF 55.8 billion). Besides these interna-
tional frameworks, respondents used several other norms as the ba-
sis for their screens, such as the International Union for Conserva- 0 50 100 150 200 250 300 350
tion of Nature (IUCN), or they indicated they based their screen on
SVVK-ASIR criteria. Funds Mandates Asset Owner Volume (CHF billion)
SWI S S S US TAINABLE F INANCE Swiss Sustainable Investment Market Study 2019 26You can also read