Sydney Impact Report Retail Market - Preston Rowe Paterson . Sydney ...
←
→
Page content transcription
If your browser does not render page correctly, please read the page content below
Sydney Impact Report
                                                                                                            Retail Market

                                                                                                            December Quarter 2016

Sydney’s Retail Sector Strengthens as 2017 Approaches                                                       INSIDE THIS ISSUE:

In Australia, retail turnover increased by a seasonally adjusted 0.2% over the month of November, which     Retail Statistics             2
is a modest decline from October’s rise of 0.5% and September’s rise of 0.6%. When we look at retail
turnover by state, New South Wales experience the largest increase of 0.5%, followed by Victoria            Online Retail                 2
(0.4%), Queensland (0.1%), Tasmania (0.1%) and the Northern Territory (0.3%). Its performance
followed a similar trend to that of Australia, which overall had a turnover of $25.7 billion. The NAB
Online Retail Sales Index increased by 1.1% over the month of November, a significant increase from         Investment Activity           3
the previous month’s rise of 0.5%. However, we note that year on year increased slowed from 14.1% to
13.3%, as National Bank Australia estimated a figure of $21.4 billion was spent online in the twelve
months to November 2016.                                                                                    Development Activity          5

Sydney’s retail sector continues to reap in the benefits of a low interest rate environment, as retailers   Economic Fundamentals         7
and owners of retail properties enjoy the ongoing gains from the first half of 2016. There is a high
investor demand in Sydney not seen anywhere else in Australia, with the strong retail sector supported
by New South Wale’s strong economy, favourable exchange rate and succeeding boom in the tourism             About Preston Rowe Paterson   8
sector and strong state-wide housing market. Compression of yields in retail properties have been
apparent with the transactions that have occurred in the past year. Strong investor demand have also
driven rental growth, as Sydney experience an increase in population growth in the next few years and       Contact Us                    10
improving infrastructure developments.

Phone: +61 2 9292 7400
                                                                                                                                          1
Fax: +61 2 9292 7404
Address: Level 14, 347 Kent Street Sydney NSW 2000
Email: research@prpsydney.com.au
Follow us: Visit www.prpsydney.com.au to follow us
© Copyright Preston Rowe Paterson NSW Pty Limited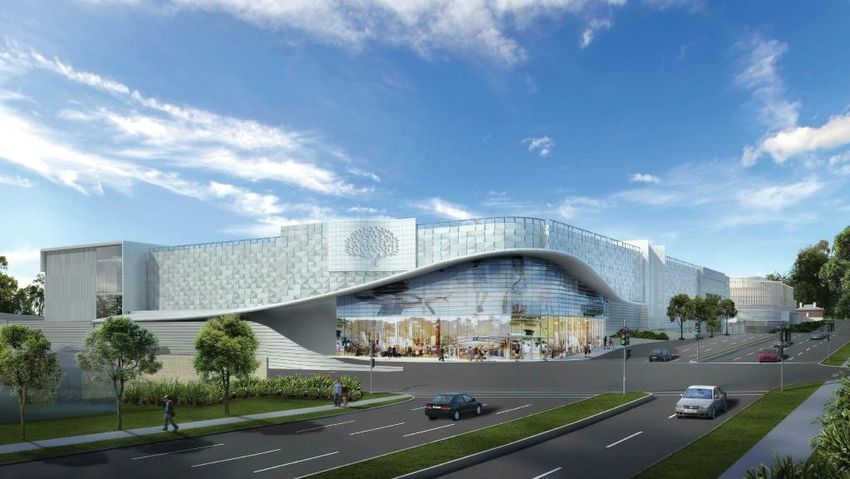
Retail Statistics
In Australia, retail turnover increased by a seasonally adjusted 0.2% over 8,500
Source: ABS/Preston Rowe Paterson Research
4.0
3.5
the month of November, which is a modest decline from October’s rise of
3.0
8,000
0.5% and September’s rise of 0.6%. When we look at retail turnover by 2.5
2.0
state, New South Wales experience the largest increase of 0.5%, followed 7,500
1.5
Monthly Percentage Change (%)
Retail Turnover $ million
by Victoria (0.4%), Queensland (0.1%), Tasmania (0.1%) and the Northern 1.0
7,000 0.5
Territory (0.3%). In contrast, Western Australia (-0.6%), South Australia (- 0.0
-0.5
0.4%) and the Australian Capital Territory (-0.1%) all experienced declines 6,500
-1.0
in turnover for the month of November. 6,000
-1.5
-2.0
-2.5
5,500 -3.0
New South Wales achieved a seasonally adjusted turnover of $8.286 billion
Oct-14
Sep-14
Nov-14
Dec-14
Mar-15
Apr-15
May-15
Jul-15
Oct-15
Aug-15
Sep-15
Nov-15
Dec-15
Mar-16
Apr-16
May-16
Jul-16
Oct-16
Aug-16
Sep-16
Nov-16
Jan-15
Feb-15
Jun-15
Jan-16
Feb-16
Jun-16
over the month of November, an increase of 0.5% over the month. When New South Wales Total (Industry) Turnover % Monthly Change
Chart 2—New South Wales Retail Turnover—Source—ABS
we look at year-on-year percentage changes in retail turnover for different
subgroups, Clothing, footwear & personal accessory experienced the
largest increase of 7.51%. Café, restaurants & takeaway food services Online Retail
(6.6%), Household goods (4.9%), Food retailing (3.80%) and Other retailing The Australian & New Zealand Standard Industrial Classification (ANZSIC)
(3.4%) all experienced increases over the year, whilst Other recreational defines ‘retail trade’ as “the purchase and on-selling, commission-based
goods (-6.62%), Department stores (-2.7%), Electrical good (-2.7%) and buying, and commission-based selling of goods, without significant
Furniture & houseware retailing (-0.91%) dragged down the state’s overall information, to the general public”.
turnover performance. New South Wale’s performance followed a similar
trend to that of Australia, which overall had a turnover of $25.7 billion. The NAB Online Retail Sales Index increased by 1.1% over the month of
Australia’s performance was lifted up by Clothes, Hardware items and November, a significant increase from the previous month’s rise of 0.5%.
Takeaway foods, and was dragged down by Recreational goods, However, we note that year on year increased slowed from 14.1% to 13.3%,
Department stores and Electrical goods. as National Bank Australia estimated a figure of $21.4 billion was spent
online in the twelve months to November 2016. This represents a 7.1% of
total spending by traditional retail spending as measured by the ABS). NAB
10.00%
noted that declines in spending in Homeware and appliances (10.5%, year-
8.00%
on-year in November, compared to 14.9% year-on-year in October), Media
6.00% (19.2% year-on-year, compared to 23.8% year-on-year) contributed to the
Year-on-Year % Change
4.00% overall annual slowdown of online retail. However, increase in spending on
Groceries & liquor (8.5% year-on-year, compared to 4.7% year-on-year) and
2.00%
Fashion (21.1% year-on-year, compared to 15.0% year-on-year) helped to
0.00%
counteract a larger than expected decline.
-2.00%
Year-on-year Growth (%)
-4.00%
Food Retailing Household goods Clothing, footwear & Department Stores
personal accessory
Other Retailing Café, restaurants &
takeaway food
September October November
Source: ABS/Preston Rowe Paterson Research Retail Sectors
services 2016 2016 2016
Online Index 15.3 14.1 13.3
Chart 1—Year on Year % change to November 2016 of retail subgroups—Source—ABS
ABS Retail 4.4 2.1 3.4
Table 1—NAB Online Retail Sales Index—Source—NAB, ABS
Phone: +61 2 9292 7400
Fax: +61 2 9292 7404
Address: Level 14, 347 Kent Street Sydney NSW 2000
2
Email: research@prpsydney.com.au
Follow us: Visit www.prpsydney.com.au to follow us 2
© Copyright Preston Rowe Paterson NSW Pty Limited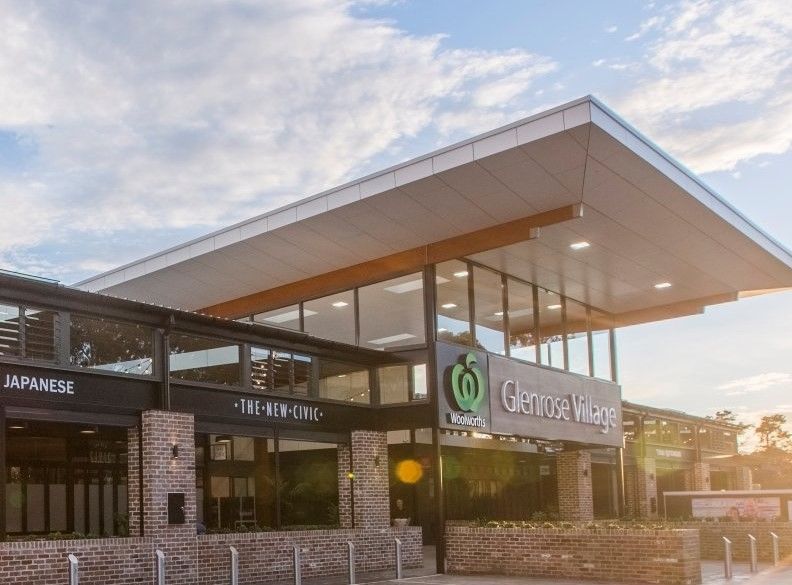
RETAIL MARKET

 Analysis of the Property Council of Australia’s (PCA) Shopping Centre Directory has revealed the following definitions of the eight core classifications of
 shopping centres;
 1.      City Centre—Retail premises within an arcade or mall development with a total gross lettable area exceeds 1,000 sqm.
 2.           Super Regional Centre—A major shopping centre which typically includes two full line department stores, two supermarkets, one or more full line
              discount department stores and approximately 250 specialty shops. Total gross lettable area exceeds 85,000 sqm.
 3.           Major Regional Centre—A major shopping centre with at least one full line department store, one or more full line discount department stores, a
              supermarket and approximately 150 specialty shops. Total gross lettable area ranges between 50,000 & 85,000 sqm.
 4.           Regional Centre—A shopping centre with one full line department store, a full line discount departments store, supermarket and approximately 100
              specialty shops. Total gross lettable area ranges between 30,000 & 50,000 sqm.
 5.           Sub-Regional Centre—A medium sized shopping centre with at least one full discount department store, major supermarket and approximately 40
              specialty shops. Total gross lettable area ranges between 10,000 & 30,000 sqm.
 6.           Neighbourhood Centre—A local shopping centre comprising a supermarket and approximately 35 specialty shops. Total gross lettable area is less
              than 10,000 sqm.
 7.           Outlet Centre— A medium to large sized shopping centre which does not normally include a department store, discount department store or
              supermarket. Comprises of specialty shops often selling stock at discounted prices including samples, seconds ad discontinued lines.
 8.           Bulky Goods Centre— A medium to large sized shopping centre dominated by bulky goods retailers (furniture, white goods and other home wares),
              occupying large areas to display merchandise. Typically contain a small number of specialty shops. Total gross net lettable area retail is generally
              greater than 5,000 sqm.

 Investment Activity
 Preston Rowe Paterson Research recorded a number of significant retail sales in New South Wales over six months to September 2016.

                                                                                     Sale     Reported                                                        GLAR
         Centre                        Address                     Sale Price                                  Vendor                  Purchaser                           $/sqm           Type
                                                                                     Date       Yield                                                         (sqm)
Marketfair Campbelltown       4 Tindall Street, Campbelltown                                                                                                                           Enclosed Retail
                                                               $     48,250,000.00   Aug-16     6.50%        Private owner                 APOF II            9,094    $    2,098.00
Mall                                     NSW 2560                                                                                                                                          Centre

                              77 Market Street, Sydney NSW                                                                           Scentre Group/Cbus                                Enclosed Retail
David Jones                                                    $    360,000,000.00   Aug-16     4.50%     Woolworths Holdings                                 9,427    $ 32,030.00
                                          2000                                                                                              Fund                                           Centre
                            271 Queen Street, Campbelltown                                                                                                                             Enclosed Retail
Campbelltown Mall                                              $    197,000,000.00   Sep-16     6.00%      Perron Investments        Charter Hall Group       42,200   $    4,668.00
                                      NSW 2560                                                                                                                                             Centre

37 Epping Road, Macquarie    37 Epping Road, Macquarie Park                                                                                                                             Bulky Goods
                                                               $     34,000,000.00   Sep-16    7-8.00%   Abacus Property Groups            CorVal             8,010    $    4,245.00
Park NSW 2113                           NSW 2113                                                                                                                                          Centre
                                                                                                                                                                                       Enclosed Retail
Edgecliff Centre                   Edgecliff NSW 2027          $    138,750,000.00   Sep-16     3.72%        Private owner            Longhurst Group         10,845   $ 12,794.00
                                                                                                                                                                                           Centre
124 Campbell Parade,        124 Campbell Parade, Bondi Beach                                             Rebel Property Group/
                                                             $       19,120,000.00   Sep-16    ~3.00%                                  private investor        335     $ 57,058.00     Neighbourhood
Bondi Beach NSW 2026                  NSW 2026                                                           Eduard Litver/Gil Baron
17 Blaxland Serviceway,         17 Blaxland Serviceway,                                                                            Ceannlocha Investments
                                                               $        13,981,000   Sep-16      N/A         Alafact Pty Ltd                                   676     $ 20,682.00     Neighbourhood
Campbelltown NSW 2560           Campbelltown NSW 2560                                                                                      Pty Ltd

282 Victoria Avenue,         282 Victoria Avenue, Chatswood
                                                               $        37,000,000   Oct-16     6.22%         Nirad Pty Ltd         Ut 282 Victoria Pty Ltd   5,572    $    6,640.00   Neighbourhood
Chatswood NSW 2067                      NSW 2067
                            1/9 Railway Parade, Kogarah NSW                                               Stonebridge Property                                                         Enclosed Retail
Kogarah Town Centre                                            $     47,500,000.00   Oct-16     6.95%                                  Private Investor       6,484    $    7,326.00
                                          2217                                                                   Group                                                                     Centre
                                                                                                                                                                                       Enclosed Retail
Menai Central               5/21 Carter Road, Menai NSW 2234   $        43,300,000   Oct-16     7.23%    Sentinel Property Group      Wingdom Group           10,165   $    4,260.00
                                                                                                                                                                                           Centre

 Table 2—Retail Centre Sales Transactions - Source - Preston Rowe Paterson Research

Phone: +61 2 9292 7400
Fax: +61 2 9292 7404
Address: Level 14, 347 Kent Street Sydney NSW 2000
                                                                                                                                                                                                   3
Email: research@prpsydney.com.au
Follow us: Visit www.prpsydney.com.au to follow us                                                                                                                                                       3
© Copyright Preston Rowe Paterson NSW Pty Limited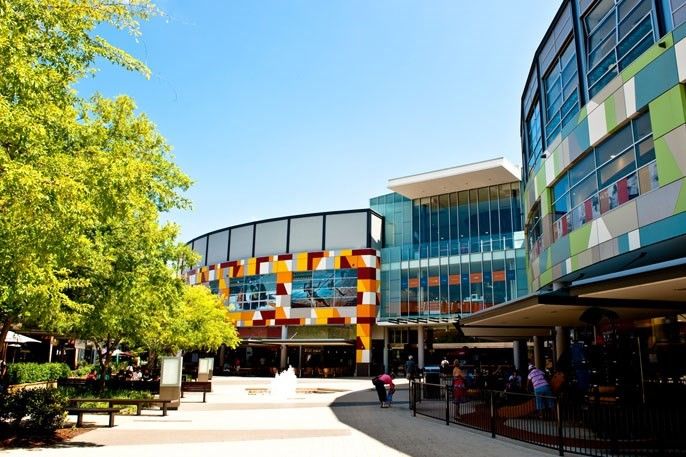
Sale      Reported                                                           GLAR
          Centre                          Address                       Sale Price                                           Vendor                 Purchaser                            $/sqm
                                                                                             Date        Yield                                                            (sqm)
                               Bathurst Supa Centre, Kelso NSW
Bathurst Supacentre                                            $                14,500,000   Nov-16       7.51%           Private syndicate         private investor       6,565     $     2,209.00
                                             2795
                              315 Parramatta Road, Auburn NSW
Super AMART Auburn                                             $                28,250,000   Dec-16        N/A                  N/A                       N/A              10,805    $     2,615.00
                                             2144
                                  21 Great Western Highway,
Bunnings Bathurst                                              $                25,500,000   Dec-16       5.35%           Bunnings Group            Private investor       14,272    $     1,787.00
                                      Bathurst NSW 2795

 Table 3—Large Format Retail Property Sales Transactions - Source - Preston Rowe Paterson Research
 N/A = not currently available

Sales Information                                                                                     Menai Central
                                                                                                      The Menai Central retail complex, located in the South Sydney suburb of
Preston Rowe Paterson Research recorded many major retail                                             Menai, was acquired in October 2016 by Wingdom Group from Sentinel
transactions in the six months to September 2016. Notable sales                                       Property Group for $43.3 million. The complex is anchored by
transactions over the six months include:                                                             supermarket IGA, liquor store Dan Murphy and fitness centre Goodlife
                                                                                                      Health Club, and offers 10,165 sqm of net lettable area and 275 parking
                                                                                                      spaces. It is reported by Sentinel the trust that held the property, Sentinel
                                                                                                      Menai Retail Trust, performed strongly amongst unlisted commercial
David Jones, Market Street
                                                                                                      property trusts and led to investors in the Trust to reap in a 11.5% return
Sydney’s David Jones Market Street store was sold in August for $360 million.
                                                                                                      on equity generated by the complex’s rental income.
The retail store, located at 77 Market Street, was jointly acquired by Scentre
Group and Cbus, of which the former group will pay $182.5 million whilst CBUS will
pay the remaining $177.5 million. Furthermore, it is reported that Scentre will
venture to redevelop the retail floors to adjoin to the rest of Westfield mall, while
Melbourne-based superfund Cbus will develop the air rights into office spaces and
apartments above. Currently, the site is occupied by a 13-storey building, however,
after development, this could increase to 20 storeys.

                                                                                                      Menai Central retail complex was acquired by Wingdom Group from Sentinel for $43.3
                                                                                                      million.

                                                                                                      Kogarah Town Centre
                                                                                                      Kogarah Town Centre was also sold in October, with the sale fetching
                                                                                                      $47.5 million on a passing yield of 6.95%. The vendor, Stonebridge
                                                                                                      Property Group sold the centre to a private investor through an off market
                                                                                                      retail transaction. The neighbourhood centre contains approximately
David Jones menswear store on Market Street has been sold for $360 million, with plans to
construct apartments on top of a revamped retail centre.                                              6,485 sqm of net lettable area and is currently anchored by supermarket
                                                                                                      giants Woolworths and Aldi, along with eighteen specialty tenants and the
                                                                                                      Kogarah Tavern. Strong demand remains for retail centres that are close
                                                                                                      to full tenancies, with the property attracting strong interest from a variety
                                                                                                      of buyers.

 Phone: +61 2 9292 7400
 Fax: +61 2 9292 7404
 Address: Level 14, 347 Kent Street Sydney NSW 2000
                                                                                                                                                                                                4
 Email: research@prpsydney.com.au
 Follow us: Visit www.prpsydney.com.au to follow us                                                                                                                                                   4
 © Copyright Preston Rowe Paterson NSW Pty Limited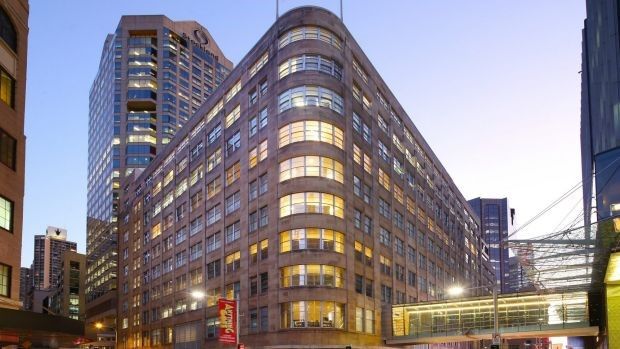
Development Activity

Preston Rowe Paterson Research recorded a number of retail developments that are in various stages of construction in New South Wales over six months to
September 2016.

                                                                                                                            Extension   Refurbish
                      Centre                                       Address                        Type          New (sqm)                           Completion
                                                                                                                              (sqm)       (sqm)
                                                  Cnr Devlin Street & Blaxland Road, Ryde
Top Ryde City                                                                                  Sub Regional                                8,700      Q4 2016
                                                  NSW 211

Bunnings Katoomba                                 48 Megalong Street, Katoomba NSW 2780        Bulky Goods        3,204                               Q4 2016

Warriewood Square                                 Jacksons Road, Warriewood NSW 2102           Sub Regional                   7,500                   Q4 2016

                                                  Condamine Street & Old Pittwater Road,
Westfield Warringah Mall                                                                       Super Regional                 7,000                   Q4 2016
                                                  Brookvale NSW 2100

Coles East Leppington                             Leppington NSW 2179                           Freestanding      5,440                                2017

                                                  Jersey Road & Popondetta Road, Emerton
Emerton Village Shopping Centre                                                                Neighbourhood                  7,500                    2017
                                                  NSW 2770

Glenrose Shopping Centre (Stage 2)                56-58 Glen Street, Belrose NSW 2085          Neighbourhood                  10,243                   2017

                                                  326 Camden Valley Way, Narellan NSW
Narellan Town Centre                                                                              Regional                    36,000                   2017
                                                  2567
                                                  200 Gilchrist Drive, Campbelltown NSW
Macurthur Square Shopping Centre                                                               Major Regional                 12,000                   2018
                                                  2560
                                                  1-11 Town Terrace, Glenmore Park, NSW
Glemore Park Town Centre                                                                       Sub-Regional                   8,700                    2018
                                                  2745
                                                  1 Molly Morgan Drive, East Maitland NSW
Stockland Green Hills Shopping Centre                                                          Sub Regional                   37,000                   2018
                                                  2323
Stockland Glendale Shopping Centre                387 Lake Road, Glendale NSW 2285             Sub Regional                   7,680                    2019
Woolworths Prestons                               Prestons, NSW 2170                           Neighbourhood      6,100                                2019

Bonnyrigg Shopping Village                        Edensor Park, NSW 2176                       Neighbourhood      13,000                               2019

Crown Casino Retail                               Barangaroo, NSW 2000                          Mixed Use         6,700                                2019

Woolworths Kellyville                             Kellyville, NSW 2155                         Neighbourhood      6,265                                2019
                                                  6-14 Old Castle Hill Road, Castle Hill NSW
Castle Towers Shopping Centre                                                                  Super Regional                 80,000      113,457      2020
                                                  2154
Woolworths Kirrawee                               Kirrawee, NSW 2232                            Freestanding      5,400                                2020

Coles Schofields                                  Schofields, NSW 2762                         Neighbourhood                  4,200                    2021
                                                  Bank Street & Pyrmont Bridge Road,
Sydney Fishmarkets                                                                              Mixed Use         15,500                               2021
                                                  Sydney NSW 2009
Westfield Roselands                               Roseland Drive, Roseland NSW 2196               Regional                    50,000      62,000       TBC

Table 4 - Retail Developments - Source - BCI/Preston Rowe Paterson Research

Phone: +61 2 9292 7400
Fax: +61 2 9292 7404
Address: Level 14, 347 Kent Street Sydney NSW 2000
                                                                                                                                                                5
Email: research@prpsydney.com.au
Follow us: Visit www.prpsydney.com.au to follow us                                                                                                                  5
© Copyright Preston Rowe Paterson NSW Pty Limited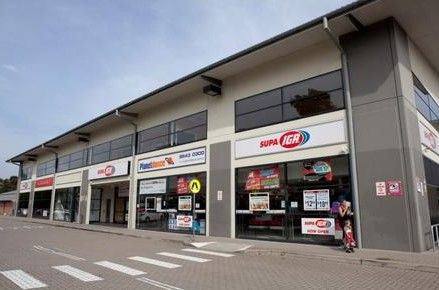
Development Information
The observable retail developments that are due for completion in 2016 and beyond in the Sydney metropolitan area are predominantly retail extension
projects.
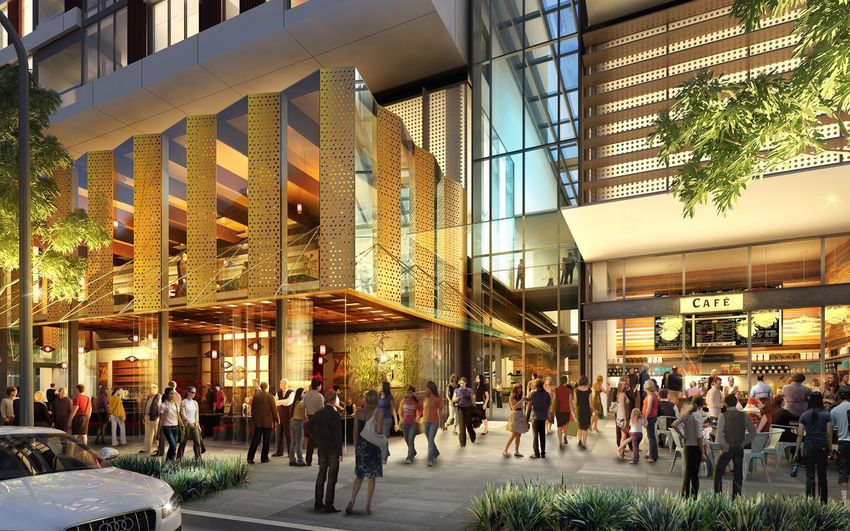
Macarthur Square Glenrose Village Shopping Centre
Macarthur Square is currently undergoing a $240 million redevelopment, Glenrose Village Shopping Centre, located in Sydney’s northern beaches
with the first stage completed and opened to the Public in November suburb of Belrose, reopened in mid-June after the completion of the first
2016, with stages two and three set to open in early and late 2017 stage of redevelopment. The $60 million project resulted in the opening of
respectively. Owned by Australian Prime Property Fund Retail (APPF supermarket chain Woolworths and two dozen specialty stores opening
Retail) and GPT Wholesale Shopping Centre Fund, Macarthur Square will after the completion of the first stage. The second stage of redevelopment,
become New South Wale’s fifth largest shopping centres when fully expected to be completed in April this year, will result in the opening of an
completed. In total, 16,000sqm will be added to the overall retail space. Aldi, a large fruit grocer and further four specialty stores. Alongside many
The first stage comprised of the opening of a number of key fashion former tenants returning to the centre, it will also host a new selection of
brands, with Swedish fashion retailer H&M the main attraction. Stage two new restaurants, cafes and alfresco dining area as well as 520 car park
will comprise of the introduction of 45 specialty stores, an alfresco dining spaces.
terrace and fresh food market hall. A 4,500sqm Coles will also open, along
with 500 parking spaces. The third stage will result in the construction of
1,500sqm Aldi, and 2,500sqm Harris Scarf. Accordingly, this
redevelopment will generate close to 2,000 jobs during the construction,
and up to 1,000 retail position once construction is completed.
Glenrose Village Shopping Centre
Macarthur Square
Castle Towers Shopping Centre
Castle Towers Shopping Centre will under go a redevelopment of its exist-
ing 193,457 sqm centre to add on an extra 80,000 sqm in retail space.
The aim of this redevelopment is to provide shoppers with an immersive
experience through its community embracing space. The re-development
aim to deliver improved shoppers’ shopping and dining experience, as
well as car park facilities. The $900 million expansion plan will aim to
improve access and circulation through the parking area by introducing
new entry and exit points. Castle Towers Shopping Centre
Phone: +61 2 9292 7400
Fax: +61 2 9292 7404
Address: Level 14, 347 Kent Street Sydney NSW 2000
6
Email: research@prpsydney.com.au
Follow us: Visit www.prpsydney.com.au to follow us 6
© Copyright Preston Rowe Paterson NSW Pty Limited
Economic Fundamentals
Consumer Price Index Business Sentiment
All Groups CPI numbers for the December quarter indicate that inflation rate
Business conditions declined over the month to November, as the National
had increased by 0.5% over the quarter, bringing price growth to 1.5% over
Bank of Australia reports further declines in business conditions that is mainly
the year. Core inflation (inflation with volatile items stripped out) increased
driven by profitability and trading conditions in sales and subdued levels of
0.4% over the quarter to bring annual growth to 1.6%. The yearly increase to
employment in Australia. For the month of November, business conditions
December is still larger than the yearly increase recorded in September
index declined by 2 points to +5 index points, ultimately declining to long run
(1.3%), though figures were still lower than economists’ expectations for a
average levels for the first time since April 2015. In saying this, business
0.7% rise. Notably, the 1.5% increase over the calendar year is the lowest in
confidence has increased over the month, remaining steady through the year.
nineteen years, with the last time being back in 1997 when inflation fell
Business confidence in response to global political events, i.e. Brexit and the
backwards by 0.2%.
US Presidential elections were relatively flat, though when combined with
weakening business conditions makes confidence a more difficult measure to
The main contributors to the quarterly increase stemmed from Alcohol &
accurately calculate.
tobacco group (+2.8%), Transport group (+1.7%), Food & non-alcoholic
beverages group (+0.6%) and Recreation & culture group (+0.6%). On the
Consumer Sentiment
other hand the largest decline in prices stemmed from the Communications
group (-0.8%), Furnishing, household equipment & services group (-0.8%),
Consumer sentiment, as measured by the Westpac Melbourne Institute Index, dropped
Health group (-0.6%) and Clothing & footwear group (-0.5%).
in December amidst concerns circling the economy, interest rates and the labour
market. The index stands at 97.3- a decline of 3.5% from November’s index of 101.30-
Australia’s Housing group increased by 0.3% over the quarter, with the main
contributors to this rise stemming from purchases of New dwellings by owner- and indicates that pessimists now outnumber optimists (with 100 being the cut-off point).
occupiers (+0.5%) and maintenance & repair of dwellings (+1.0%). The ABS The index stands at its lowest level in six months, just higher than April’s index of 95.1,
did note that the increase in purchases of new dwellings by owner-occupiers with the Australian economic condition, budget and taxation, geopolitical conditions,
is driven by rises in input costs. Over the calendar year, the Housing group employment, politics and interest rates the main issues influencing respondents’
experienced an increase of 1.9%, with the main contributor again being attitudes and decisions. It is noted that since September, respondents were less
purchases of new dwellings by owner-occupiers (+0.5%). optimistic in their assessment of Australia’s economic conditions, employment and
interest rates, and unchanged in their assessments of taxation and the budget,
111.5 1.00
111.0 international conditions and politics.
110.5 0.80
110.0 104
% Change From Previous Quarter
0.60
Consumer Price Index (All Groups)
109.5
102
109.0
0.40
108.5 100
108.0
Consumer Sentiment
0.20
98
107.5
Consumer Sentiment Index
107.0
0.00 96
106.5
106.0 -0.20 94
Australia Sydney Melbourne Brisbane Adelaide Perth Hobart Darwin Canberra
Source: ABS/Preston Rowe Paterson Research CPI (All Groups) Percentage Change From Previous Quarter 92
Chart 3—All Group CPI (Capital Cities) and Percentage Change from September 2016 to December 2016—
90
Source—ABS Jan-16 Feb-16 Mar-16 Apr-16 May-16 Jun-16 Jul-16 Aug-16 Sep-16 Oct-16 Nov-16 Dec-16
Source: Westpac Melbourne Institute /Preston Rowe Paterson Research
Chart 4—Consumer Sentiment Index, 2016 Overview—Source—Westpac Melbourne Institute Survey
Phone: +61 2 9292 7400
Fax: +61 2 9292 7404
Address: Level 14, 347 Kent Street Sydney NSW 2000
7
Email: research@prpsydney.com.au
Follow us: Visit www.prpsydney.com.au to follow us 7
© Copyright Preston Rowe Paterson NSW Pty Limited
Gross Domestic Product Unemployment
Through the September quarter*, seasonally adjusted GDP declined by Australia’s unemployment rate in December increased by 0.1% to 5.8%, with
0.5%, a figure that is well below what many economists have forecasted the rise influenced by the participation rate increasing to 64.7%. There was a
prior. This is the first quarterly contraction in twenty-one consecutive quarter 13,500 increase in seasonally adjusted employment over the month to Decem-
(the last contraction was in March 2001, during which the economy shrunk ber 2016, with full-time employment increasing by 9,300 persons and part-time
by 0.2%). Following this contraction, yearly growth was dragged to a below employment increasing by 4,200 persons. Nation-wide analysis sees the larg-
expectation figure of 1.8%. est increase in employment in Victoria, which was up 13,600 persons, and the
largest slump deriving from the state of Queensland, which was down 13,700
The September quarter also brought through a decline of 1.4% in dwelling jobs over the month. Western Australia was the other state to experience a
investment, of which the fall was mainly influenced by New and Used decrease in employment in December, down by 7,900 persons. Unemploy-
Dwelling (-1.6%) and Alterations and additions (-1.0%). The ABS reported ment increased the most in New South Wales (up 0.3%) and Queensland (up
that poor weather partly influenced the decline. Nevertheless, annual growth 0.2%). Western Australia and South Australia experienced a decrease in un-
stood at 7.2% and Private sector residential building approvals up 9.4% employment rate, of 0.3% and 0.2% respectively.
from September quarter 2015 ($20.4billion in original current price term for
this quarter). Mining Investment fell 10.6% for the quarter, marking the
825,000 7.00
twelve consecutive quarterly declines in Australia. Non-mining investment
6.50
775,000
increased by 4.8%, which has been contributing to the positive increase set 6.00
725,000
5.50
since the March quarter of 2014. As noted by the ABS, Mining investment
675,000
Unemployment rate (%)
Unemployed persons
5.00
contributed 9.4% to GDP during its peak in December of 2012, and now has 625,000 4.50
fallen to 3.4%. Non-mining investment contribution in December 2012 was 575,000
4.00
3.50
7.5%, and has risen ever since to the current quarter’s contribution of 9.0%. 525,000
3.00
475,000
2.50
When we look at expenditure measures, Household final consumption 425,000 2.00
Sep-10
Mar-11
Sep-11
Mar-12
Sep-12
Mar-13
Sep-13
Mar-14
Sep-14
Mar-15
Sep-15
Mar-16
Sep-16
expenditure increased by 0.4% (Seasonally adjusted terms) over the Unemployed Persons Unemployment Rate
quarter, and 2.5% over the year. The ABS reported that this rise is attributed Source: ABS/Preston Rowe Paterson Research
Chart 6— Unemployment Persons and Unemployment Rate, September 2010 to September 2016 — Source: ABS
to an increase in spending in Hotels, cafes and restaurants (2.2%) and
Insurance and other financial services (1.3%). Over the period, Gross fixed
capital formation declined by 2.7%, Exports of goods and services
Unemployment Rate (%) Participation Rate (%)
increased by 0.3%, and Imports increased by 1.3% (all in seasonally
November December November December
adjusted terms). Australia 5.7 5.8 ▲ 64.6 64.7 ▲
25.00% 2.00% New South Wales 4.9 5.2 ▲ 63.4 63.5 ▲
1.80%
Quarterly Change in Dwelling and Non-Dwelling Investments
20.00% 1.60%
Victoria 6.0 6.0 ▬ 65.7 65.9 ▲
1.40%
15.00% 1.20%
1.00%
Queensland 6.0 6.2 ▲ 64.4 64.1 ▼
10.00% 0.80%
Quarterly Change in GDP
0.60% South Australia 7.0 6.8 ▼ 62.3 62.1 ▼
5.00% 0.40%
0.20% Western Australia 6.9 6.6 ▼ 67.9 67.3 ▼
0.00% 0.00%
-0.20% Tasmania 6.3 6.4 ▲ 59.8 59.8 ▬
-5.00% -0.40%
-0.60%
Northern Territory* 3.6 3.6 ▬ 75.9 77.3 ▼
-10.00% -0.80%
-1.00%
-15.00% -1.20% Australian Capital Territory* 3.7 3.7 ▬ 70.4 70.5 ▲
Dwelling Investment Non-Dwelling Construction Gross Domestic Product -1.40%
-20.00% -1.60%
Table 4— Unemployment Rate and Participation Rate, November vs. December 2016 — Source: ABS
Mar-11
Mar-14
Mar-15
Mar-16
Sep-10
Dec-10
Dec-11
Mar-12
Jun-11
Sep-11
Jun-12
Sep-12
Dec-12
Mar-13
Jun-13
Sep-13
Dec-13
Jun-14
Sep-14
Dec-14
Jun-15
Sep-15
Dec-15
Jun-16
Sep-16
* Trend figures used for NT and ACT as seasonally adjusted data both either are not publicly available
Source: RBA /Preston Rowe Paterson Research
Chart 5— Percentage Change in Dwelling, Non-Dwelling Investments and GDP— Source: ABS
Phone: +61 2 9292 7400
Fax: +61 2 9292 7404
Address: Level 14, 347 Kent Street Sydney NSW 2000
8
Email: research@prpsydney.com.au
Follow us: Visit www.prpsydney.com.au to follow us 8
© Copyright Preston Rowe Paterson NSW Pty Limited
10 Year Bond & 90 Day Bill Rate Interest Rates
The Reserve Bank kept interest rates unchanged for December at 1.50%,
Ten-year Australian government bond yields finished the calendar year at
after it dropped rates to historically low level in August. The decision to keep
2.79% for December, after a tumultuous year in the global bond market.
the cash rate on hold was influenced mainly by positive global growth from
This rate reflects a 0.29% increase from November, 0.81% increase from
advanced economies as well as Australia’s main Asian trading partners,
three months prior and a decline of 0.06% over the year from December
improvements in labour market conditions domestically and internationally,
2015.The ninety-day bank bill swap rate increased modestly by 0.02% over
improvement in Australia’s terms of trade as influenced by rising commodity
the month to 1.78%. This rate reflects an increase of 0.05% from three
prices and a well-functioning financial market. The bank did note that the
months prior and a decline of 0.56% from the previous year. After reaching
Australian economy is still in a transitional phase from the gains made from
an all-time low of 1.82% at the start of August, Australian bond yields have
the mining investment boom but highlight the expectation of an increase in
followed the path of the US Treasury yields as they increase sharply after
commodity exports towards 2017. Inflation remains below the Reserve Bank’s
the US Presidential election.
target of 2-3%, with the bank indicating that it will be some time until inflation
increases dramatically, as labour costs remain subdued. The Bank also
Other major economies around the world have experienced similar
targeted Australia’s labour force, noting growing trend of part time employment
increases in their sovereign bonds, though not to the extent of changes that
and a slow-down in overall employment growth.
have taken place in the US Bond market. The Reserve Bank did note that
even though changes in Treasury yields were large, they were not as large
5.0
as previously recorded movements in recent decades and are still at a
4.5
historical low. Furthermore, a rate increase from the US Federal Reserve in 4.0
Percentage (%)
December helped the yields to increase to 2.87% in mid-December, before 3.5
slowly settling down to 2.76% towards month-end. As a result of the 3.0
RBA Cash Rate
2.5
increase in yields, global and domestic borrowing costs have followed suit,
2.0
with Australian banks raising home loan rates by as much as 0.60% since
1.5
the US election. 1.0
Sep-12
Sep-13
Sep-14
Sep-15
Sep-16
Mar-12
Jun-12
Mar-13
Jun-13
Mar-14
Jun-14
Mar-15
Jun-15
Mar-16
Jun-16
Dec-12
Dec-14
Dec-16
Dec-11
Dec-13
Dec-15
5.00 Source: RBA /Preston Rowe Paterson Research
4.50 Chart 8— Movement of the Cash Rate from December 2011 to Present— Source: RBA
4.00
Exchange Rate
3.50
According to figures collated from the RBA, the Australian Dollar depreciated
Percentage (%)
3.00
against most major currencies over the month of December, except for the
2.50
Japanese Yen. Notably, there was a depreciation in the Australian Dollar of
2.00
3.2% over the month against the US Greenback, with $AUD1 buying $USD0.75
1.50
in November, and dropping to $USD0.72 in December. December’s figure also
1.00
signifies a depreciation of 5.2% from September, when the exchange rate was
Dec-11
Mar-12
Sep-12
Dec-12
Mar-13
Sep-13
Dec-13
Mar-14
Sep-14
Mar-15
Sep-15
Dec-15
Mar-16
Dec-16
Jun-12
Jun-13
Jun-14
Dec-14
Jun-15
Jun-16
Sep-16
Source: RBA /Preston Rowe Paterson Research 10 Yr Bond 90 Day Bill Cash Rate at $USD0.76. The Dollar also depreciated against the British Pound, declining
Chart 7— Movement of 90-day Bill, 10-year bond yields and Cash rate from December 2011 to Dec 2016– 1.6% over the month from £0.60 in November to £0.59 in December. There was
MONTHLY– Source: RBA
a depreciation of 2.2% over the month against the Euro, declining from €0.70 in
November to €0.69 in December. In contrast, the Australian Dollar performed
better against the Japanese Yen, appreciating a slight 0.3% from ¥84.23 in
November to ¥84.47 in December.
Phone: +61 2 9292 7400
Fax: +61 2 9292 7404
Address: Level 14, 347 Kent Street Sydney NSW 2000
9
Email: research@prpsydney.com.au
Follow us: Visit www.prpsydney.com.au to follow us 9
© Copyright Preston Rowe Paterson NSW Pty LimitedOur Research We have all types of plant & machinery
covered
At Preston Rowe Paterson, we pride ourselves on the research
which we prepare in the market sectors within which we operate. We regularly undertake valuations of all forms of plant, machinery,
These include Commercial, Retail, Industrial, Hotel & Leisure and furniture, fittings and equipment including:
Residential property markets as well as infrastructure, capital and
plant and machinery markets · Mining & earth moving equipment/road plant
· Office fit outs, equipment & furniture
We have property covered · Agricultural machinery & equipment
· Heavy, light commercial & passenger vehicles
· Investment · Industrial manufacturing equipment
· Development · Wineries and processing plants
· Asset · Special purpose plant, machinery & equipment
· Corporate Real Estate · Extractive industries, land fills and resource based enterprises
· Mortgage · Hotel furniture, fittings & equipment
· Government
· Insurance We have all client profiles covered
· Occupancy
· Sustainability Preston Rowe Paterson acts for an array of clients with all types of
· Research real estate, plant, machinery and equipment interests such as:
· Real Estate Investment Valuation
· Real Estate Development Valuation · Accountants
· Property Consultancy and Advisory · Banks, finance companies and lending
· Transaction Advisory institutions
· Property and Asset Management · Commercial and Residential non bank lenders
· Listed Fund, Property Trust, Super Fund · Co-operatives
· and Syndicate Advisors · Developers
· Plant & Machinery Valuation · Finance and mortgage brokers
· General and Insurance Valuation · Hotel owners and operators
· Economic and Property Market Research · Institutional investors
· Insurance brokers and companies
We have all real estate types covered · Investment advisors
· Lessors and lessees
We regularly provide valuation, property and asset management, · Listed and private companies corporations
consultancy and leasing services for all types of real estate including: · Listed Property Trusts
· Local, State and Federal Government Departments and
· CBD and Metropolitan commercial office buildings Agencies
· Retail shopping centres and shops · Mining companies
· Industrial, office/warehouses and factories · Mortgage trusts
· Business parks · Overseas clients
· Hotels (accommodation) and resorts · Private investors
· Hotels (pubs), motels and caravan parks · Property Syndication Managers
· Residential development projects · Rural landholders
· Residential dwellings (individual houses and apartments/units) · Self managed super funds
· Rural properties · Solicitors and barristers
· Special purpose properties such as: nursing homes; private · Sovereign wealth funds
hospitals, service stations, oil terminals and refineries, theatre · Stock brokers
complexes; etc. · Trustee and Custodial companies
· Infrastructure including airports and port facilities
Phone: +61 2 9292 7400
Fax: +61 2 9292 7404
Address: Level 14, 347 Kent Street Sydney NSW 2000
10
Email: research@prpsydney.com.au
Follow us: Visit www.prpsydney.com.au to follow us 10
© Copyright Preston Rowe Paterson NSW Pty LimitedWe have all locations covered About This Report
From our capital city and regional office locations we serve our client’s Preston Rowe Paterson prepare standard research reports covering
needs throughout Australia. Globally, we operate directly or via our the main markets within which we operate in each of our capital cities
relationship offices or special purpose real estate asset classes, and major regional locations.
infrastructure and plant & machinery.
Within this report we analysed the sales, leases and developments
over the past six months to the reported quarter in various NSW
We have your needs covered locations of retail property categorized as; city centre, super-regional
Our clients seek our property (real estate, infrastructure, plant and centre, major regional centre, regional centre, sub-regional centre and
machinery) services for a multitude of reasons including: neighbourhood centre.
· Acquisitions & Disposals
· Alternative use & highest and best use analysis To compile the research report we have considered the most recently
· Asset Management available statistics from known sources. Given the manner in which
· Asset Valuations for financial reporting to meet ASIC, AASB, IFRS & statistics are complied and published they are usually 3-6 months out
IVSC guidelines of date at the time we analyse them. Where possible we consider short
· Compulsory acquisition and resumption term movement in the statistics by looking at daily published data in the
· Corporate merger & acquisition real estate due diligence financial press. Where this shows notable fluctuation, when compared
· Due Diligence management for acquisitions and sales to the formal published numbers we have commented accordingly.
· Facilities management
· Feasibility studies
· Funds management advice & portfolio analysis
· Income and outgoings projections and analysis
· Insurance valuations (replacement & reinstatement costs)
· Leasing vacant space within managed properties
· Listed property trust & investment fund valuations & revaluations
· Litigation support
· Marketing & development strategies
· Mortgage valuations
· Property Management
· Property syndicate valuations and re-valuations
· Rating and taxing objections
· Receivership, Insolvency and liquidation valuations and support/
advice
· Relocation advice, strategies and consultancy
· Rental assessments and determinations
· Sensitivity analysis
· Strategic property planning
Phone: +61 2 9292 7400
Fax: +61 2 9292 7404
Address: Level 14, 347 Kent Street Sydney NSW 2000
11
Email: research@prpsydney.com.au
Follow us: Visit www.prpsydney.com.au to follow us 11
© Copyright Preston Rowe Paterson NSW Pty LimitedHead Office (Sydney) Regional Offices Swan hill
Level 14, 347 K ent St reet Ian Boyd-Law
Albury Wodonga
Sydney NSW 2000 M: 0418 5980232
Michael Redfern
PO BOX 4120, Sydn ey NSW 2001 M: 0428 235 588 E: ian.boyd-law @prp.com.au
P: 02 9292 7400 E: michael.redfern@prp.com.au
F: 02 9292 7404 Tamworth
Ballarat Bruce Sharrock
E: res earch@prps ydney.com.au
Darren Evans M: 0429 465 012
National Directors M: 0417 380 324 E: bruce.s harrock@prp.com.au
E: darren.evans @prp.com.au Matt Spencer
Gregory Preston Peter Murphy M: 0447 227 002
M: 0408 622 400 M: 0402 058 775 E: matt.s pencer@prp.com.au
E: greg.pres t on@prps ydney.com.au E: pet er.murphy@prp.com.au
Wagga Wagga
Gregory Rowe Bendigo Dan Hogg
M: 0411 191 179 Damien Jerinic M: 0408 585 119
E: greg.row e@prps ydney.com.au M: 0409 820 623 E: daniel.hogg@prp.com.au
Neal Ellis E: damien.jerinic@prp.com.au
Warrnambool
M: 0417 053 116 Central Coast/Gosford Stuart McDonald
E: neal.ellis @prp.com.au Colin Pugsley M: 0405 266 783
Damian Kininmonth M: 0435 376 630 E: stuart.mcdonald@prp.com.au
M: 0417 059 836 E: colin.pugs ley@prp.com.au
E: damian.kininmont h@prp.com.au Dubbo
Greg Sugars James Skuthorp New Zealand Offices
M: 0435 911 465 M: 0409 466 779
E: james.s kuthorp@prp.com.au Head Office (Auckland)
E: greg.s ugars @prp.com.au
Tom Needham Greg Sugars
www.prp.com.au M: 0412 740 093 M: + 64 ( 0)27 777 9010
E: t om.needham@prps ydne y.com.au E: greg.s ugars @prpnz.nz
Mitchell Stubbs
Geelong
M: + 64 ( 0)27 774 34100
Gareth Kent
E: mit chell.st ubbs @prpnz.nz
M: 0413 407 820
E: garet h.kent @prp.com.au Dunedin
Stuart Mcdonald James Stowell
M: 0405 266 783 M: + 64 ( 0)17 807 3866
Capital City Offices E: stuart.mcdonald@prp.com.au E: james.st ow ell@prpnz.nz
Adelaide Gippsland Greymouth
Rob Simmons Tim Barlow Mark Bollard
M: 0418 857 555 M: 0400 724 444 M: + 64 ( 0)27 694 7041
E: adelaide@ prp.com.au E: t im.barlow @prp.com.au E: mark.bollard@prpnz.nz
Alexandra Ellis
Brisbane Tauranga
M: 0407 724 444
Troy Chaplin Alex Haden
M: 0419 029 045 E: alex.ellis @prp.com.au
M: + 64 ( 0)21 833 118
E: t roy.chaplin@prpque ens land.com.au Griffith E: alex.haden@prpn z.nz
Hobart Dan Hogg
M: 0408 585 119
Damien Taplin
E: daniel.hogg@prp.com.au
www.prpnz.nz
M: 0418 513 003
E: damien.t aplin@prp.com.au Horsham
Shelley Taplin Ben Sawyer Asian Offices
M: 0413 309 895 M: 0429 826 541
E: s helley.t aplin@prp.com.au E: ben.s aw yer@prp.com.au
Associated office networks throughout:
China
Melbourne Launceston
Hong K ong
Neal Ellis Damien Taplin
M: 0417 053 116 M: 0418 513 003 Japan
E: neal.ellis @prp.com.au E: damien.t aplin@prp.com.au Philippines
Damian Kininmonth Thailand
Mornington
M: 0417 059 836
Neal Ellis
E: damian.kininmont h@prp.com.au M: 0417 053 116
Preston Rowe Paterson Australasia Pty Ltd
Perth E: neal.ellis @prp.com.au
ACN: 060 005 807
Cameron Sharp Damian Kininmonth
The informat ion provided w it hin t his publicat ion s hould be
M: 0438 069 103 M: 0417 059 836
regarded s olely as a general guide. W e believe that t he
E: cameron.s harp@prp.com.au E: damian.kininmont h@prp.com.au
informat ion herein is accurat e how ever no w arrant y of
Sydney Mount Gambier accuracy or reliabilit y is given in relat ion t o any
Gregory Preston Stuart McDonald informat ion cont ained in this publicat ion. Nor is any
M: 0408 622 400 M: 0405 2660783 res pons ibilit y for any los s or damage w hats oever aris ing in
E: greg.pres t on@prps ydney.com.au E: stuart.mcdonald@prp.com.au any w ay for any repres ent at ion, act or omission, w het her
Gregory Rowe Newcastle expres s ed or implied ( including res ponsibilit y t o any
M: 0411 191 179 pers on or ent it y by re as on of negligence) acce pt ed by
Robert Dupont
E: greg.row e@prps ydney.com.au Prest on Row e Pat ers on Aust ralasia Pt y Lt d or any of its
M: 0418 681 874
E: bob.dupont @prp.com.au as s ociat ed offices or any officer, agent or employee of
Affiliat e offices in Canberra, Darw in and ot her regional Prest on Row e Pat ers on Aust ralas ia Pt y Limit ed.
areas. David Rich
M: 0413 052 166
E: david.rich@prpncle.com.au
Southport
Ian Hawley
M: 0458 700 272
E: ian.hawley@prpqueens land.com.au
Troy Chaplin
M: 0419 029 045
E: t roy.chaplin@prpque ens land.com.au
Phone: +61 2 9292 7400
Fax: +61 2 9292 7404
Address: Level 14, 347 Kent Street Sydney NSW 2000
12
Email: research@prpsydney.com.au
Follow us: Visit www.prpsydney.com.au to follow us 12
© Copyright Preston Rowe Paterson NSW Pty LimitedYou can also read