Synergistic enhancement of urban haze by nitrate uptake into transported hygroscopic particles in the Asian continental outflow
←
→
Page content transcription
If your browser does not render page correctly, please read the page content below
Atmos. Chem. Phys., 20, 7575–7594, 2020
https://doi.org/10.5194/acp-20-7575-2020
© Author(s) 2020. This work is distributed under
the Creative Commons Attribution 4.0 License.

Synergistic enhancement of urban haze by nitrate uptake
into transported hygroscopic particles in the
Asian continental outflow
Jihoon Seo1,2 , Yong Bin Lim3 , Daeok Youn4 , Jin Young Kim1 , and Hyoun Cher Jin1
1 Environment, Health and Welfare Research Center, Korea Institute of Science and Technology, Seoul, 02792, South Korea
2 Schoolof Earth and Environmental Sciences, Seoul National University, Seoul, 08826, South Korea
3 Department of Chemical Engineering and Material Science, Ewha Womans University, Seoul, 03760, South Korea
4 Department of Earth Science Education, Chungbuk National University, Cheongju, 28644, South Korea

Correspondence: Jin Young Kim (jykim@kist.re.kr)

Received: 18 December 2019 – Discussion started: 6 February 2020
Revised: 21 May 2020 – Accepted: 3 June 2020 – Published: 30 June 2020

Abstract. Haze pollution is affected by local air pollutants,   NH3 -rich urban areas. This study reveals the synergistic ef-
regional transport of background particles and precursors,      fect of remote and local sources on urban haze pollution in
atmospheric chemistry related to secondary aerosol forma-       the downwind region and provides insight into the nonlinear-
tion, and meteorological conditions conducive to physical,      ity of domestic and foreign contributions to receptor PM2.5
dynamical, and chemical processes. In the large, populated      concentrations in numerical air quality models.
and industrialized areas like the Asian continental outflow
region, the combination of regional transport and local stag-
nation often exacerbates urban haze pollution. However, the
detailed chemical processes underlying the enhancement of       1   Introduction
urban haze induced by the combined effect of local emissions
and transported remote pollutants are still unclear. Here, we   Fine particulate matter (under 2.5 µm in diameter; PM2.5 )
demonstrate an important role of transported hygroscopic        in urban areas consists of inorganic species (SO2−          −
                                                                                                                    4 , NO3 ,
                                                                          +
particles in increasing local inorganic aerosols, by studying   and NH4 ) and organic matter (OM) produced by the gas-
the chemical composition of PM2.5 collected between Octo-       to-particle conversion of anthropogenic and biogenic precur-
ber 2012 and June 2014 in Seoul, a South Korean megac-          sors (Seinfeld and Pandis, 2016). These particles pose a pub-
ity in the Asian continental outflow region, using the ISOR-    lic health problem due to their adverse effects on the human
ROPIA II thermodynamic model. PM2.5 measured under the          respiratory and cardiovascular systems (Pope and Dockery,
condition of regional transport from the upwind source ar-      2006). Consequently, many countries have tried to mitigate
eas in China was higher in mass concentration and richer        urban haze pollution by reducing local precursor emissions
in secondary inorganic aerosol (SIA) species (SO2−         −
                                                    4 , NO3 ,   (van der A et al., 2017; Kim and Lee, 2018). However, since
         +
and NH4 ) and aerosol liquid water (ALW) compared to that       air pollution is also influenced by transported air pollutants,
measured under non-transport conditions. The secondary in-      it is difficult to achieve improved air quality in megacities
organic species and ALW were both increased, particularly       located in large, populated, and industrialized areas by con-
in cases with high PM2.5 levels, and this indicates inorganic   trolling local emissions (Seo et al., 2018). Synoptic weather
species as a major driver of hygroscopicity. We conclude that   conditions cause stagnation and long-range transport that can
the urban haze pollution in a continental outflow region like   lead to the accumulation of particles and gaseous precur-
Seoul, particularly during the cold season, can be exacer-      sors from local and remote sources. It can also change local
bated by ALW in the transported particles, which enhances       meteorological factors to favorable conditions for secondary
the nitrate partitioning into the particle phase in NOx - and   aerosol production, such as photo-oxidation and aqueous-

Published by Copernicus Publications on behalf of the European Geosciences Union.
7576                               J. Seo et al.: Synergistic haze enhancement by nitrate uptake into transported particles

phase processing (Sun et al., 2014; Zheng et al., 2015; Seo        linear interactions between local emissions and transported
et al., 2017). Therefore, a better understanding of the com-       pollutants.
bined effects of local emissions, regional transport, and me-         In this study, we explore the combined effects of local and
teorological conditions on urban haze pollution is required to     remote sources, ALW and particle pH, and meteorological
establish appropriate mitigation strategies.                       factors on the formation and growth of urban haze particles,
    One key aerosol component that affects the formation           based on daily measurement of PM2.5 chemical compositions
and growth of haze particles is aerosol liquid water (ALW),        in Seoul, backward trajectory analysis, and the ISORROPIA
which is ubiquitous and abundant in tropospheric fine parti-       II thermodynamic model (Fountoukis and Nenes, 2007). Dif-
cles (Nguyen et al., 2016). ALW not only increases the mass        ferent chemical compositions and characteristics of Seoul
of secondary organic aerosols (SOAs) by facilitating the par-      haze according to the regional transport from China and the
titioning of gas-phase water-soluble OM into the condensed         local stagnation in the Seoul metropolitan area is investigated
phase, followed by aqueous-phase reactions (Asa-Awuku et           from the perspective of inorganic partitioning and water up-
al., 2010; Carlton and Turpin, 2013; McNeill, 2015; Marais         take processes. An effective strategy for PM2.5 reduction in
et al., 2016), but it also enhances the secondary inorganic        Seoul is further discussed using ambient NOx and NH3 lev-
aerosol (SIA) mass via nitrate formation through HNO3 up-          els and analytic calculation of the HNO3 –NO−   3 partitioning
take and N2 O5 hydrolysis (Zhang et al., 2015; Wang et al.,        ratio as a function of ALW, pH, and temperature.
2017) and via sulfate production through the aqueous oxida-
tion of SO2 (Cheng et al., 2016; Wang et al., 2017). Stud-
ies of urban haze in the North China Plain reported a si-          2     Data and methods
multaneous elevation of the relative humidity (RH), ALW,
and SIA, which indicates the hygroscopic properties of in-         2.1    Measurements and chemical analysis
organic species and the role of ALW in mass transfer into
the particles (Liu et al., 2017; Tie et al., 2017; Wu et al.,      Daily PM2.5 sampling was conducted on 210 days between
2018). Combined with the ambient temperature and particle          October 2012 and June 2014 at the Korea Institute of Sci-
pH, ALW is critical for gas–particle partitioning of inorganic     ence and Technology (KIST) site in northeastern Seoul
and water-soluble organic acid gases (Guo et al., 2018; Nah        (37.603◦ N, 127.047◦ E; 58 m above sea level; Fig. S1).
et al., 2018). Therefore, regional transport of wet particles to   PM2.5 samples for determining inorganic and carbonaceous
the precursor-rich urban environment will affect haze pollu-       species were collected on 47 mm Teflon filters (Pall Corpo-
tion downwind.                                                     ration, Port Washington, NY, USA) with a Teflon-coated alu-
    The South Korean capital city of Seoul and its metropoli-      minum cyclone (URG Corporation, Chapel Hill, NC, USA)
tan area is one of the highly populated megacities in East         at a flow rate of 16.7 L min−1 and on 203 × 254 mm quartz
Asia, with a population of 25 million people, 9 million ve-        fiber filters (Whatman, Maidstone, UK) with a high-volume
hicles, and nearly half of the national gross domestic prod-       air sampler (flow rate of 1000 L min−1 ; Andersen Instru-
uct, and it has suffered from episodic haze events, partic-        ments, Atlanta, GA, USA), respectively.
ularly during the cold season (Seo et al., 2017, 2018). Al-            The concentrations of inorganic ions (SO2−        −
                                                                                                                 4 , NO3 , Cl ,
                                                                                                                               −
                                                                        +     +    2+     +           2+
though the Seoul metropolitan area is a large anthropogenic        NH4 , K , Ca , Na , and Mg ) were measured using
emission source of nitrogen oxides (NOx ), ammonia (NH3 ),         a 2000i/SP ion chromatograph (Dionex, Sunnyvale, CA,
and volatile organic compounds (VOCs) (NIER, 2018), the            USA) after sonicating the Teflon filter sample for 30 min
effect of transported air pollutants from China cannot be          in a mixture of 0.5 mL of ethanol and 14.5 mL of dis-
ignored, because of its location downwind from the major           tilled deionized water. Using a piece of the quartz fiber fil-
emission source region in China like the North China Plain         ter sample (10 × 15 mm), the concentrations of organic car-
and Yangtze River Delta (Fig. S1 in the Supplement). In par-       bon (OC) and elemental carbon (EC) were measured using
ticular, severe multiday haze events in the Seoul metropoli-       a thermal–optical carbon aerosol analyzer (Sunset Labora-
tan area mostly occur with a specific synoptic pattern, such       tory, Tigard, OR, USA) based on National Institute for Oc-
as an eastward-moving high-pressure system, which induces          cupational Safety and Health (NIOSH) method 5040 (Birch
regional transport of air pollutants from China and, subse-        and Cary, 1996). We also identified 17 n-alkanes (C20 –C36 ),
quently, local stagnation (Seo et al., 2017, 2018). Therefore,     15 polycyclic aromatic hydrocarbons (PAHs; C14 –C24 ), 19
the haze pollution in Seoul becomes severe primarily by the        monocarboxylic acids (C6 –C20 ), 19 dicarboxylic acids (C3 –
accumulation of local and transported air pollutants. How-         C11 ), and 10 sugars (C5 –C6 and C12 ) using the extract from
ever, a recent numerical modeling study on regional contribu-      one half of the quartz fiber filter sample and a 7890A gas
tion to the particulate concentration in Seoul reported a dis-     chromatograph (Hewlett Packard, Palo Alto, CA, USA) cou-
crepancy between responses to the reduction in domestic and        pled to a 5975C mass selective detector (Agilent, Santa
foreign emissions (Kim et al., 2017), and this implies addi-       Clara, CA, USA). The OM/OC ratios derived from the mea-
tional production and growth of local haze particles by non-       sured OM and OC concentrations were used to estimate the
                                                                   total OM concentration. The organic compounds identified

Atmos. Chem. Phys., 20, 7575–7594, 2020                                             https://doi.org/10.5194/acp-20-7575-2020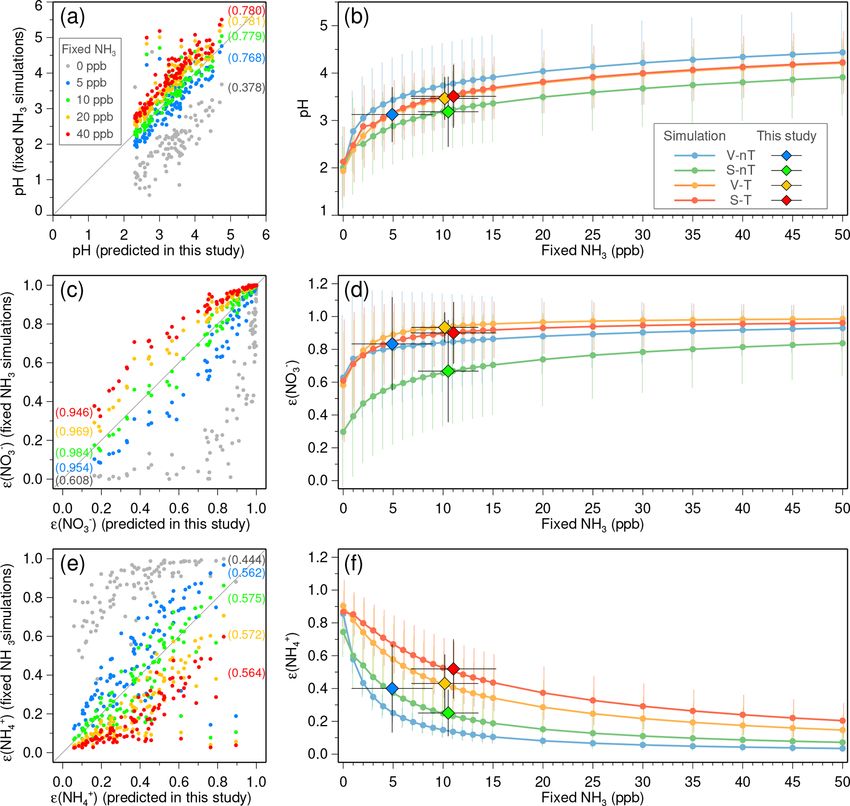
J. Seo et al.: Synergistic haze enhancement by nitrate uptake into transported particles                                    7577

in this study constitute ∼ 5 % of the total OM. The analytical     and the two source areas in China (tCHN ). The daily average
procedures used herein are described in detail elsewhere (Seo      residence time in each area shows different source charac-
et al., 2017; Kim et al., 2018). In this study, out of 210 sam-    teristics such as the smaller sulfur-to-nitrogen emission ratio
pling days, 118 daily data that include not only inorganic         in Seoul (∼ 0.06; 4.5 kt of SOx and 71.1 kt of NOx in 2010;
species but also OM based on the identified organic com-           NIER, 2018) compared with that of the Jing–Jin–Ji region in
pounds’ information were selected and utilized (Fig. S2).          the North China Plain (∼ 0.71; 2010 kt of SO2 and 2830 kt
    Note that the PM2.5 sampling on a Teflon filter for inor-      of NOx in 2010; Li et al., 2017). For example, tCHN is highly
ganic ions was conducted without either a denuder or backup        correlated not only with particulate SO2−            −
                                                                                                             4 and NO3 concen-
filters, and thus there could be potential sampling artifacts      trations but also with their precursor (SO2 and NO2 ) concen-
in the results, particularly negative artifacts in semi-volatile   trations, while tSMA has statistically significant correlation
ammonium nitrate (Ashbaugh and Eldred, 2004; Chow et al.,          only with NO2 concentration (Fig. S4).
2005). Nie et al. (2010) reported that summertime nitrate loss        Since the medians of both tSMA (for all measurement days)
on a Teflon filter from the un-denuded filter sampling with-       and tCHN (for the measurement days with tCHN 6 = 0 h) were
out backup filters is ∼ 75 % at lower nitrate concentrations       ∼ 6 h, we applied 6 h as a reference trajectory residence time
(< 10 µg m−3 ) but only ∼ 10 % at higher nitrate concentra-        to categorize daily measurement data into relatively stronger
tions (> 10 µg m−3 ) due to the formation of particle cake.        and weaker influences through the local stagnation in the
Considering small evaporative loss in the cold season and          Seoul metropolitan area (with tSMA ) and the regional trans-
the high nitrate concentration in Seoul, we expected small to      port from China (with tCHN ). The measurement days were
moderate sampling errors in this study. Sensitivity tests con-     classified into one of four groups and summarized in Table 1:
sidering potential ammonium nitrate loss from the filter sam-      (i) “local ventilation with no regional transport” (V-nT), in
ples show that the assumption of 20 % nitrate loss for the high    which the trajectories did not originate from the source areas
concentrations with low-temperature groups and 50 % nitrate        in China and were also not stagnant in the Seoul metropolitan
loss for the low concentrations with moderate-temperature          area (tSMA < 6 h and tCHN = 0 h; n = 9 d); (ii) “local stagna-
groups does not change our conclusion (Fig. S3).                   tion with no regional transport” (S-nT), in which the trajec-
    The hourly concentrations of SO2 , NO2 , CO, O3 , and          tories did not originate from the source areas in China but
PM10 at 34 air quality monitoring sites in Seoul (Fig. S1)         were stagnant in the Seoul metropolitan area (tSMA ≥ 6 h and
provided by the Korea Ministry of Environment were av-             tCHN = 0 h; n = 15 d); (iii) “local ventilation with regional
eraged over all sites for each day to obtain representative        transport” from the Chinese source area (V-T), in which the
daily concentrations of each species for Seoul (Korea Envi-        trajectories originated from the source areas in China but
ronment Corporation, 2019). The hourly meteorological data         were not stagnant in the Seoul metropolitan area (tSMA < 6 h
of temperature, RH, wind speed, and solar irradiance at the        and tCHN ≥ 6 h; n = 15 d); and (iv) “local stagnation with
Seoul weather station (37.571◦ N, 126.966◦ E) managed by           regional transport” from the Chinese source area (S-T), in
the Korea Meteorological Administration (KMA) were av-             which the trajectories originated from the source areas in
eraged for each day and used in our analysis (KMA, 2019).          China and were also stagnant in the Seoul metropolitan area
Boundary layer height (BLH) was derived from the Euro-             (tSMA ≥ 6 h and tCHN ≥ 6 h; n = 21 d). The trajectory density
pean Centre for Medium-Range Weather Forecasts Reanal-             distribution in the North China Plain and Yangtze River Delta
ysis Interim (ERA-Interim) data (Dee et al., 2011; http://         areas were characterized for each group, with few trajectories
apps.ecmwf.int/datasets/data/interim-full-daily/, last access:     for the no regional-transport (V-nT and S-nT) groups but rel-
23 October 2019) at a grid point in Seoul (37.5◦ N, 127.0◦ E).     atively dense trajectories for the regional-transport (V-T and
                                                                   S-T) groups (Fig. 1b–d).
2.2   Categorization of measurements                                  Despite the various potential factors like emissions, atmo-
                                                                   spheric chemistry, and meteorology that can affect the gas
To categorize the daily measurements according to (1) local        and particulate air quality, the simple categorization accord-
atmospheric conditions (stagnation or ventilation) and (2) re-     ing to the residence time of backward trajectories could re-
gional impact (transport of pollutants from upwind source          veal different characteristics in chemical species and meteo-
area), we used the 72 h backward trajectories from 500 m           rological factors associated with the local stagnation and the
above the sampling site, obtained with the Hybrid Single-          regional transport of air pollutants. For example, the average
Particle Lagrangian Integrated Trajectory (HYSPLIT) model          concentrations of primary gaseous pollutants (SO2 , NO2 , and
(https://ready.arl.noaa.gov; Stein et al., 2015) for every hour    CO) of the “local stagnation with regional transport” (S-T)
of each measurement day. We defined a local source area            group are significantly higher than those of the “local stag-
(Seoul metropolitan area) and two major upwind source ar-          nation with no regional transport” (S-nT) group (p ≤ 0.001),
eas in China (North China Plain and Yangtze River Delta)           although average local meteorological factors between the
based on the satellite tropospheric NO2 column density dis-        two groups do not show significant differences (Table 2 and
tribution (Fig. 1a) and calculated the average residence time      Figs. 2 and 3). On the other hand, the lower wind speed
of daily 24 trajectories in the Seoul metropolitan area (tSMA )    and shallower BLH were seen in the local stagnation (S-T

https://doi.org/10.5194/acp-20-7575-2020                                            Atmos. Chem. Phys., 20, 7575–7594, 2020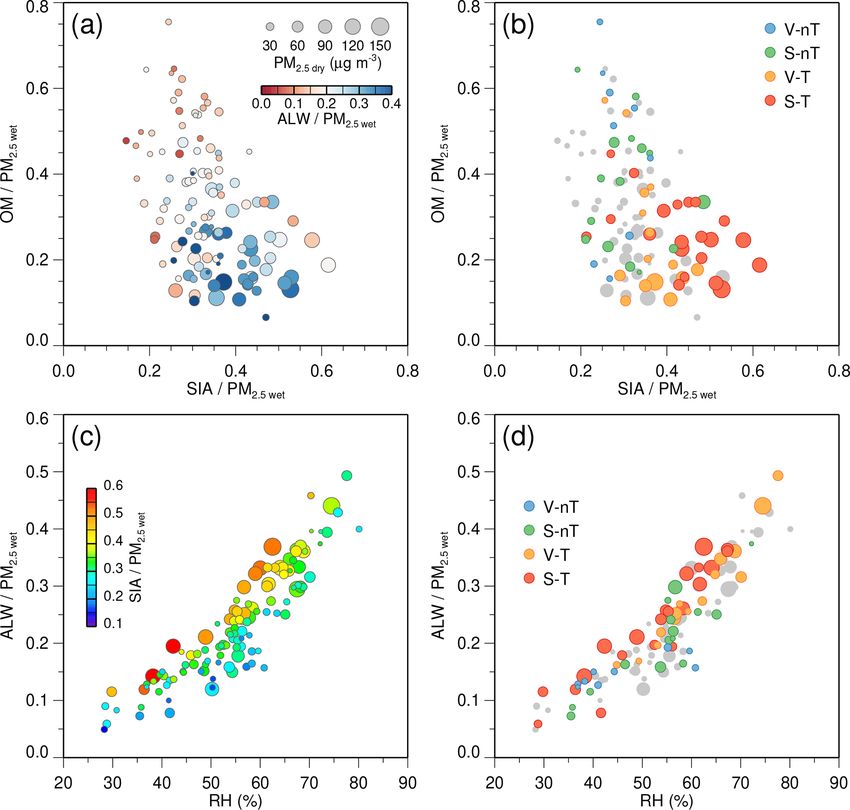
7578                                   J. Seo et al.: Synergistic haze enhancement by nitrate uptake into transported particles

Figure 1. (a) Tropospheric NO2 column density obtained from the Ozone Monitoring Instrument (OMI) onboard the EOS-Aura satellite,
averaged for 2012–2014, and the major anthropogenic emission areas defined in this study (North China Plain, NCP: 33–41◦ N, 112–
121◦ E; Yangtze River Delta, YRD: 30–33◦ N, 117–122◦ E; and Seoul metropolitan area, SMA; 36.5–38.5◦ N, 126–128◦ E). (b–e) Trajectory
frequency (number of endpoints in each 1◦ ×1◦ grid cell per number of trajectories, %) derived from the HYSPLIT 72 h backward trajectories
obtained 500 m above the Korea Institute of Science and Technology (KIST) site and average chemical compositions of particulate matter
under 2.5 µm in diameter (PM2.5 ) for the (b) “local ventilation with no regional transport” (V-nT) group, (c) “local stagnation with no regional
transport” (S-nT) group, (d) “local ventilation with regional transport” (V-T) group, and (e) “local stagnation with regional transport” (S-T)
group. Seoul is marked with a solid red circle.

Table 1. List of four categorized groups of daily PM2.5 measurements in this study.

       Categories                                       Acronyms     Trajectory residence time in the     Trajectory residence time in the
                                                                     Chinese source area (tCHN )          Seoul metropolitan area (tSMA )
       “local ventilation with no regional transport”   V-nT         tCHN = 0 h                           tSMA < 6 h
       “local stagnation with no regional transport”    S-nT         tCHN = 0 h                           tSMA ≥ 6 h
       “local ventilation with regional transport”      V-T          tCHN ≥ 6 h                           tSMA < 6 h
       “local stagnation with regional transport”       S-T          tCHN ≥ 6 h                           tSMA ≥ 6 h

and S-nT) groups compared with the local-ventilation (V-T                  2.3    Prediction of ALW content and pH
and V-nT) groups (Fig. 2), and the “local stagnation with
regional transport” (S-T) group shows significantly higher
levels of SO2 , NO2 , and CO in comparison with the “lo-                   The ISORROPIA II thermodynamic model was run in for-
cal ventilation with regional transport” (V-T) group, proba-               ward mode to estimate ALW content associated with inor-
bly related to accumulation in the stagnant condition. Note                ganic species, pH, and the equilibrium gas–particle partition-
that although the present study used a part of total daily                 ing based on the daily PM2.5 ionic compositions, RH, and
data for which OM concentrations are available (n = 118),                  temperature. ISORROPIA II uses total (gas- plus aerosol-
composite averages and differences in meteorological vari-                 phase) measurements as inputs, under the metastable as-
ables and air pollutant concentrations among the four cate-                sumption (no solid precipitates). Recent validation studies
gorized groups using the total daily data including the OM-                demonstrate that the forward mode is influenced less by mea-
unavailable dates (n = 210) showed the same characteristics                surement errors and gives a more accurate pH than the re-
as shown in Figs. 2 and 3 (Fig. S5).                                       verse mode, which uses only the aerosol-phase composition
                                                                           as an input (Hennigan et al., 2015; Song et al., 2018).
                                                                              The forward mode of ISORROPIA II requires the total
                                                                           NH3 (gas-phase NH3 plus particulate NH+        4 ), total HNO3
                                                                           (HNO3 plus particulate NO−   3 ), and total Cl  (gas-phase HCl

Atmos. Chem. Phys., 20, 7575–7594, 2020                                                       https://doi.org/10.5194/acp-20-7575-2020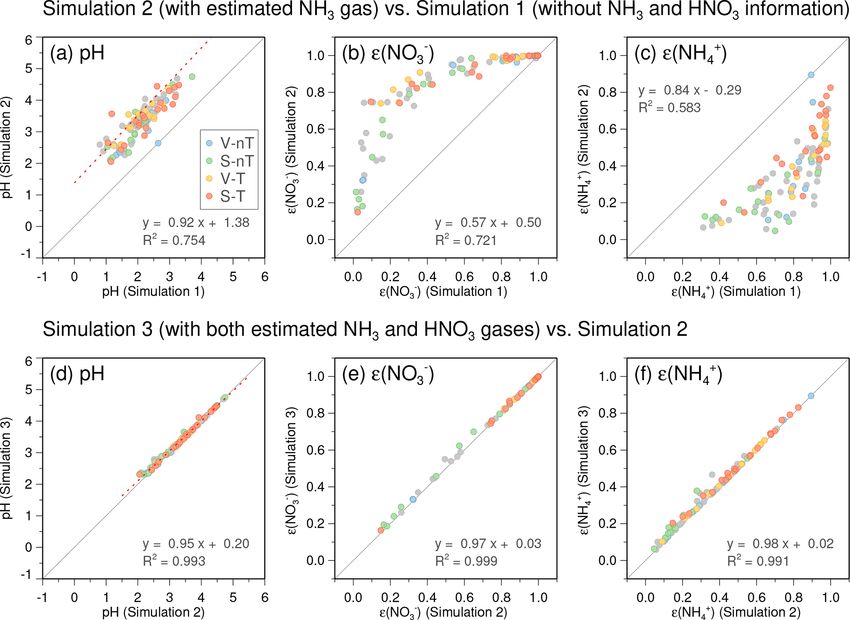
J. Seo et al.: Synergistic haze enhancement by nitrate uptake into transported particles                                                                                7579

Table 2. The average and standard deviation of PM2.5 chemical composition, meteorological factors, related gas concentrations, thermody-
namic model results and gas-particle partitioning ratios, and mass concentration ratios to wet PM2.5 (PM2.5 wet ) for the “local ventilation
with no regional transport” (V-nT) group, the “local stagnation with no regional transport” (S-nT) group, the “local ventilation with regional
transport” (V-T) group, and the “local stagnation with regional transport” (S-T) group and p values derived from Welch’s t test for the
composite differences between the S-T and S-nT groups and between the S-T and V-T groups.

     Components                                                   Composite average and                                               p values from
                                                                    standard deviation                                                Welch’s t test
                          Units                      (V-nT)           (S-nT)             (V-T)             (S-T)      (S-T) minus (S-nT)         (S-T) minus (V-T)
                                                    (n = 9)         (n = 15)          (n = 15)          (n = 21)        (transport effect)       (stagnation effect)
     Meteorological factors
     T                    (◦ C)                2.6 ± 13.2       15.2 ± 11.5          9.4 ± 6.0        9.3 ± 8.5                  p = 0.104                 p = 0.967
     RH                   (%)                 45.9 ± 10.0       53.5 ± 10.2         61.0 ± 9.3      51.8 ± 11.7                  p = 0.632                 p = 0.013
     WS                   (m s−1 )              3.5 ± 0.7         2.4 ± 0.6          3.2 ± 0.9        2.4 ± 0.7                  p = 0.824                 p = 0.009
     SI                   (W m−2 )              167 ± 41          172 ± 53           154 ± 64         137 ± 67                   p = 0.094                 p = 0.445
     BLHa                 (m)                  770 ± 177         550 ± 210          666 ± 277        457 ± 165                   p = 0.165                 p = 0.016
     Gaseous species
     SO2                  (ppb)                 4.6 ± 0.6         5.2 ± 2.0         6.6 ± 2.2         8.8 ± 2.7                  p < 0.001                 p = 0.012
     NO2                  (ppb)                27.4 ± 4.1       41.6 ± 11.7        41.2 ± 9.5       57.3 ± 12.5                  p < 0.001                 p < 0.001
     CO                   (ppm)               0.42 ± 0.05       0.55 ± 0.26       0.66 ± 0.28       0.89 ± 0.31                  p = 0.001                 p = 0.026
     O3                   (ppb)                24.6 ± 7.0       20.1 ± 11.9       23.1 ± 10.5        15.5 ± 9.0                  p = 0.219                 p = 0.031
     NH3 b                (ppb)                 4.9 ± 4.1        10.5 ± 3.0        10.2 ± 3.4        11.0 ± 4.3                  p = 0.668                 p = 0.499
     PM2.5 components
     PM2.5 dry            (µg m−3 )             19.9 ± 4.8      34.4 ± 20.7       53.3 ± 33.7       72.2 ± 31.9                  p < 0.001                 p = 0.100
     SO2−
        4                 (µg m−3 )              3.3 ± 0.7        5.8 ± 4.1        10.8 ± 7.6       16.7 ± 11.2                  p < 0.001                 p = 0.069
     NO−3                 (µg m−3 )              1.7 ± 1.4        5.4 ± 7.3       12.1 ± 11.2       17.6 ± 12.1                  p < 0.001                 p = 0.166
     NH+4                 (µg m−3 )              1.6 ± 0.5        3.4 ± 3.6         6.9 ± 5.7        10.8 ± 6.9                  p < 0.001                 p = 0.075
     EC                   (µg m−3 )              1.4 ± 0.6        1.7 ± 0.6         1.6 ± 0.6         2.1 ± 0.8                  p = 0.128                 p = 0.036
     OM                   (µg m−3 )             10.1 ± 4.4      15.3 ± 10.1        15.0 ± 7.0        22.9 ± 8.6                  p = 0.025                 p = 0.005
     Wi                   (µg m−3 )              2.7 ± 1.4        7.4 ± 7.5       23.7 ± 24.9       22.2 ± 18.6                  p = 0.003                 p = 0.853
     Wo                   (µg m−3 )              0.9 ± 0.4        2.2 ± 1.7         3.1 ± 2.7         3.3 ± 2.3                  p = 0.087                 p = 0.833
     Carbonaceous analysis
     O/C                  (atomic ratio)      0.55 ± 0.11       0.55 ± 0.07       0.54 ± 0.04       0.55 ± 0.07                  p = 0.883                 p = 0.622
     OM/OC                (mass ratio)        1.87 ± 0.15       1.87 ± 0.10       1.86 ± 0.05       1.87 ± 0.08                  p = 0.927                 p = 0.632
     OC/EC                (mass ratio)          4.2 ± 1.7         4.8 ± 2.4         5.7 ± 2.5         6.2 ± 2.1                  p = 0.071                 p = 0.510
     ISORROPIA II analysis
     Ionic strength       (M)                 54.3 ± 16.2       42.2 ± 17.6       30.6 ± 10.3       47.1 ± 22.7                  p = 0.470                 p = 0.006
     pH                                         3.1 ± 0.6         3.2 ± 0.7         3.5 ± 0.5         3.5 ± 0.7                  p = 0.186                 p = 0.808
     Oxidation/partitioning
     SOR                  (molar ratio)       0.13 ± 0.04       0.19 ± 0.07       0.25 ± 0.09       0.28 ± 0.12                  p = 0.006                 p = 0.439
     ε(NO−
         3)               (molar ratio)       0.83 ± 0.28       0.67 ± 0.31       0.93 ± 0.09       0.90 ± 0.19                  p = 0.017                 p = 0.481
     ε(NH+
         4)               (molar ratio)       0.40 ± 0.27       0.25 ± 0.14       0.43 ± 0.18       0.52 ± 0.18                  p < 0.001                 p = 0.150
a Reanalysis data from the ERA-Interim at 37.5◦ N, 127.0◦ E. b Statistically reconstructed data based on Phan et al. (2013). T : temperature; RH: relative humidity;
WS: wind speed; SI: solar irradiance; BLH: boundary layer height; EC: elemental carbon; OM: organic matter; Wi : aerosol liquid water (ALW) content associated with inorganic
species; Wo : ALW content associated with OM; OC: organic carbon; SOR: sulfur oxidation ratio; ε(NO−                                         +
                                                                                                       3 ): nitrate partitioning ratio; ε (NH4 ): ammonium partitioning ratio.

plus particulate Cl− ) concentrations, as well as the particu-                            data, we used statistically reconstructed NH3 data and then
late SO2−     +     2+    +
        4 , K , Ca , Na , and Mg
                                    2+ concentrations. How-                               estimated HNO3 using a thermodynamic model.
ever, the ambient NH3 , HNO3 , and HCl data were not avail-                                  Firstly, the daily NH3 concentrations in Seoul from Jan-
able for this study. To overcome this problem with the input                              uary 2012 to December 2014 were reconstructed using the
                                                                                          statistical characteristics of a year-long record of NH3 at

https://doi.org/10.5194/acp-20-7575-2020                                                                         Atmos. Chem. Phys., 20, 7575–7594, 2020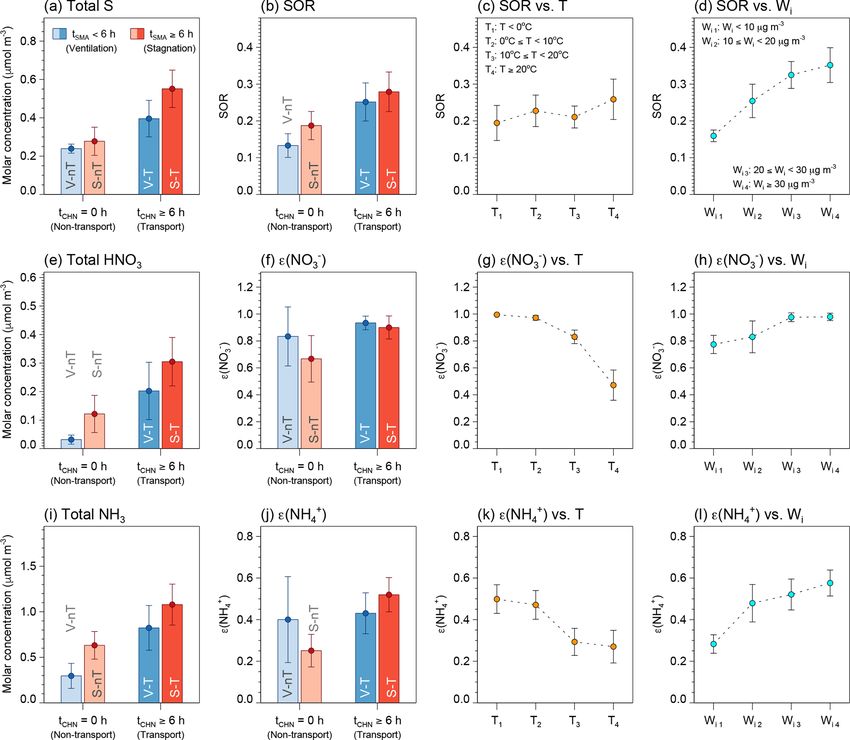
7580                                 J. Seo et al.: Synergistic haze enhancement by nitrate uptake into transported particles

Figure 2. Averages and confidence intervals at 95 % of (a) temperature (T ), (b) relative humidity (RH), (c) wind speed (WS), and (d) bound-
ary layer height (BLH) for the six case groups categorized by the ranges of the average daily residence time of backward trajectories in the
Seoul metropolitan area (tSMA ) and in the North China Plain and Yangtze River Delta (tCHN ).

the Gwangjin site (37.545◦ N, 127.096◦ E) in Seoul for the              as the total HNO3 , to estimate the HNO3 –NO−       3 partition-
preceding year (346 d between September 2010 and Au-                    ing ratio. Then, using both the measured NO−     3 and the ra-
gust 2011; Phan et al., 2013). There were small interannual             tio between the HNO3 and NO−        3 predicted from the ini-
changes in the estimated NH3 emission in Seoul (Fig. S6;                tial result, we estimated the ambient HNO3 . Note that we
NIER, 2018), and the two sites both share similar envi-                 regarded the HNO3 /NO−      3 ratio as approximately indepen-
ronments located downwind from the downtown core un-                    dent of the total HNO3 . Although the nitrate partitioning
der the prevailing westerlies and surrounded by residential             depends on temperature, ALW content, and pH in gen-
and small urban green areas (Fig. S1). Therefore, we as-                eral, the HNO3 /NO−     3 ratio is affected only by pH be-
sumed that the statistical characteristics of both sites and            cause both temperature and ALW are independent vari-
periods would be similar despite the temporal gap (∼ 1–                 ables in this step. In the existence of excess NH3 as we
3 years) and spatial distance (∼ 7.8 km) between this study             assumed for Seoul (∼ 10 ppb at the first step), changes in
and Phan et al. (2013). We built a multiple linear regres-              pH by total HNO3 are limited owing to the buffering ef-
sion model of NH3 that retains statistical characteristics of           fect of NH3 –NH+     4 partitioning (Weber et al., 2016; Guo
the measured NH3 such as the annual average and standard                et al., 2018; Lim et al., 2020). The pH, nitrate partition-
deviation of 10.9 ± 4.25 ppb and the significant linear corre-          ing ratio [ε(NO−             −              −
                                                                                           3 ) = NO3 /(HNO3 + NO3 )], and the am-
lations (p < 0.05) with temperature, RH, wind speed, and                monium partitioning ratios [ε(NH4 ) = NH+
                                                                                                             +
                                                                                                                    4 /(NH3 + NH4 )]
                                                                                                                                     +

SO2 , NO2 , and CO concentrations (Text S1 and Table S1                 from the ISORROPIA simulations with and without gas-
in the Supplement). The reconstructed NH3 concentration is              phase HNO3 information show negligible differences to each
seasonally high during the warm season as reported by Phan              other (Fig. 4d–f), unlike the significant role of additional
et al. (2013) and shows high peaks on the polluted days with            NH3 information in increasing pH and ε(NO−     3 ) and decreas-
stagnant condition in the cold season (Fig. S7).                        ing ε(NH+  4 ) (Fig. 4a–c).
   In the next step, the ISORROPIA II calculation was per-                 Finally, we repeated the ISORROPIA simulation with both
formed, using the reconstructed NH3 and measured NH+        4           total NH3 and total HNO3 estimated from the previous steps.
as the total equivalent NH3 , and the measured NO−    3 alone           Here we did not consider HCl–Cl− partitioning because the

Atmos. Chem. Phys., 20, 7575–7594, 2020                                                    https://doi.org/10.5194/acp-20-7575-2020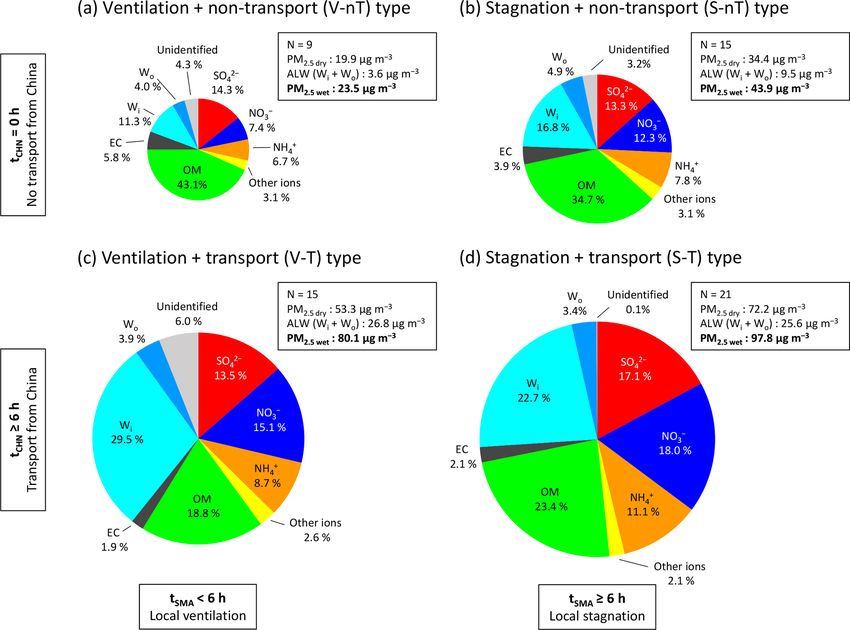
J. Seo et al.: Synergistic haze enhancement by nitrate uptake into transported particles                                                 7581

Figure 3. Averages and confidence intervals at 95 % of daily average concentrations of (a) SO2 , (b) NO2 , (c) O3 , (d) CO, and (e) PM10 ,
together with (f) PM2.5 measured at the KIST site in this study (dry PM2.5 ) for the six case groups categorized by ranges of the average daily
residence time of backward trajectories in the Seoul metropolitan area (tSMA ) and in the North China Plain and Yangtze River Delta (tCHN ).

Cl− fraction in dry PM2.5 (∼ 1 % on average) is signifi-                  NH3 levels will be small if NH3 concentrations are nonzero
cantly smaller than the NO−            +
                            3 and NH4 fractions (∼ 18 % and               (Fig. 5a, c, and e). The slopes of pH, ε(NO−                     +
                                                                                                                            3 ), and ε(NH4 )
∼ 12 % on average, respectively).                                         curves to the increase in fixed-NH3 level become gradually
   Although there are uncertainties in the reconstructed NH3              flat at over 5 ppb (Fig. 5b, d, and f), and this indicates that the
and HNO3 due to lack of direct measurements, their impact                 potential errors in reconstructed NH3 will not significantly
on the estimation of inorganic ALW and particle pH is small               change the results in this study.
enough to utilize them for the thermodynamic analysis in this                Since ALW content associated with OM (Wo ) is not con-
study. The good agreement between the predicted and sta-                  sidered in ISORROPIA II, we estimated it according to κ-
tistically reconstructed NH3 concentrations (R 2 ∼ 0.95), as              Köhler theory and the ZSR mixing rule (Nguyen et al., 2015,
well as between the predicted and measured SO2−     4 , NO3 ,
                                                             −
                                                                          and references therein) using the following equation:
          +                  2
and NH4 concentrations (R > 0.95; Fig. S8), ensures small
                                                                                           aw
errors in water contents of individual inorganic species.                 Wo = Vo κorg          ,                                          (1)
Since water uptake by inorganic aerosol in ISORROPIA II                                  1 − aw
is based on the Zdanovskii–Stokes–Robinson (ZSR) mixing
                                                                          where Vo is the volume of OM (µm3 cm−3 ), which is ob-
rule (Stokes and Robinson, 1966), which approximates the
                                                                          tained from OM concentration (µg m−3 ) divided by a typical
water content of a mixture as a sum of water contents of in-
                                                                          organic density of 1.4 g cm−3 (Turpin and Lim, 2001), κorg
dividual salts at the same RH (Fountoukis and Nenes, 2007),
                                                                          is the hygroscopicity parameter (dimensionless) calculated
the expected error in Wi induced by potential errors in NH3
                                                                          from the parameterized relationship of κorg = (0.29 ± 0.05) ·
and HNO3 would also be small. Regarding pH, the buffering
                                                                          (O/C) for the range of O/C from 0.3 to 0.6 (Chang et al.,
effect of semi-volatile NH3 partitioning reduces the sensitiv-
                                                                          2010), and aw is water activity (dimensionless) that is as-
ity of pH to excess NH3 in the NH3 -rich conditions like Seoul
                                                                          sumed to be equivalent to RH (Nguyen et al., 2016).
(Weber et al., 2016; Guo et al., 2018; Lim et al., 2020). We
conducted ISORROPIA simulations with various NH3 lev-
els (0–50 ppb) applied to all the measurement days as fixed
values to further explore the sensitivity of pH, ε(NO− 3 ), and
ε(NH+  4 ) to NH3 . Good correlations between results from the
daily varied-NH3 simulation and the fixed-NH3 simulations
show that potential errors induced by the estimation of daily

https://doi.org/10.5194/acp-20-7575-2020                                                    Atmos. Chem. Phys., 20, 7575–7594, 2020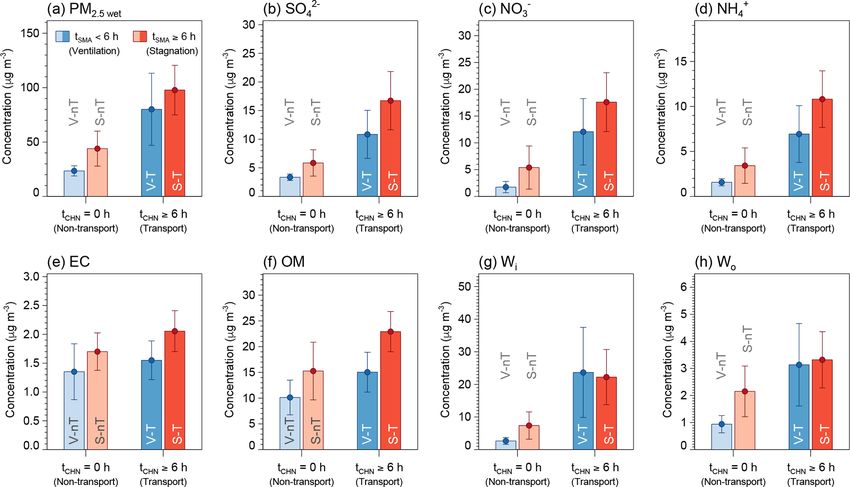
7582                                 J. Seo et al.: Synergistic haze enhancement by nitrate uptake into transported particles

Figure 4. Comparisons of the predicted pH, nitrate partitioning ratio [ε(NO−           −                −
                                                                              3 ) = NO3 /(HNO3 + NO3 )], and ammonium partitioning ratio
[ε(NH4 ) = NH4 /(NH3 + NH4 )] between (a–c) the simulation without gas-phase NH3 and HNO3 information (using NH+
       +         +              +                                                                                                         −
                                                                                                                               4 and NO3 as
                                                                                                                  +
the total NH3 and total HNO3 ; Simulation 1) and the simulation with reconstructed NH3 (using NH3 + NH4 as the total NH3 but only
NO− 3 as the total HNO3 ; Simulation 2) and between (d–f) Simulation 2 and the simulation with both estimated gas-phase NH3 and HNO3
information (this study; Simulation 3). Filled circles in light blue, light green, light yellow, and light red colors represent daily data and
belong to the “local ventilation with no regional transport” (V-nT) group, “local stagnation with no regional transport” (S-nT) group, “local
ventilation with regional transport” (V-T) group, and “local stagnation with regional transport” (S-T) group, respectively. Gray solid lines
indicate a 1-to-1 relationship.

3     Results and discussion                                             local-ventilation (V-T and V-nT) groups shows the effect of
                                                                         accumulation or diffusion of both local and transported pol-
3.1    Effects of regional transport and local stagnation                lutants in the Seoul metropolitan area. Thus, the significant
       on PM2.5 composition                                              difference in each PM2.5 component between the S-T and V-
                                                                         nT groups (Fig. 6) indicates both contributions of local stag-
Average concentrations of PM2.5 and chemical components                  nant conditions over the Seoul metropolitan area and regional
were highest in the “local stagnation with regional transport”           transport from the Chinese source area to the exacerbation of
(S-T) group (e.g., PM2.5 dry of 72.2 µg m−3 ) and lowest in the          haze pollution in Seoul.
“local ventilation with no regional transport” (V-nT) group                 The average concentrations of gaseous precursors like SO2
(e.g., PM2.5 dry of 19.9 µg m−3 ), and the average concentra-            and NO2 for the S-T group were about 2 times higher than
tions for the “local ventilation with regional transport” (V-T)          those for the V-nT group (Fig. 3), while SO2−        −
                                                                                                                      4 , NO3 , NH4 ,
                                                                                                                                     +

group and the “local stagnation with no regional transport”              and inorganic ALW increased by 5–10 times (Fig. 6). In
(S-nT) groups (e.g., PM2.5 dry of 53.3 and 34.4 µg m−3 , re-             contrast, average OM concentration for the S-T group was
spectively) were located between those of the S-T and V-                 2 times higher than that for the V-nT group, similarly to
nT groups (Table 2 and Fig. 3f). The composite difference                CO, and organic ALW of the S-T group showed a relatively
between the regional-transport (V-T and S-T) groups and                  smaller increase (∼ 4 times of the V-nT group) than inor-
no regional-transport (V-nT and S-nT) groups reveals the                 ganic ALW (∼ 8 times of the V-nT group). Therefore, the
regional effect of transported haze particles and precursors             PM2.5 increase in Seoul seems to be induced not only by the
from the North China Plain and Yangtze River Delta, while                physical and dynamical processes like transport or accumu-
that between the local-stagnation (S-T and S-nT) groups and              lation of air pollutants but also by the chemical process like

Atmos. Chem. Phys., 20, 7575–7594, 2020                                                     https://doi.org/10.5194/acp-20-7575-2020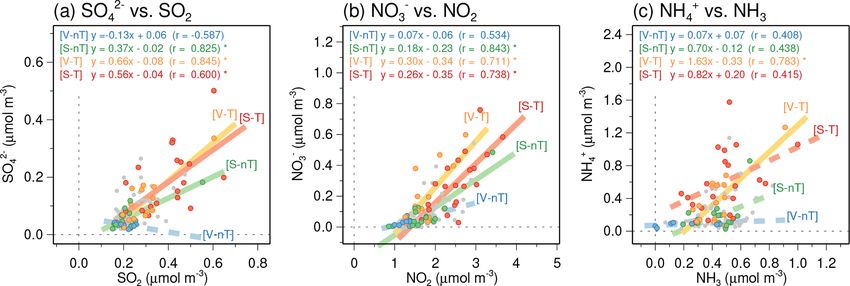
J. Seo et al.: Synergistic haze enhancement by nitrate uptake into transported particles                                                      7583

Figure 5. Sensitivity of (a–b) predicted pH, (c–d) nitrate partitioning ratio [ε(NO−             −                −
                                                                                       3 ) = NO3 /(HNO3 + NO3 )], and (e–f) ammonium parti-
                      +         +               +
tioning ratio [ε(NH4 ) = NH4 /(NH3 + NH4 )] to gas-phase ammonia (NH3 ) concentrations. (a, c, e) Comparisons between the simulation
in this study (using the daily reconstructed NH3 concentrations) and the simulations with the various fixed-NH3 levels (colored dots in gray,
blue, green, yellow, and red for 0, 5, 10, 20, and 40 ppb, respectively). Values in round brackets are the R-squared values of the linear regres-
sions. Gray solid lines indicate a 1-to-1 relationship. (b, d, f) Average (solid circles) and standard deviation (vertical bars) of pH, ε(NO−   3 ),
and ε(NH+  4 ) for the “local ventilation with no  regional transport” (V-nT) group (light blue), “local stagnation with no regional transport” (S-
nT) group (light green), “local ventilation with regional transport” (V-T) group (light yellow), and “local stagnation with regional transport”
(S-T) group (light red) with respect to the various fixed-NH3 levels from 0 to 50 ppb. Averages and standard deviations of the reconstructed
NH3 concentrations and obtained pH, ε(NO−                      +
                                                3 ), and ε(NH4 ) for the V-nT, S-nT, V-T, and S-T groups are represented as blue, green, yellow,
and red diamonds with horizontal and vertical bars.

secondary aerosol formation, particularly related to the in-                effect of regional transport is more significant for the in-
crease in inorganic species and ALW.                                        crease in inorganic species and water content, while the ef-
   A statistically significant difference (p < 0.05) between                fect of local stagnation is more significant for the increase
the S-T and S-nT groups (effect of regional transport in                    in carbonaceous species. The sulfur oxidation ratio [SOR
the local stagnant condition) was observed in SIA species                   = SO2−                2−                                  −
                                                                                  4 /(SO2 +SO4 )], nitrate partitioning ratio [ε(NO3 )],
(SO2−       −           +
    4 , NO3 , and NH4 ), OM, and ALW (both Wi and Wo ),
                                                                                                                     +
                                                                            and ammonium partitioning ratio [ε(NH4 )] of the S-T group,
and that between the S-T and V-T groups (effect of local                    which were significantly higher than that of the S-nT group
stagnation in the regional-transport condition) was seen for                (p < 0.05) but did not clearly differ from that of the V-T
EC and OM (Table 2). Thus, although both regional trans-                    group, indicate that the increase in SIA through the regional-
port and local stagnation can induce high concentrations of                 transport effect is closely associated with the enhanced oxi-
PM2.5 and its chemical components of the S-T group, the

https://doi.org/10.5194/acp-20-7575-2020                                                        Atmos. Chem. Phys., 20, 7575–7594, 2020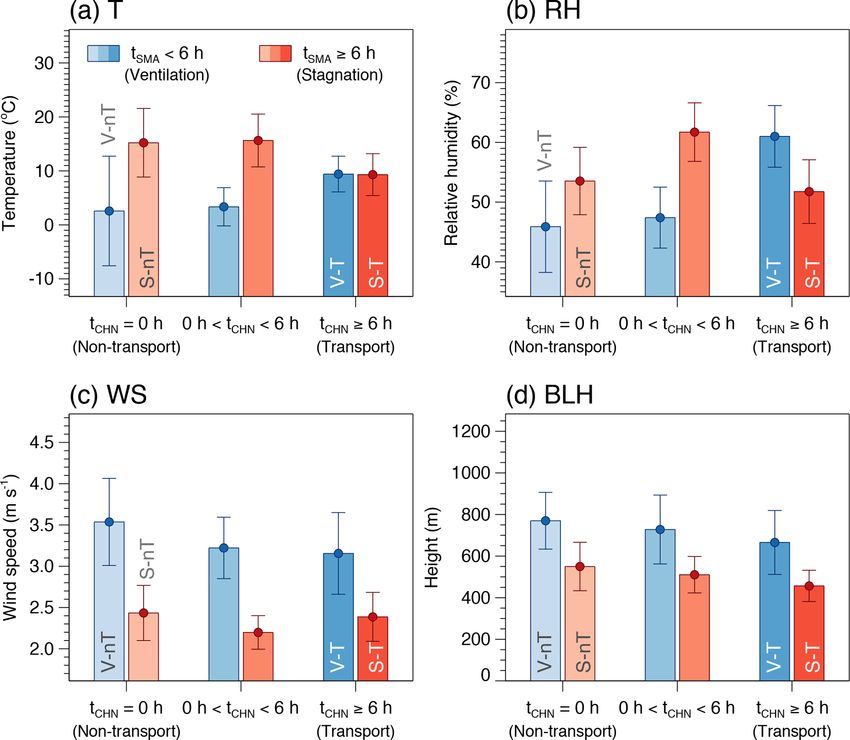
7584                                  J. Seo et al.: Synergistic haze enhancement by nitrate uptake into transported particles

Figure 6. Average concentrations and confidence intervals at 95 % of (a) wet PM2.5 (PM2.5 wet ), (b) sulfate (SO2−                            −
                                                                                                                         4 ), (c) nitrate (NO3 ),
                     +
(d) ammonium (NH4 ), (e) elemental carbon (EC), (f) organic matter (OM), (g) inorganic ALW (Wi ), and (h) organic ALW (Wo ) for the
“local ventilation with no regional transport” (V-nT) group (light blue), “local stagnation with no regional transport” (S-nT) group (light red),
“local ventilation with regional transport” (V-T) group (darker light blue), and “local stagnation with regional transport” (S-T) group (darker
light red) categorized by ranges of the average daily residence time of backward trajectories in the Seoul metropolitan area (tSMA ) and in the
North China Plain and Yangtze River Delta (tCHN ).

dation (e.g., from NOx to HNO3 ) or partitioning of inorganic              3.2   Fractional changes of ALW and SIA by effects of
species into the particle phase.                                                 regional transport and local stagnation
   Note that OM concentration seems to be increased by
both effects of regional transport and local stagnation (Ta-               The chemical mass fraction of PM2.5 is expected to be af-
ble 2 and Fig. 6f). However, the average estimates of the                  fected by source characteristics (emissions) and chemical
O/C ratio (∼ 0.55) and OM/OC ratio (∼ 1.87), which are in                  process (secondary aerosol formation), but not by the phys-
between semi-volatile oxygenated OA (SV-OOA) and low-                      ical and dynamical processes (transport and accumulation),
volatility oxygenated OA (LV-OOA), are similar for the four                which affect the mass concentration of PM2.5 . Thus, the
categorized groups (Table 2). Together with weak correla-                  mass fraction of each component is helpful to understand
tions of the O/C ratio with wind speed (r = −0.093) and                    the source and chemical characteristics of each categorized
BLH (r = −0.172) in total daily data (n = 118), this sug-                  group.
gests that aging and oxidation of SOA in Seoul was not much                   In terms of the component fraction, PM2.5 of the “local
dependent on external conditions like stagnation or trans-                 stagnation with regional transport” (S-T) group can be char-
port. Rather, significant correlations of the O/C ratio with               acterized by inorganic-rich, wet particles, while that of the
temperature (r = −0.531) and solar irradiance (r = −0.370)                 “local ventilation with no regional transport” (V-nT) group
indicate the winter-high/summer-low seasonality of the sec-                was relatively organic-richer and drier (Fig. 7). Estimated
ondary fraction in OA. Such temperature-dependent SOA                      wet PM2.5 (including ALW of both Wi and Wo ; PM2.5 wet )
fraction can be also found in OC/EC ratio (r = −0.638 for                  of the S-T group contained larger fractions of SIA species
temperature and r = −0.469 for solar irradiance), which can                (SO2−       −          +
                                                                                4 , NO3 , and NH4 ) and ALW but a smaller OM frac-
be regarded as an index for secondary OC, and is consistent                tion (46 % SIA, 23 % OM, and 26 % ALW) than that of the
with partitioning theory (Takekawa et al., 2003).                          V-nT group (29 % SIA, 43 % OM, and 15 % ALW). Com-
                                                                           parisons with the “local ventilation with regional transport”
                                                                           (V-T) group (37 % SIA, 19 % OM, and 33 % ALW) and the
                                                                           “local stagnation with no regional transport” (S-nT) group
                                                                           (34 % SIA, 35 % OM, and 21 % ALW) show that the effect

Atmos. Chem. Phys., 20, 7575–7594, 2020                                                       https://doi.org/10.5194/acp-20-7575-2020
J. Seo et al.: Synergistic haze enhancement by nitrate uptake into transported particles 7585
of regional transport increases inorganic and water fractions, The NH+ 4 fraction of PM2.5 dry was 8 % for the V-nT
while the effect of local stagnation raises organic fraction of group, 10 % for the S-nT group, 13 % for the V-T group,
the total PM2.5 wet . Note that the increase in ALW fraction and 15 % for the S-T group. The higher fractional increase
from the V-nT (15 %) to V-T (33 %) groups is much larger in NH+ 4 through the regional-transport effect (T-minus nT-
than that from the S-nT (21 %) to S-T (26 %) groups because groups; 5 %) compared to that through the local-stagnation
of the significantly higher increase in RH from the V-nT effect (S-minus V-groups; 2 %) results from the higher in-
(46 %) to V-T (61 %) groups compared to that from the S-nT crease in both SO2− 4 and NO− 3 aerosols related to the
(54 %) to S-T (52 %) groups. The relationship between RH regional-transport effect.
and ALW, as well as hygroscopic properties of Seoul haze
particles, will be further discussed in the next section. 3.3 Synergistic effect of transported hygroscopic
The SO2− 4 fraction of dry PM2.5 (excluding Wi and Wo ;
particles on SIA in the cold season
PM2.5 dry ) was ∼ 17 % for the no regional-transport (V-nT
and S-nT) groups and about 20 % and 23 % for the V-T The high-concentration, inorganic-rich, and wet particles
and S-T groups, respectively. The SO2− 4 fraction in the no
(high SIA and ALW fractions of PM2.5 wet ) mostly belong to
regional-transport groups is close to the background frac- the regional-transport (V-T and S-T) groups, of which back-
tion of SO2−4 in PM2.5 dry in Seoul, and this fraction is com-
ward trajectories originated from the upwind regional source
parable to the “local sulfate source” contribution of 21.7 % area (the North China Plain and Yangtze River Delta), while
(mostly in the form of ammonium sulfate and equivalent to relatively low-concentration, organic-rich dry particles (high
the SO2− 4 contribution of ∼ 16 %) identified by the previ-
OM fraction of PM2.5 wet ) belong to the “local ventilation
ous source apportionment study on PM2.5 in Seoul (Kim et with no regional transport” (V-nT) group (Fig. 8a and b).
al., 2016). A previous field study conducted on the multi- The ALW fraction is a function of RH and also increases
day haze episode showed that the SO2− 4 concentration at the
with the SIA fraction at the same RH (Fig. 8c), similar to
upwind background site over the Yellow Sea (Deokjeok Is- the Beijing haze (Wu et al., 2018). This indicates that Seoul
land; 37.233◦ N, 126.149◦ E) was nearly the same as Seoul haze is hygroscopic and the major driver of its hygroscopic-
SO2−4 at the regional-transport stage of haze or the clean pe-
ity is inorganic species. Since the SIA fraction was relatively
riod and even kept ∼ 50 % of the Seoul SO2− higher in the regional-transport groups compared to that in
4 concentra-
tion at the local-stagnation stage of the haze episode (Seo the no regional transport groups, the hygroscopic properties
et al., 2017). Thus, together with considering the small SO2 of PM2.5 in Seoul were more clearly revealed in the regional-
emission in the Seoul metropolitan area compared to the transport groups (Fig. 8d). Therefore, the ALW fraction in
North China Plain (Li et al., 2017; NIER, 2018) and the the transported particles (e.g., the regional-transport groups)
SO2 increase through the regional-transport effect (regional- was higher than that in the particles of local origin (e.g., the
transport groups minus no regional-transport groups; ∼ 2– “local stagnation with no regional transport” (S-nT) group).
4 ppb), the majority of SO2− The concentrations of SO2− − +
4 , NO3 , and NH4 increase
4 in the regional-transport (V-T
and S-T) groups seems to be directly transported from China with their gas-phase precursors (SO2 , NO2 , and NH3 ) in
or produced during the transport from China before arriving Seoul, except for the V-nT group. However, the regression
at the Seoul metropolitan area. slopes of the SO2− − +
4 , NO3 , and NH4 with respect to their
The NO− precursors in the regional-transport groups are steeper than
3 fraction of PM2.5 dry was only ∼ 9 % for the
V-nT group but increased to 16 % and 23 % for the S- the slope of the S-nT group (Fig. 9). Such a higher sensi-
nT and V-T groups and reached more than 24 % for the tivity of the increase in SO2− − +
4 , NO3 , and NH4 to the gas-
S-T group. Interestingly, the fractional increase through phase precursors of the regional-transport groups is related
the local-stagnation effect (local-stagnation groups minus to the higher ratios of sulfur oxidation (SOR) and parti-
local-ventilation groups; ∼ 2 %–7 %) is much smaller than tioning [ε(NO− +
3 ) and ε(NH4 )] compared to the S-nT group
that through the regional-transport effect (regional-transport (Fig. 10b, f, and j). Since the average concentrations of to-
groups minus no regional-transport groups; ∼ 9 %–14 %) de- tal sulfur (= SO2 + SO2− 4 ), total HNO3 , and total NH3 are
spite the same increase in NO2 concentration (∼ 15 ppb; Ta- highest in the “local stagnation with regional transport” (S-T)
ble 2) through two different effects. Seoul is one of the largest group due to a combination of remote precursors transported
sources of NOx in Korea, but the previous study using satel- from China and local precursors accumulated in the stagnant
lite NOx column data with the Lagrangian model demon- condition (Fig. 10a, e, and i), the high SOR, ε(NO− 3 ), and
strated that the Chinese contribution to the NO2 columns ε(NH+ 4 ) of the regional-transport groups induced the high-
over Korea reaches up to ∼ 50 %–70 % (Lee et al., 2014). est average SO2− 4 , NO −
3 , and NH +
4 concentrations of the S-T
However, the impact of regional transport on the increase in group (Table 2).
NO− The SOR, ε(NO− +
3 ), and ε(NH4 ) averaged for four range
3 fraction, which is ∼ 2 times higher than that of the local
stagnation, indicates a nonlinear effect of regional transport classes of temperature and inorganic ALW (Wi ) show that all
on the NO− the ratios increased with Wi (Fig. 10d, h, and l), and ε(NO− 3)
3 increase in Seoul haze.
and ε(NH+ 4 ) decreased with temperature (Fig. 10g and k).
https://doi.org/10.5194/acp-20-7575-2020 Atmos. Chem. Phys., 20, 7575–7594, 20207586 J. Seo et al.: Synergistic haze enhancement by nitrate uptake into transported particles
Figure 7. Average chemical compositions of wet PM2.5 (PM2.5 wet ) for the (a) “local ventilation with no regional transport” (V-nT) group,
(b) “local stagnation with no regional transport” (S-nT) group, (c) “local ventilation with regional transport” (V-T) group, and (d) “local
stagnation with regional transport” (S-T) group. Fractional species are sulfate (red), nitrate (dark blue), ammonium (orange), organic matter
(green), elemental carbon (black), inorganic ALW (light blue), organic ALW (darker light blue), and other ions (chloride, sodium, potassium,
magnesium, and calcium; yellow). The size of each circle is proportional to the PM2.5 wet concentration.
Changes in Wi from the S-nT group (∼ 7 µg m−3 on average; of HNO3 gas into the particle phase and takes up more
Wi1 ) to the regional-transport groups (> 20 µg m−3 on aver- ALW. However, if SO2− 4 is dominant in the particle, such
age; Wi3 ) increase SOR, ε(NO− +
3 ), and ε(NH4 ) by approxi- a feedback process will be weakened because SO2− 4 is non-
mately up to 20 % for each ratio. This implies that the trans- volatile (Guo et al., 2017). The average NO− -to-SO 2−
3 4 mo-
ported haze particles in the regional-transport groups, which lar ratios of the regional-transport groups (1.87 for the S-T
are richer in inorganics and more hygroscopic than the local group and 1.60 for the V-T group) are higher than that of the
haze particles of the S-nT group (Fig. 8), promote SIA pro- no regional-transport groups (1.29 for the S-nT group and
duction. The aqueous-phase oxidation of SO2 via H2 O2 , O3 , 0.81 for the V-nT group). Since ALW, pH, and ε(NO− 3 ) in
NO2 , and transition metal ion (TMI) pathways (Harris et al., the regional-transport (V-T and S-T) groups are higher than
2013; Cheng et al., 2016; Wang et al., 2016) and the parti- those in the no regional-transport (V-nT and S-nT) groups,
tioning of HNO3 and NH3 via dissolution and dissociation this feedback process can explain the synergistic effect of
in the wet particles (Seinfeld and Pandis, 2016) are effective transported particles on the high NO− 3 and ALW fractions.
ways to produce SO2− − +
4 , NO3 , and NH4 . Therefore, ALW Note that the partitioning of HNO3 and NH3 is also de-
in the hygroscopic particles can synergistically increase the pendent on temperature (T ) (Fig. 10g and k). Changes in
inorganic species in a precursor-rich urban area like Seoul. T from the S-nT group (∼ 15 ◦ C on average; T3 ) to the
In terms of the synergistic increase in NO− 3 with ALW, regional-transport groups (∼ 9 ◦ C on average; T2 ) can also
− 2−
the ratio between NO3 and SO4 can be an important fac- increase ε(NO− +
3 ) and ε(NH4 ) by approximately 20 % for
tor. Hygroscopic uptake of ALW by both SO2− 4 and NO3
−
each, similar to the effect of inorganic ALW. In Korea, the re-
can increase pH through a dilution effect on hydrogen ions gional transport of air pollutants from the NCP area is usually
(H+ ). Because NO− 3 is a semi-volatile hygroscopic species, accompanied by westerly or northwesterly continental out-
the higher pH increased by ALW allows more partitioning flow, which induces cold advection, during the cold season
Atmos. Chem. Phys., 20, 7575–7594, 2020 https://doi.org/10.5194/acp-20-7575-2020J. Seo et al.: Synergistic haze enhancement by nitrate uptake into transported particles 7587
Figure 8. (a–b) Scatterplots of the secondary inorganic aerosol (SIA) fraction to wet PM2.5 (SIA/PM2.5 wet ) ratio versus the organic matter
(OM) fraction to wet PM2.5 (OM/PM2.5 wet ) ratio, colored according to (a) the aerosol liquid water (ALW) to wet PM2.5 (ALW/PM2.5 wet )
ratio and (b) the categories for each case. (c–d) Scatterplots of ALW/PM2.5 wet versus relative humidity (RH), colored according to
(c) SIA/PM2.5 wet ratio and (d) the categories. The size of each circle is proportional to the dry PM2.5 (PM2.5 dry ) concentration.
Figure 9. Scatterplots of (a) SO2− − +
4 versus SO2 , (b) NO3 versus NO2 , and (c) NH4 versus the reconstructed ammonia (NH3 ). Filled circles
in blue, green, yellow, and red colors represent daily data belonging to the “local ventilation with no regional transport” (V-nT) group, “local
stagnation with no regional transport” (S-nT) group, “local ventilation with regional transport” (V-T) group, and “local stagnation with
regional transport” (S-T) group, respectively. The statistically significant linear regression slopes (p < 0.01) for each group are represented
by solid lines.
https://doi.org/10.5194/acp-20-7575-2020 Atmos. Chem. Phys., 20, 7575–7594, 20207588 J. Seo et al.: Synergistic haze enhancement by nitrate uptake into transported particles
Figure 10. Average concentrations and confidence intervals at 95 % of (a) total sulfur (= SO2 + SO2− 4 ), (b–d) sulfur oxidation ratio (SOR),
(e) total HNO3 (= HNO3 + NO− 3 ), (f–h) nitrate partitioning ratio [ε(NO−
3 )], (i) total NH3 (= NH3 + NH+ 4 ), and (j–l) ammonium partition-
+
ing ratio [ε(NH4 )]. (a–b, e–f, i–j) Average for the “local ventilation with no regional transport” (V-nT) group (light blue), “local stagnation
with no regional transport” (S-nT) group (light red), “local ventilation with regional transport” (V-T) group (darker light blue), and “local
stagnation with regional transport” (S-T) group (darker light red). (c, g, k) Average for the temperature (T ) ranges of T < 0 ◦ C (T1 ; n = 19),
0 ◦ C ≤ T < 10 ◦ C (T2 ; n = 31), 10 ◦ C ≤ T < 20 ◦ C (T3 ; n = 30), and T ≥ 20 ◦ C (T4 ; n = 19). (d, h, l) Average for the inorganic ALW
(Wi ) ranges of Wi < 10 µg m−3 (Wi1 ; n = 58), 10 µgm−3 ≤ Wi < 20 µg m−3 (Wi2 ; n = 14), 20 µgm−3 ≤ Wi < 30 µg m−3 (Wi3 ; n = 12),
and Wi ≥ 30 µg m−3 (Wi4 ; n = 15).
(Kim et al., 2018). The lower temperature of the S-T group 3.4 Effect of NOx and NH3 control on mitigating haze
(∼ 9 ◦ C) compared to the S-nT group (∼ 15 ◦ C) could lead pollution in Seoul
to the higher sensitivity of the SIA increase to the precursor
concentrations in the S-T group (Fig. 9). Interestingly, the The ε(NO− 3 ) can be analytically calculated according to the
increasing SOR through temperature (and also irradiance) solubility and dissociation of gas-phase HNO3 and repre-
is not as significant as that through inorganic ALW (Figs. sented as a sigmoid function (S curve) of pH (Guo et al.,
10c) despite the high-temperature and strong-irradiance con- 2018; Nah et al., 2018) by the following equation:
ditions conducive to photochemical oxidation of SO2 in sum-
ε NO−
mer. This implies that the observed high SO2− 3 =
4 in the S-T
HHNO∗3 Wi RT 0.987 × 10⁻¹⁴
group resulted not only from the photochemical gas-phase
oxidation but also considerably from the aqueous-phase oxi- , (2)
γH+ γNO− 10−pH + HHNO∗3 Wi RT 0.987 × 10⁻¹⁴
dation of SO2 in the transported wet particles. 3
Atmos. Chem. Phys., 20, 7575–7594, 2020 https://doi.org/10.5194/acp-20-7575-2020J. Seo et al.: Synergistic haze enhancement by nitrate uptake into transported particles 7589
where 0.987 × 10⁻¹⁴ is the unit conversion factor from at-
mospheric pressure and micrograms to SI units, R is the gas
constant (8.314 J mol−1 K−1 ), Wi (µg m−3 ) is the ALW con-
tent associated with inorganic species, and HHNO∗3 is the ef-
fective Henry’s law constant (products of Henry’s law con-
stant for HNO3 gases and the acid dissociation constant
for HNO3 ↔ NO− +
3 + H ) dependent on temperature and pH
2 −2 −1
(mol kg atm on a molality basis; Clegg et al., 1998).
The product of activity coefficients, γH+ γNO− , is dependent
3
on both temperature and ionic strength (Kusik and Meissner,
1978; Kim et al., 1993). In this study, daily γH+ γNO− was
3
obtained based on daily average ambient temperature and
ionic strength from ISORROPIA II and ranged from 0.135
to 0.734, with an average of 0.333 ± 0.150.
The S curve of ε(NO− 3 ) as a function of pH is useful
Figure 11. The calculated sigmoid curves (S curves) and ob-
for examining the role of inorganic ALW and temperature served ambient gas-particle partitioning ratios (solid circles) for
in HNO3 –NO− nitrate [ε(NO−3 )] plotted against the ISORROPIA-predicted par-
3 partitioning and provides insights into the
potential HNO3 partitioning by a change in particle pH. In ticle pH. The blue, green, yellow, and red circles represent the
“local ventilation with no regional transport” (V-nT) group, “lo-
Fig. 11, both a decrease in temperature and an increase in
cal stagnation with no regional transport” (S-nT) group, “local
ALW can shift the ε(NO− 3 ) curves toward a lower pH, so ventilation with regional transport” (V-T) group, and “local stag-
more HNO3 can exist in the particle phase. Almost 100 % of nation with regional transport” (S-T) group, respectively, and the
the total HNO3 exists in the particle phase at the higher pH size of each circle is proportional to the concentration of inor-
(> 4) in Seoul. Since the gas-phase HNO3 largely formed by ganic ALW (Wi ). The curves were calculated based on the median
the reaction of NO2 with hydroxyl radicals (OH) is highly values of temperature (T ), Wi , and the product of activity coef-
water-soluble (Seinfeld and Pandis, 2016), the transported ficient (γH+ γNO− ) for each group; T = 0.6 ◦ C, Wi = 2.2 µg m−3 ,
3
wet particles (the regional-transport (V-T and S-T) groups) and γH+ γNO− = 0.146 for the V-nT group; T = 17.5 ◦ C, Wi =
3
can easily take up HNO3 gas into the aerosol solution in
5.6 µg m−3 , and γH+ γNO− = 0.295 for the S-nT group; T =
the NOx -rich (∼ 60 ppb) environment of Seoul (Vellingiri 3
et al., 2015), particularly during the cold season. Note that 11.6 ◦ C, Wi = 16.6 µg m−3 , and γH+ γNO− = 0.458 for the V-T
3
ALW can additionally enhance the nitrate radical (NO3 )– group; T = 6.9 ◦ C, Wi = 18.0 µg m−3 , and γH+ γNO− = 0.400 for
3
N2 O5 pathway and heterogeneous N2 O5 hydrolysis (Bertram the S-T group.
et al., 2009). In addition, the high NH3 level (∼ 10 ppb) in
Seoul (Phan et al., 2013) helps further to increase the uptake
of HNO3 gas into the aerosol solution (Guo et al., 2018). (pH of ∼ 3.5 on average) for the S-T group may cost more
To reduce ammonium nitrate aerosols in Seoul, therefore, than that for the S-nT group because the ε(NO− 3 ) in the S-nT
two ways can be suggested; the NOx control and the NH3 group (green circles) starts to decrease rapidly at pH < 3.5,
control. As shown in Fig. 9b, the observed NO− 3 concentra- while that in the regional-transport groups (yellow circles for
tion is highly correlated with the NO2 level, and this implies the V-T group and red circles for the S-T group) remains rela-
that the NOx control will be an effective way to reduce to- tively high (∼ 80 %) at the lower pH (∼ 2.5) (Fig. 11). Since
tal HNO3 and NO− 3 concentrations. Such a direct relation- the haze pollution in Seoul usually becomes severe with the
ship between NOx control and nitrate aerosol is significant regional transport of hygroscopic wet particles (e.g., the S-T
at the condition of ε(NO− 3 ) close to 1. Because of the higher group), a greater reduction in the NH3 emissions should be
ε(NO− 3 ) of the transported wet particles, the NOx reduction required for the higher-concentration S-T group compared to
will more effectively reduce NO− 3 in the regional-transport the lower-concentration S-nT group. However, the benefit of
groups compared to the “local stagnation with no regional reducing PM2.5 mass concentration by an NH3 control can be
transport” (S-nT) group. For example, the potential NO− 3 re- canceled out by the adverse effects of strong particle acidity
duction by a 10 ppb decrease in ambient NO2 concentration on human health (Fang et al., 2017).
deduced from the linear regression in Fig. 9b can be esti-
mated as being ∼ 8 µg m−3 for the “local ventilation with re-
gional transport” (V-T) group, ∼ 7 µg m−3 for the “local stag- 4 Conclusions
nation with regional transport” (S-T) group, and ∼ 5 µg m−3
for the “local stagnation with no regional transport” (S-nT) Based on PM2.5 chemical speciation, gaseous pollutants, and
group. On the other hand, the NH3 control to achieve the low meteorological data in Seoul together with backward trajec-
ε(NO− tory analysis, the present study investigated chemical com-
3 ) by lowering the particle pH from the current level
positions and characteristics of urban haze particles in the
https://doi.org/10.5194/acp-20-7575-2020 Atmos. Chem. Phys., 20, 7575–7594, 2020You can also read