TABCORP HOLDINGS LIMITED - FIRST HALF RESULTS PRESENTATION for the six months ended 31 December 2020

 
CONTINUE READING
TABCORP HOLDINGS LIMITED - FIRST HALF RESULTS PRESENTATION for the six months ended 31 December 2020
TABCORP                                 HOLDINGS LIMITED

 2020-21
 FIRST HALF RESULTS PRESENTATION
 for the six months ended 31 December 2020

17 FEBRUARY 2021    ABN 66 063 780 709
TABCORP HOLDINGS LIMITED - FIRST HALF RESULTS PRESENTATION for the six months ended 31 December 2020
03 - 06   Group Overview

TA B L E O F   08 - 18   Business Results
CONTENTS
               20        Capital

               22        Conclusion

               24 - 30   Appendices
TABCORP HOLDINGS LIMITED - FIRST HALF RESULTS PRESENTATION for the six months ended 31 December 2020
EBITDA CONTRIBUTION2

         STRONG RECOVERY IN PROGRESS                                                                                   4%

         FOLLOWING COVID-19 CHALLENGES

     o        Group revenue down 1.5% and EBITDA1 down 6.2% vs pcp, primarily due to
              COVID-19 impacts:                                                                         41%
                 •        Lotteries & Keno – strong digital growth and excellent game portfolio                                         55%
                          performance
                 •        Wagering & Media
                            –        Solid underlying performance; digital revenue grew 34%; earnings
                                     impacted by the COVID-19 restrictions on venue network
                            –        Now a better business post integration and transformation
                                                                                                           Lotteries     Wagering       Gaming
                                                                                                          XXXXX         XXXXX         XXXXX
                 •        Gaming Services – heavily impacted by venue restrictions in 1H21                    & Keno        & Media    Services

                 •        Dividend resumed at 80% payout ratio or 7.5 cps, fully franked
     o        Emerging from COVID-19 challenges in a stronger financial position
                 •        Gearing within target range
                 •        Optimisation program (3S) delivering efficiencies and EBIT savings of
                          $8m in 1H21
     o        Cost synergies from integration on track to deliver $95m of annual EBITDA
              savings
     o        All businesses well positioned for the second half

    Notes:
    1.       EBITDA before significant items
3
    2.       Based on 1H21. Contribution excludes Other division
TABCORP HOLDINGS LIMITED - FIRST HALF RESULTS PRESENTATION for the six months ended 31 December 2020
1 H 2 1 G R O U P R E S U LT

                                                                                                                                                                                                                  Change
    $m                                                                                                                                1H21                           1H20
                                                                                                                                                                                                       $                        %
     Revenues                                                                                                                         2,870                          2,914                           (44)                     (1.5%)

     Variable contribution                                                                                                             957                           1,030                           (73)                     (7.1%)

     Operating expenses                                                                                                               (397)                          (433)                            36                      (8.3%)

     EBITDA before significant items                                                                                                   560                            597                            (37)                     (6.2%)

     D&A                                                                                                                              (188)                          (193)                             5                      (2.6%)

     EBIT before significant items                                                                                                     372                            404                            (32)                     (7.9%)

     Interest                                                                                                                          (82)                           (94)                            12                      (12.8%)

     Tax expense                                                                                                                       (83)                           (96)                            13                      (13.5%)

     NPAT before significant items                                                                                                     207                            214                             (7)                     (3.3%)

     Significant items (after tax)1                                                                                                    (22)                           (15)                            (7)                     46.7%

     Statutory NPAT                                                                                                                    185                            199                            (14)                     (7.0%)

                                                                                                                                                                                                                  Change
    Cents per share                                                                                                                   1H21                           1H20
                                                                                                                                                                                                    Cents                       %
     EPS (before significant items)                                                                                                     9.6                           10.6                           (1.0)                    (9.4%)

     EPS (statutory)                                                                                                                    8.6                            9.8                           (1.2)                    (12.2%)

     DPS (fully franked)                                                                                                                7.5                           11.0                           (3.5)                    (31.8%)

    Notes:
    1.       Significant items (after tax) of $22m comprise amended tax treatment of MAX CMS Licence $69m, Racing Queensland arrangements $11m, Tatts Group combination implementation costs $8m and restructure costs $3m,
4            partly offset by the profit on sale of Jumbo $69m. Refer Appendix 1
TABCORP HOLDINGS LIMITED - FIRST HALF RESULTS PRESENTATION for the six months ended 31 December 2020
E A R N I N G S M AT E R I A L LY I M PA C T E D B Y C O V I D - 1 9

    COVID-19 RETAIL RESTRICTIONS CONTINUED TO IMPACT RESULTS, DESPITE COST CONTROL MEASURES

     1H21 EBITDA ($M)

         Digital growth and excellent underlying game
                                                                                             Impacted by COVID-19,
         portfolio performance whilst cycling very strong
                                                                                             especially retail closures and
         jackpot sequences from pcp
                                                                                             other restrictions in Victoria

                                                                                                                                Employee stand downs, reduced
                                                                                                                                discretionary spend, travel and
                                                                                                                                entertainment reductions

                                                                                                                            1

    Notes:
5   1.       3S net EBITDA savings of $5m comprise $7m savings (VC $3m; opex $4m), partly offset by $2m cost to implement
TABCORP HOLDINGS LIMITED - FIRST HALF RESULTS PRESENTATION for the six months ended 31 December 2020
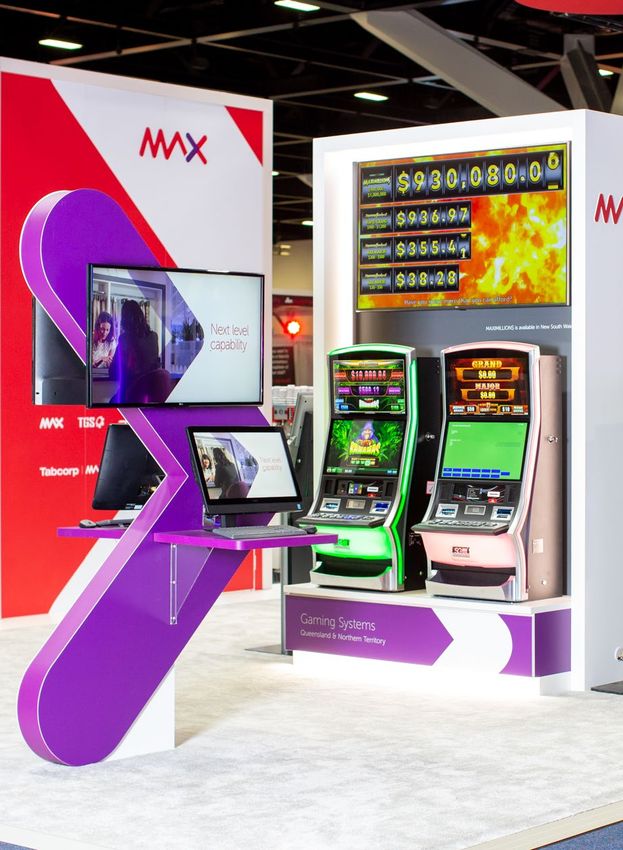
O P T I M I S AT I O N P R O G R A M ( 3 S ) T O D R I V E O P E R AT I O N A L
          I M P R O V E M E N T S A N D A C C E L E R AT E S AV I N G S

                  Tabcorp-Tatts Merger                                                                          Integration                                                            Optimisation
                     December 2017                                                                          January 2018 to FY21                                                       FY21 to FY23

    INTEGRATION                                                                                                                                                    EBITDA – COST SYNERGIES ($M)
    o Cost synergies on track to deliver $95m of annual EBITDA savings
                                                                                                                                                                                                         95
    o One-off costs incurred to 31 December 2020: $114m pre tax                                                                                                                             86
    o Wagering & Media retail uplift to complete in FY21
                                                                                                                                                                                                         48
                                                                                                                                                                           57                45
    OPTIMISATION – Simpler, Smarter & Stronger (3S)
    o A three-year integrated, enterprise-wide optimisation program to deliver enhanced                                                                                    34
      operational capability and sustainable savings (over and above those from
      integration)                                                                                                                                                                           41         47
                                                                                                                                                                           23
    o 1H21 EBIT savings $8m1 (VC $3m; opex $4m; D&A $1m); cost to implement $2m2                                                                               6
    o Targeting $20-25m1 of savings in FY21                                                                                                                   2H18        FY19             FY20         FY21
                                                                                                                                                                          First Half      Second Half
    o Key areas impacting FY21
              • Review of key commercial arrangements and programs
              • Operating model changes (Wagering & Media, Gaming Services)
              • Process simplification and re-design:
                       – Efficiency improvements (e.g. Field Services)
                       – Maximising value from vendor spend                                                                                                                              GAMING SERVICES
                                                                                                                                                                                         $9m annual savings
                                                                                                                                                                                         (1H21: $3m)

     Notes:
     1.       Excludes cost inflation; savings based on FY20 baseline adjusted to remove impacts of COVID-19 cost mitigations and other non-recurring items
6
     2.       Excludes restructure costs ($5m before tax, $3m after tax) shown as a significant item. Refer Appendix 1
TABCORP HOLDINGS LIMITED - FIRST HALF RESULTS PRESENTATION for the six months ended 31 December 2020
03 - 06   Group Overview

TA B L E O F   08 - 18   Business Results
CONTENTS
               20        Capital

               22        Conclusion

               24 - 30   Appendices
TABCORP HOLDINGS LIMITED - FIRST HALF RESULTS PRESENTATION for the six months ended 31 December 2020
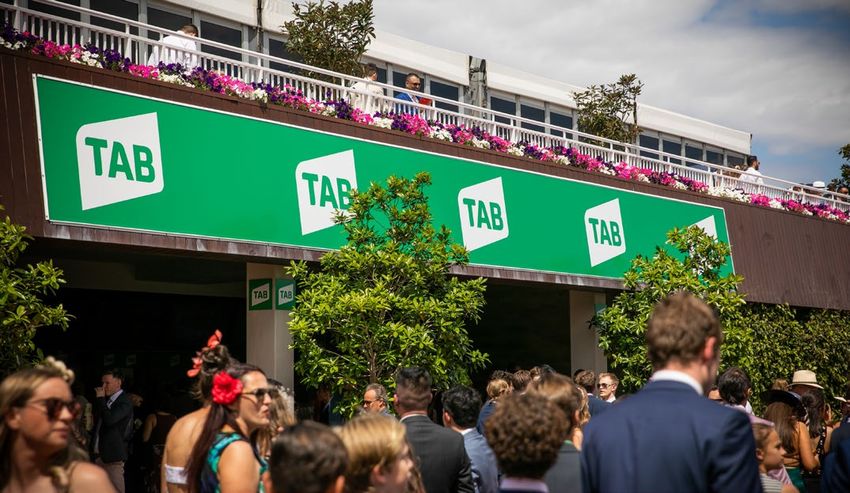
G R O U P & B U S I N E S S R E S U LT S 1

                                                            Lotteries & Keno                                     Wagering & Media                                      Gaming Services                            Group
     $m
                                                   1H21              1H20            Change              1H21              1H20           Change              1H21              1H20            Change    1H21    1H20    Change

      Revenues                                     1,609             1,584             1.6%              1,189             1,180             0.8%                73              149            (51.0%)   2,870   2,914   (1.5%)

      Variable contribution                          433              413              4.8%               458               473             (3.2%)               66              142            (53.5%)    957    1,030   (7.1%)

      Operating expenses                           (122)             (118)             3.4%              (231)             (239)            (3.3%)             (44)              (76)           (42.1%)   (397)   (433)   (8.3%)

      EBITDA                                         311              295              5.4%               227               234             (3.0%)               22               66            (66.7%)    560     597    (6.2%)

      D&A                                           (53)              (49)             8.2%               (95)              (95)             0.0%              (40)              (45)           (11.1%)   (188)   (193)   (2.6%)

      EBIT                                           258              246              4.9%               132               139             (5.0%)             (18)               21          (>100.0%)    372     404    (7.9%)

      VC / Revenue %                               26.9%            26.1%              0.8%             38.5%             40.1%             (1.6%)            90.4%            95.3%             (4.9%)   33.3%   35.3%   (2.0%)

      Opex / Revenue %                              7.6%             7.4%              0.2%             19.4%             20.3%             (0.9%)            60.3%            51.0%              9.3%    13.8%   14.9%   (1.1%)

      EBITDA / Revenue %                           19.3%            18.6%              0.7%             19.1%             19.8%             (0.7%)            30.1%            44.3%            (14.2%)   19.5%   20.5%   (1.0%)

      EBIT / Revenue %                             16.0%            15.5%              0.5%             11.1%             11.8%             (0.7%)           (24.7%)           14.1%            (38.8%)   13.0%   13.9%   (0.9%)

      Capex                                          14                31            (54.8%)               45                81            (44.4%)               11               40            (72.5%)    70      152    (53.9%)

    Notes:
8   1.     All amounts are before significant items. Business results may not aggregate to Group total due to intercompany eliminations and unallocated items. (1H20 unallocated items $2m EBIT loss)
TABCORP HOLDINGS LIMITED - FIRST HALF RESULTS PRESENTATION for the six months ended 31 December 2020
LOTTERIES & KENO

    EXCELLENT GAME PORTFOLIO PERFORMANCE, UNDERPINNED                                              $m                            1H21            1H20          Change
    BY BASE GAMES AND STRONG DIGITAL GROWTH                                                        Revenues                      1,609           1,584          1.6%

                                                                                                   Variable contribution          433               413         4.8%
    o Continuing benefits from game development and active portfolio management:
                                                                                                   Operating expenses            (122)           (118)          3.4%
           • Successful changes to Set For Life and Saturday Lotto
                                                                                                   EBITDA                         311               295         5.4%
           • Acceleration of jackpot sequences following lift in sales at all jackpot levels
                                                                                                   D&A                           (53)               (49)        8.2%
    o All base games sales increased significantly during COVID-19                                 EBIT                           258               246         4.9%

    o Revenue growth despite cycling very strong Powerball jackpot sequences in 1H20, below        VC / Revenue %                26.9%           26.1%          0.8%
      average sequences for jackpot games in 1H21 and timing of $30m Saturday Super Draw           Opex / Revenue %              7.6%            7.4%           0.2%

    o Customer led strategies delivering enhanced customer experiences, increased digital          EBITDA / Revenue %            19.3%           18.6%          0.7%
      conversion and greater integration with retail
                                                                                                   EBIT / Revenue %              16.0%           15.5%          0.5%
             • Digital growth of 20.9% and improved reseller arrangements helped lift margins
                                                                                                             1H21 REVENUE BY PRODUCT1 (%)
             • Omni-channel program continued to deliver for retailers and helped drive improved
               customer experiences                                                                                 5%                   Powerball
                                                                                                               5%                                               Jackpot
                                                                                                                                         Oz Lotto               games
    o Very strong Keno performance – retail rebounding post re-openings; digital continued at             7%               29%
                                                                                                                                         Saturday Lotto &
      elevated levels                                                                                   7%
                                                                                                                                         Mon / Wed Lotto &
                                                                                                                                         Mon / Wed Lotto
                                                                                                                                         Saturday Lotto
                                                                                                                                         Keno
                                                                                                                                                                Base
                                                                                                                                         ISI
                                                                                                                                         Instant Scratch-Its
                                                                                                                                                                games
                                                                                                                           14%           Set For Life
                                                                                                                                         SFL
                                                                                                             33%
    Notes:
9                                                                                                                                        Other
    1.     Gross subscriptions (including commissions and master agent fees) less prizes payable
TABCORP HOLDINGS LIMITED - FIRST HALF RESULTS PRESENTATION for the six months ended 31 December 2020
POWERBALL & OZ LOTTO MAJOR JACKPOTS
                                                                                                                             26
                                                                                                           23                                     23

          LOTTERIES & KENO KPIs                                                                               6
                                                                                                                              8
                                                                                                                                                  8                  16             15
                                                                                                                                                                      3
                                                                                                                                                                                     4
                                                                                                           17                18
                                                                                                                                                  15                 13             11
     BALANCED PORTFOLIO AND STRATEGIC INITIATIVES DELIVERED
     GROWTH IN A PERIOD OF LOW JACKPOTS                                                                   1H19             2H19                 1H20                2H20           1H21
                                                                                                         Number of jackpots $15M - $49M                Number of jackpots $50M or more
     LOTTERIES
                                                                                                        CUMULATIVE JACKPOT VALUE OFFERED2 ($M)
     o Strong performance during COVID-19 across all games with gambling entertainment and
       discretionary expenditure category shifts evident                                                                   1,191                1,256
                                                                                                         1,043
                                                                                                                                                  339
     o Strength in base draw games (all up over 20%) and positive response to game changes                364               608                                      708            711
              • Instant Scratch-Its growth (+39%) supported by product initiatives and significant                                                                   206            233
                                                                                                                                                  917
                supply chain changes                                                                      679               583                                      502            478

     o Jackpot game like-for-like sales up over 20% for both games; absolute sales down due to           1H19              2H19                 1H20                2H20            1H21
       jackpot sequences                                                                                                              Powerball          Oz Lotto

              • Powerball (-18%) – cycling two Division 1 records in 1H20 ($110m, $150m)                              DIGITAL SHARE OF TURNOVER3
                                                                                                                                                                                        32.1%
              • Oz Lotto (-6%) – less than half the number of large jackpots vs pcp (4 vs 9)                                                       26.7%
                                                                                                                                                                       29.6%
                                                                                                                               25.3%
                                                                                                              21.5%                                            19.9%
     o Continued digital growth: 1H21: 32.1% of Lotteries turnover (1H20: 26.7%)                                                                                                17.1%

              • 3.7m1 active registered players (+2.8%)                                                5.4%             5.7%                6.9%

              • PayPal adoption aided conversion rates
                                                                                                          1H19             2H19                 1H20                2H20            1H21
     KENO                                                                                                                                Keno           Lotteries

                                                                                                     TURNOVER GROWTH ON LIKE-FOR-LIKE OFFERS
     o Keno revenue up 12.8% due to very strong digital performance despite impacts from
                                                                                                                 (1H21 vs 1H20)
       venue closures and constraints
                                                                                                                                  4
                                                                                                      Powerball (like-for-like)                            28%
              • Digital sales +183.4%                                                                                             4
                                                                                                       Oz Lotto (like-for-like)                         22%
                                                                                                                                  5
              • Retail up 5-10% in northern states; Greater Melbourne re-opened in November 2020        Saturday Lotto (pcp)             21%           6% 27%

     Notes:                                                                                           Mon / Wed Lotto (pcp)                              24%
     1.     Active registered players measured on a rolling 12 month basis
     2.     The cumulative value of all Division 1 offers for Powerball and Oz Lotto draws                    Set for Life (pcp)             33%                     25%        58%
     3.     ACT Keno only. NSW in-venue mobile now decommissioned
10   4.     Powerball and Oz Lotto 1H20 adjusted to reflect comparable jackpot sequences             Instant Scratch-Its (pcp)                                       39%
     5.     Saturday Lotto adjusted for $30m Megadraw (1H21: 2-Jan-21 vs 1H20: 28-Dec-19)                                                                           Game/price change
LOTTERIES & KENO – ACTIVE PORTFOLIO MANAGEMENT

     MATERIAL LIFT IN TURNOVER POST WELL RESEARCHED AND PROMOTED GAME CHANGES
                                                                                                                                                    TURNOVER ($M)
                                                                            SET FOR LIFE
                                                                            o Launch: Late March 2020                                                   +52%

                                                                            o Division 2 prize: $5k/month for 1 year                                              +22%
                                                                                                                                                                         6.7
                                                                              = $60k
                                                                                                                                                     +25%
                                                                                                                                                            5.5
                                                                            o Matrix change increased number of
                                                                              winners                                                         4.4

                                                                            o 9% price increase (from 55c to 60c),
                                                                              with 278% price retention1

                                                                                                                                         Pre change    Post change       1H21
                                                                                                                                                               2
                                                                                                                                        (Jan-Mar 20)    (Apr 20 )    (Jul-Dec 20)

                                                                            SATURDAY LOTTO                                                              WEEKLY

                                                                            o Launch: October 2020                                     +31%
                                                                                                                                                                               +24%
                                                                                                                                                +14%
                                                                            o Division 1 prize up from $4m to $5m                                       29.3
                                                                                                                                                                                         110.7
                                                                                                                                 +15%
                                                                            o Division 6 change doubled number                           25.7                            89.6
                                                                              of winners
                                                                                                                          22.3
                                                                            o 15% price increase (from 65c to
                                                                              75c), with 93% price retention1

                                                                                                                       Pre COVID:      Pre change: Post change:      Pre COVID &      Post change
                                                                                                                           $4m             $4m         $5m              change         (2-Jan-21)
                                                                                                                       (Jan-Apr 20)   (May-Sep20) (Oct-Dec 20)       (28-Dec-19)

                                                                                                                                      BASE WEEK                            $30M DRAW

     Notes:
11   1.     Price retention = estimated revenue increase / price increase
     2.     30 March 2020 to 14 April 2020
LOTTERIES & KENO: FY21 KEY FOCUS AREAS

            GAME PORTFOLIO

      o   Oz Lotto game change being explored; research and development to be completed
          in FY21
      o   Initiatives across the Instant Scratch-Its category to build on strong FY20 momentum
      o   Monitor and manage accelerated jackpot offers in light of strength of jackpot games

            CUSTOMER EXPERIENCE

      o   Continue retail roll out of the Lott brand refresh

      o   The Lott app expected to be available in the Google Play store in 2H21

            DISTRIBUTION

      o   Expand omni-channel program into South Australia post enabling legislation and
          regulatory approval

      o   Continued improvement in payment options for players

      o   Ongoing support of retail partners through the challenge of COVID-19 and
          maintaining COVID-safe operations

12
WAGERING & MEDIA

     SOLID UNDERLYING PERFORMANCE IN A DISRUPTED OPERATING                                                         $m                           1H21          1H20         Change
     ENVIRONMENT                                                                                                   Revenues                     1,189         1,180            0.8%

     o Significant shifts from retail to digital during COVID-19                                                   Variable contribution         458           473          (3.2%)

                • Strong digital growth in turnover (+43%) and revenue (+34%) in an increasingly                   Operating expenses           (231)         (239)         (3.3%)
                  digital market, although some loss of market share                                               EBITDA                        227           234          (3.0%)

     o Retail remains a profitable and valuable channel, but was heavily impacted by COVID-19                      D&A                          (95)          (95)             0.0%
       related shut downs and other restrictions                                                                   EBIT                          132           139          (5.0%)

                • Retail turnover recovering as venues reopen and progressively return to normal                   VC / Revenue %               38.5%         40.1%         (1.6%)
                  capacity (ex-Victoria down 9%)                                                                   Opex / Revenue %             19.4%         20.3%         (0.9%)

     o Unfavourable net earnings impact of c.$25m from:                                                            EBITDA / Revenue %           19.1%         19.8%         (0.7%)

                                                                                                                   EBIT / Revenue %             11.1%         11.8%         (0.7%)
                • Retail closures including lost media revenue, net of COVID-19 cost mitigations

                • Data centre outage (7 and 8 November)                                                             1H21 WAGERING TURNOVER BY CHANNEL (%)

                • Partially offset by favourable US election result                                                                        8%

     o Marketing and generosity program enhanced to deliver improvement in active customer                                                                            Digital1
       growth and engagement in a very competitive market; VC margin lower as a result
                                                                                                                                  31%
                                                                                                                                                                      Retail
     o Disciplined expense management
                                                                                                                                                        61%
                                                                                                                                                                      Other 2
     Notes:
     1.     Digital includes digital and call centre, channels in which a customer transacts using their account
13   2.     Other comprises On-course, Premium Customers and PGI
Turnover2                       Revenue2
                                                                                                                                                                         Change on pcp %
                                                                                                                                                                                                 Digital3       Retail        Digital3       Retail

            WAGER IN G & MED IA KPIs 1                                                                                                                                   Wagering (1H21)           43%          (28%)          34%           (29%)

                                                                                                                                                                                     QUARTERLY ACTIVE USERS4 (‘000)
      BUSINESS RESILIENT THROUGH COVID-19; STRONG DIGITAL
                                                                                                                                                                                                                                             634
      GROWTH BUT FURTHER IMPROVEMENT NEEDED
                                                                                                                                                                                             547
                                                                                                                                                                                                                                484
      o Our business is different                                                                                                                                                                                  444
                                                                                                                                                                           412                           413

                 • We are a multi-channel business with higher regulatory complexity that impacts
                   speed to market and narrows margins
                                                                                                                                                                            1Q20        2Q20         3Q20         4Q20          1Q21        2Q21
      o COVID-19 significantly disrupted retail
                                                                                                                                                                                            DIGITAL MARKET SHARE3,5
                 • This was challenging for TAB and favourable for our digital-only competitors
                                                                                                                                                                                        33.5%
                                                                                                                                                                            30.3%                     30.8%
                 • Retail remains a valuable channel, including for digital acquisition                                                                                                                           28.9%        27.8%       26.5%

                 • Retail has bounced back well as restrictions have eased
                                                                                                                                                                                        25.0%         23.6%       23.2%                    22.3%
                                                                                                                                                                            21.7%                                              20.2%
      o We acted in the right way for our business during this highly abnormal period

                 • Strong digital and customer growth – c.$5b digital sales (61% of business)
                                                                                                                                                                                                            COVID-19
                 • However our competitors had stronger digital growth                                                                                                      1Q20        2Q20          3Q20        4Q20         1Q21         2Q21
                                                                                                                                                                                 Turnover          Revenue                 Pre COVID-19 average
                 • A predominately digital market and condensed event calendar drove heightened
                   generosities across the market                                                                                                                                               FIXED ODDS YIELDS

      o Significant investment in multi-channel digital offering during integration, however there is                                                                       16.2%                    16.3%
                                                                                                                                                                                                                  17.2%                    16.5%
                                                                                                                                                                                        15.8%
        more to do. Strong pipeline of customer initiatives to come                                                                                                         (1.2%)
                                                                                                                                                                                        (1.8%)
                                                                                                                                                                                                     (1.2%)       (2.6%)       15.0%
                                                                                                                                                                                                                                           (2.8%)
                                                                                                                                                                                                                               (2.2%)
      o Further structural reform to level the playing field is also important. Tabcorp will continue
        working to secure changes to license conditions and regulatory harmonisation
                                                                                                                                                                            15.0%       14.0%        15.1%        14.6%
                                                                                                                                                                                                                               12.8%       13.7%
     Notes:
     1.     Refer to Appendix 6 for additional KPI disclosures
     2.     Excludes Other (On-course, Premium Customers and PGI)
     3.     Digital includes digital and call centre - channels in which a customer transacts using their account
     4.     Number of users active within the relevant quarter. For comparability, prior period data adjusted to exclude duplication between TAB and ex-UBET customers
14   5.     Based on data supplied by industry partners which account for approximately one-third of the wagering market All data is before generosities. Prior year        1Q20        2Q20     3Q20             4Q20        1Q21          2Q21
            estimates adjusted where necessary to reflect updated data and to align with current measurement methodology                                                                    Generosities            Net yield
WAG ERI NG & MEDI A: F Y21 KEY F O CUS AREAS

     CUSTOMER EXPERIENCE ENHANCEMENTS BEING ACCELERATED POST INTEGRATION

        BROADEN CUSTOMER BASE,                                 TRANSFORM                                  STRENGTHEN DIGITAL &
      REINVENT MEDIA & GROW SPORT                           RETAIL EXPERIENCE                               EXPAND PRODUCT

      Launched new Racing content hub            Venue mode app feature and personalised           New data capability and Adobe driven
                                                   proximity based CRM in all TAB venues              personalisation engine
      Long term rights secured for NSW, Qld &
                                                  Digital-in-venue 1H21 turnover +54% ex Vic        Same Game Multi now available on 75
       Vic (digital) racing
                                                  Significant upgrade to venue mode feature          sports leagues
      US sport & international soccer vision      including:
       acquired (digital & in-venue)                                                                 New Racing Blackbook (with video replays)
                                                        •   Integrated venue specific food offers
      Launched Home of US Sports campaign to                                                        Personalised tote offers
                                                        •   Differential pricing capability
       attract new customers
                                                        •   Exclusive expert tips in real time       New tote product to be launched in 2H21
      Sports vision & content hub
                                                  Digital retail (no cash) pilot                    Live betting enhancements across digital
      New sports channel in retail                                                                   and venue
                                                  Ongoing optimisation of retail footprint

15
WAG ERI NG & MEDI A: A BET T ER BUSI NESS PO ST
         I N T E G R AT I O N A N D T R A N S F O R M AT I O N

     WAGERING & MEDIA BUSINESS IS NOW WELL POSITIONED TO PERFORM AND GROW

                                                     o   Integrated digital and retail customer
                                                         experience

                                                     o   New data capability and Adobe driven
                                                         personalisation engine

                                                     o   Single TAB platform and brand

                                                     o   Media delivering premium sports and
                                                         racing content digitally and in venue
                                                         integrated with Wagering

                                                     o   Growing and more diverse base of
                                                         active customers

                                                     o   Well established and growing B2B
     Source: 1H20 Results Presentation
                                                         presence in key overseas markets for
                                                         vision, data and co-mingling

16
GAMING SERVICES

     BUSINESS EXECUTING AGAINST TURNAROUND PLANS AS HOTELS                                          $m                          1H21     1H20     Change
     AND CLUBS RETURN TO OPERATION ACROSS THE COUNTRY                                                MAX Venue Services          33       102      (67.6%)
     o Revenue decline predominantly COVID-19 related
                                                                                                     MAX Regulatory Services     40       47       (14.9%)
               • Venues re-opened nationally from June 2020 under social distancing measures
                 (except for Victoria)                                                               Revenues                    73       149      (51.0%)

                                                                                                     Variable contribution       66       142      (53.5%)
               • Victoria (c.30% of revenues) was the key challenge – Greater Melbourne re-opened
                 in November 2020                                                                    Operating expenses         (44)      (76)     (42.1%)

                                                                                                     EBITDA                      22       66       (66.7%)
               • Suspended all fees during shutdown to support venues; once venues reopen, fees
                 are scaled up progressively to return to pre COVID-19 levels                        D&A                        (40)      (45)     (11.1%)

               • Revenues returning as states reopen and restrictions ease                           EBIT                       (18)      21      (>100.0%)

     o Cost base being addressed as part of turnaround plan                                          VC / Revenue %            90.4%     95.3%     (4.9%)

               • Initial phase of organisational restructure completed (1H21 savings: $3m)           Opex / Revenue %          60.3%     51.0%      9.3%

                                                                                                     EBITDA / Revenue %        30.1%     44.3%     (14.2%)
               • Stand-downs helped manage costs given loss of revenue
                                                                                                     EBIT / Revenue %          (24.7%)   14.1%     (38.8%)
     o Capital expenditure significantly reduced as part of turnaround plan and COVID-19
       mitigations
                                                                                                    Contracted EGMs1           Dec 20    Jun 20   Change
               • Programs curtailed to focus on core business priorities                             Victoria                   8,185    8,230      (45)

     o No material progress on extension of the remaining 50% of Victorian EGM contracts             NSW                        1,850    1,930      (80)
       beyond 2022 given current market uncertainties
                                                                                                     Total                     10,035    10,160     (125)
17   Notes:
     1.     MAX Venue Services contracts
GAMING SERVICES: FY21 KEY FOCUS AREAS

            O P E R AT I O N A L R E V I E W

      Operational Review / turnaround plan execution is well underway

      o   Leaner management and simplified operating structure

            •   Initial phase of restructuring complete

      o   Further extension of EGM contracts

      o   Develop and implement new products for core MAX Venue Services offer, targeting
          capex reductions

      o   Review and modify operating model of field services activities

            •   Plan developed and execution commenced in 2H21

      o   Streamline the product portfolio of the systems business

            •   Capital program reduced accordingly

      o   Focus on core monitoring activity within MAX Regulatory Services

            S T R AT E G I C R E V I E W

      o   Strategic Review paused due to COVID-19

18
03 - 06   Group Overview

TA B L E O F   08 - 18   Business Results
CONTENTS
               20        Capital

               22        Conclusion

               24 - 30   Appendices
C A P I TA L M A N A G E M E N T

     STRONGER FINANCIAL POSITION WITH GEARING NOW WITHIN TARGET RANGE; DIVIDENDS RESUMED

                                            GEARING1                                               DEBT PROFILE2                                               CREDIT RATING                                   o Undrawn bank facilities:
                                                                                                                                                                                                                 $1,510m at 31 December 2020
                                   Gross debt / EBITDA
     TARGET                                                                                Minimise cost of borrowing                                   Maintain investment grade                              o Two period covenant waivers
                                       2.5x – 3.0x
                                                                                                                      3
                                                                                                                                                                                                                 and adjusted limits remain in
                           31 Dec 2020: 2.8x                                            Average maturity : 5.8 years                                 S&P rating BBB- /stable                                     place at 31 December 2020,
                                                                                        Average interest rate : 5.3%
                                                                                                                             4
                                                                                                                                                                                                                 return to normal at 30 June
     METRIC                                                                                                                                                                                                      2021
                                                                                                                                                                                                               o Legacy 2010 USPP matured
                                                                                                                                                                                                                 (A$171m)
                             CAPITAL EXPENDITURE2                                                           ROIC5                                                   DIVIDENDS                                  o Working capital facility
                                                                                                                                                                                                                 cancelled ($226m)
                                                                                           Increase returns to cost of                                     70% – 80% of NPAT
     TARGET                  BAU range $200m – $240m
                                                                                             capital levels over time                                    (before significant items)                            o EBITDA to operating cash flow
                                                                                                                                                                                                                           6
                           1H21 BAU capex: $61m                                         ROIC: 6.0%                                                   1H21 interim dividend 7.5 cps                               conversion of 148%
                                                                                                                                                     fully franked                                                       • Benefited from deferred
                           1H21 non-BAU capex: $9m
     METRIC                                                                                                                                          Payout ratio: 80%                                                     Lotteries taxes (net
                           FY21 capex: $180m – $190m                                                                                                                                                                       $128m), prize reserve
                           FY21 D&A: $380m – $390m                                                                                                                                                                         levels and customer
                                                                                                                                                                                                                           account balances

                                                                                                                                                                                                                         • Deferred Lotteries taxes
                                                                                                                                                                                                                           of $242m to be fully paid
                                                                                                                                                                                                                           by the end of 3Q21
     Notes:
     1.     Refer Appendix 2
     2.     Refer Appendix 3
     3.     Based on available facilities
     4.     Based on drawn facilities (based on available facilities: 3.8%)
     5.     ROIC is an absolute measure, defined as earnings before interest, tax and significant items (EBIT before significant items), divided by the average invested capital base (being shareholders’ equity plus
            net economic debt). Earnings measured on a rolling 12 month basis. Average invested capital is calculated as an average of opening and closing balances. Invested capital base has been adjusted to
20          reflect the impairment charge recognised against goodwill in FY20
     6.     EBITDA / operating cash flow conversion excludes the impact of significant items
03 - 06   Group Overview

TA B L E O F   08 - 18   Business Results
CONTENTS
               20        Capital

               22        Conclusion

               24 - 30   Appendices
LOTTERIES & KENO

         CONCLUSION: THE TRUSTED
         G A M B L I N G E N T E R T A I N M E N T C O M PA N Y

     IMPROVED FINANCIAL POSITION AND OUTLOOK AS WE EMERGE
     FROM COVID-19
     o   Tabcorp has taken action to improve its financial position

           •   Strengthened balance sheet post capital raising

           •   Dividends resumed and payout policy reset
                                                                                                 WAGERING & MEDIA
     o   All businesses well positioned for the second half – as we emerge from COVID-19, we
         continue to unlock digital growth, drive operational improvements and optimise costs

           •   Lotteries & Keno – drive upside from increased digital penetration and develop
               Oz Lotto game change

           •   Wagering & Media – following the multi-year journey to integrate and transform
               capability and competitiveness, the Wagering & Media business is now
               positioned to perform and grow

           •   Gaming Services – executing operational review to lift profitability and
               performance; support licensed venues as they emerge from COVID-19
                                                                                                 GAMING SERVICES
           •   Optimisation program (3S) to drive operational improvements, accelerate savings
               and simplify the business

22
03 - 06   Group Overview

TA B L E O F   08 - 18   Business Results
CONTENTS
               20        Capital

               22        Conclusion

               24 - 30   Appendices
1 . S I G N I F I C A N T I T E M S ( A F T E R TA X )

     JUMBO PROFIT ON SALE
                                                                                                                                               $m                                                                                1H21
     o Tabcorp sold its shareholding in Jumbo Interactive for gross proceeds of
                                                                                                                                               Jumbo profit on sale                                                              (69)
       approximately $98m and recognised a profit after tax on the sale of $69m
                                                                                                                                               Amended tax assessment – MAX CMS Licence                                           69
     AMENDED TAX ASSESSMENT RE MAX CMS LICENCE1
                                                                                                                                               Racing Queensland arrangements                                                     11
     o Tabcorp received an amended tax assessment for the 2016 taxation year
                                                                                                                                               Tatts Group combination implementation costs                                       8
       regarding the income tax treatment of licence fees incurred by Tatts Group
       in relation to monitoring gaming machines in New South Wales. The                                                                       Restructure costs (3S)                                                             3
       amended assessment was for a total of $71m, including $9m ($7m net of                                                                   Total                                                                              22
       tax) in Australian Taxation Office imposed interest, and was paid in
       December 2020. Tabcorp has lodged an objection with the ATO and have
       disclosed a contingent asset in the Financial Statements
     RACING QUEENSLAND ARRANGEMENTS2
     o Tabcorp guaranteed minimum fees that RQ will receive under the deed of understanding with UBET Queensland in each calendar year from
       2018 to 2020 inclusive. A significant item expense of $11m (after tax) has been recorded in respect of 1H21, being the top up payment
       required to meet the minimum fee obligation for the final term of the agreement to 31 December 2020
     TATTS GROUP COMBINATION IMPLEMENTATION COSTS
     o Implementation costs are non-recurring costs and comprise restructure charges, integration management office and dedicated merger
       implementation resources. Implementation costs incurred to 31 December 2020 were $114m pre tax (or $80m after tax). Total implementation
       costs will not exceed $130m pre tax (or $91m after tax)
     RESTRUCTURE COSTS (3S)
     o Restructure costs have been incurred in 1H21 in relation to the Gaming Service Operational Review

     Notes:
     1.       Refer Note C5 in the Financial Statements for the half year ended 31 December 2020
24   2.       In the event Tabcorp is ultimately unsuccessful in the current dispute with Racing Queensland, further payments may need to be made by the Group. Refer to ASX Announcements dated 28 June 2019 and 24 July 2019
              and Note C5 in the Financial Statements for the half year ended 31 December 2020
2. CASH FLOW AND BALANCE SHEET

     CASH FLOW                                                                                                                     BALANCE SHEET
     $m                                                                           1H21               1H20             Change       $m                                                       Dec-20              Jun-20             Change

       Net operating cash flows1                                                   811                433                 87.3%    Total current assets                                        862                727               18.6%

       Net interest paid                                                           (91)               (98)                (7.1%)   Licences                                                   2,094              2,148              (2.5%)

       Income tax paid                                                            (138)               (98)                40.8%    Other intangible assets                                    8,137              8,134               0.0%

       Payments for PP&E and intangibles                                          (101)              (178)            (43.3%)      Property, plant and equipment                               410                456              (10.1%)

       Sub-total                                                                   481                 59            >100.0%       Other non current assets                                    592                951              (37.7%)

       Proceeds from sale of PP&E and intangibles                                   5                  1             >100.0%       Total assets                                              12,095             12,416              (2.6%)

       Proceeds from sale of shares in an associate                                 98                  -                  n/m     Total liabilities                                          5,367              6,389             (16.0%)

       Payment for other financial assets                                          (51)               (21)           >100.0%       Shareholders’ funds                                        6,728              6,027              11.6%

       Net proceeds from issue of shares                                           587                  -                  n/m     Net debt (reported)1                                       2,314              3,724             (37.9%)

       Ordinary dividends paid                                                       -               (194)                 n/m     Net debt (economic)2                                       2,282              3,399             (32.9%)

       Other                                                                       (2)                (3)             (33.3%)      Shares on issue (m)                                        2,217              2,032               9.1%

       Net cash flow                                                              1,118              (158)           >100.0%
                                                                                                                                   Ratios3

       Net debt at beginning of period                                            3,724             3,665                 1.6%     Gross debt4 / EBITDA (x)                                    2.8                3.8

       Non cash movements                                                         (292)                2            (>100.0%)      EBIT5 / Net interest (x)                                    3.2                3.3

       Net debt at end of period                                                  2,314             3,825             (39.5%)
                                                                                                                                   Notes:
                                                                                                                                   1.     Net debt (reported) includes lease liability of $329m (Jun-20: $353m)
                                                                                                                                   2.     Net debt (economic) includes USPP debt at the A$ principal repayment under cross currency swaps
     Notes:                                                                                                                        3.     Ratios calculated on a rolling 12 month basis
     1.     1H21 net operating cash flows include cash outflows of $16m relating to significant items (1H20 $16m). Also            4.     Gross debt includes USPP debt at the A$ principal repayment under cross currency swaps
            includes net benefit of $128m in deferred Lotteries taxes                                                              5.     EBIT excludes amortisation of the Victorian wagering and betting licence

25
3 . D E B T S T R U C T U R E A N D C A P I TA L E X P E N D I T U R E

                                                  DEBT STRUCTURE1 ($M)                            CAPITAL EXPENDITURE ($M)
     800
                                                                                                  152
     700
                                                                                                   30
     600

     500                                                                                           38

     400
                                                                                                                              70

     300                                                                                                      122              92
                                                                                                                              11
                                                                                                   65
     200
                                                                                                                              39        61
     100
                                                                                                   19
           -
                                                                                                                              11
               FY21 FY22 FY23 FY24 FY25 FY26 FY27 FY28 FY29 FY30 FY31 FY32 FY33 FY34 FY35 FY36    1H20                        1H21

                                 USPP (2012)                       Bank Debt   USPP (2018)       BAU L&K   BAU W&M   BAU GS   Non-BAU

      Notes:
      1.       Excludes $100m overdraft facility maturing in February 2022
26
      2.       Non-BAU capex: integration, data centre consolidation
4 . G R O U P O P E R AT I N G E X P E N S E S ( $ M )

                                                                                                             REPORTED -8.3%

                                                                                            UNDERLYING INCL 3S -0.2%

                                                                           UNDERLYING EXCL 3S +0.7%

                                                                                                                                        3
                                                                                                                                1   2

     Notes:
     1.       1H21 3S opex savings of $4m (Wagering & Media $1m, Gaming Services $3m)
     2.       1H21 COVID-19 cost mitigations of $24m (Lotteries & Keno $3m, Wagering & Media $4m, Gaming Services $17m)
27   3.       1H21 incremental cost synergies vs pcp of $6m (Lotteries & Keno $3m, Wagering & Media $2m, Gaming Services $1m)
5 . L O T T E R I E S & K E N O R E S U LT S

     $m                                1H21    1H20    Change

     Lotteries Revenue                 1,477   1,467    0.7%

     Keno Revenue                       132     117    12.8%

     Revenues                          1,609   1,584    1.6%

     Lotteries Variable contribution    360     347     3.7%

     Keno Variable contribution         73      66     10.6%

     Variable contribution              433     413     4.8%

     Operating expenses                (122)   (118)    3.4%

     EBITDA                             311     295     5.4%

     D&A                               (53)    (49)     8.2%

     EBIT                               258     246     4.9%

     Lotteries VC / Revenue %          24.4%   23.7%    0.7%

     Keno VC / Revenue %               55.3%   56.4%   (1.1%)

     VC / Revenue %                    26.9%   26.1%    0.8%

     Opex / Revenue %                  7.6%    7.4%     0.2%

     EBITDA / Revenue %                19.3%   18.6%    0.7%

     EBIT / Revenue %                  16.0%   15.5%    0.5%

28
6. WAGER IN G & MED IA KPIs

                                                                        1H21                1H20             Change
                                                1
     Turnover by distribution ($m)
     Retail                                                             2,595              3,612             (28.2%)
     Digital                                                            4,956              3,408              45.4%
     Call Centre                                                         211                 208               1.4%
     Other2                                                              640                 768             (16.7%)
     Total                                                              8,402              7,996               5.1%
                                          1
     Revenue by product ($m)
     Totalisator                                                         543                 587              (7.5%)
     Fixed Odds                                                          526                 491               7.1%
     Total Racing                                                       1,069              1,078              (0.8%)
     Sport                                                               114                 122              (6.6%)
     Trackside                                                            24                  37             (35.1%)
     Total                                                              1,207              1,237              (2.4%)
     Fixed Odds Yields
     Gross Yield                                                        15.6%              16.0%              (0.4%)
     Generosities                                                      (2.5%)              (1.5%)             (1.0%)
     Net Yield                                                          13.1%              14.5%              (1.4%)
     Net Racing Yield                                                   14.3%              15.6%              (1.3%)
     Net Sports Yield                                                    9.6%              11.3%              (1.7%)
     Other KPIs
     Wagering active customers3                                        777,000            688,000             12.9%
     Digital-in-venue turnover ($m)                                      252                 206              22.3%
     Retail turnover from SST (%)                                       59.9%              58.9%              +1.0%
     Sky Racing Active registered customers4                           47,000              22,000           >100.0%
     Sky venue subscriptions (#)                                        4,908              4,995              (1.7%)
     Sky races broadcast (#)                                           70,352              68,051              3.4%
     Notes:
     1.     Combined Wagering results only (excluding Media). TAB turnover and TAB revenue includes Victorian Racing Industry interest
     2.     Other turnover comprises On-course, Premium Customers and PGI
29   3.     Wagering active customers measured on a rolling 12 month basis. For comparability, prior period data adjusted to exclude duplication between TAB and ex-UBET customers
     4.     Reflects life to date Sky Racing Active registered customers. The comparable number at 30 June 2020 was 38,000
7. GLOSSARY

          TERM                                     DEFINITION                                     TERM                                     DEFINITION
                                                                                            Lotteries and   The Group’s business that operates lotteries and Keno, which are
     1H/2H          Six months ended 31 December/30 June of the relevant financial year
                                                                                            Keno (L&K)      games of chance
                    Three months ended 30 September/31 December/31 March/30 June of
     1Q/2Q/3Q/4Q                                                                            MAX             The Group’s Gaming Services brand
                    the relevant financial year
     3S             Optimisation - Simpler, Smarter & Stronger (3S)                         N/M             Not meaningful

     ACT            Australian Capital Territory                                            NPAT            Net Profit After Tax

     ASX            Australian Securities Exchange                                          OPEX            Net operating expenses
     BAU            Business as Usual                                                       PCP             Prior Comparison Period
                    The Tabcorp-Tatts combination which was implemented in December                         The Premier Gateway International joint venture operating from the Isle
     Combination                                                                            PGI
                    2017                                                                                    of Man

     CRM            Customer Relationship Management                                        POCT            Point of Consumption Tax

     D&A            Depreciation, Amortisation and impairment                               ROIC            Return on invested capital (refer Slide 19 for definition)
     DPS            Dividends Per Share                                                     RQ              Racing Queensland
                                                                                                            Part of the Group’s Media business, broadcasting racing and sport
     EBIT           Earnings Before Interest and Tax                                        Sky Racing
                                                                                                            throughout Australia and internationally
                    Earnings Before Interest, Tax, Depreciation, Amortisation and
     EBITDA                                                                                 TAB             The Group’s wagering brand
                    impairment
                                                                                                           The part of the Group’s wagering business acquired as part of the
     EGM            Electronic Gaming Machine                                               UBET
                                                                                                           Combination
                                                                                            Tatts or Tatts Tatts Group Limited (ABN 19 108 686 040) which was acquired by
     EPS            Earnings Per Share
                                                                                            Group          Tabcorp Holdings Limited in December 2017
     Financial year
                    The Group’s financial year is 1 July to 30 June                         The Lott        Umbrella brand for the entire lotteries business
     / FY
     Gaming         The Group’s business that provides services to licensed gaming venues
                                                                                            USPP            US Private Placement
     Services (GS) and EGM monitoring services

     Group          The Tabcorp group of companies                                          VC              Variable Contribution

                                                                                                         The Group’s business that operates fixed odds and pari-mutuel betting
                    A game of chance that is played approximately every three minutes and   Wagering and
     Keno                                                                                                products and services on racing, sport and novelty products, and racing
                    part of the Group’s Lotteries and Keno business                         Media (W&M)
                                                                                                         and sports broadcasting

30
DISCLAIMER

     This Presentation contains summary information about the current activities of Tabcorp Holdings Limited (Tabcorp) and its subsidiaries (Tabcorp Group). It should be read in
     conjunction with the Tabcorp Group’s other periodic and continuous disclosure announcements lodged with the Australian Securities Exchange (ASX), which are available
     at www.asx.com.au.

     No member of the Tabcorp Group gives any warranties in relation to the statements or information contained in this Presentation. The information contained in this
     Presentation is of a general nature and has been prepared by Tabcorp in good faith and with due care but no representation or warranty, express or implied, is provided in
     relation to the accuracy or completeness of the information.

     This Presentation is for information purposes only and is not a prospectus, product disclosure statement or other disclosure or offering document under Australian or any
     other law. This Presentation does not constitute an offer, invitation or recommendation to subscribe for or purchase any security and neither this Presentation nor anything
     contained in it shall form the basis of any contract or commitment.

     This Presentation is not a recommendation to acquire Tabcorp shares. The information provided in this Presentation is not financial product advice and has been prepared
     without taking into account any recipient's investment objectives, financial circumstances or particular needs, and should not be considered to be comprehensive or to
     comprise all the information which recipients may require in order to make an investment decision regarding Tabcorp shares.

     All dollar values are in Australian dollars (A$) unless otherwise stated.

     Neither Tabcorp nor any other person warrants or guarantees the future performance of Tabcorp shares or any return on any investment made in Tabcorp shares. This
     Presentation may contain certain 'forward-looking statements'. The words 'anticipate', 'believe', 'expect', 'project', 'forecast', 'estimate', 'likely', 'intend', 'should', 'could', 'may',
     'target', 'plan' and other similar expressions are intended to identify forward-looking statements. Indications of, and guidance on, financial position and performance are also
     forward-looking statements. Any forecasts or other forward looking statements contained in this Presentation are subject to known and unknown risks and uncertainties and
     may involve significant elements of subjective judgement and assumptions as to future events which may or may not be correct. Such forward-looking statements are not
     guarantees of future performance and involve known and unknown risks, uncertainties and other factors, many of which are beyond the control of Tabcorp, that may cause
     actual results to differ materially from those expressed or implied in such statements. There can be no assurance that actual outcomes will not differ materially from these
     statements. You are cautioned not to place undue reliance on forward looking statements. Except as required by law or regulation (including the ASX Listing Rules),
     Tabcorp undertakes no obligation to update these forward-looking statements.

     Past performance information given in this Presentation is given for illustrative purposes only and should not be relied upon as (and is not) an indication of future
     performance.

     This Presentation does not constitute an offer to sell, or the solicitation of an offer to buy, securities in the United States or in any other jurisdiction in which such an offer
     would be illegal. Neither the entitlements nor the New Shares have been, or will be, registered under the U.S. Securities Act of 1933, as amended (U.S. Securities Act), or
     the securities laws of any state or other jurisdiction of the United States. Accordingly, the entitlements may not be taken up or exercised by, and the New Shares may not be
     offered or sold to, directly or indirectly, persons in the United States or persons that are acting for the account or benefit of persons in the United States (to the extent such
     persons are acting for the account or benefit of a person in the United States), unless they are offered or sold in a transaction exempt from, or not subject to, the registration
     requirements of the U.S. Securities Act and any other applicable securities laws of any state or other jurisdiction of the United States.

31
You can also read