Tactical Thoughts Year End Review and 2020 Outlook
←
→
Page content transcription
If your browser does not render page correctly, please read the page content below

Tactical Thoughts
          Year End Review and 2020 Outlook

          As 2019 draws to a close, we reflect on what has been a
          remarkably strong year for investment returns. Although   Key Highlights
          we can never count out the possibility of a pullback in
          2020, the global economy looks to have turned a corner    − Supportive market
          and we should see a return to growth in the new year.       backdrop in 2020 and
          Rates are at all-time lows and this has been a helpful      improving growth outlook
          tailwind for asset prices around the world.                 and fundamentals should
                                                                      further boost investor
          Hobson Wealth Brand Ambassador, Mahé Drysdale, was          sentiment.
          at our Auckland office opening in mid-November and
          talked about all the hard work he continues to put in for − Asset allocation remains a
          his Olympic campaign next year in Tokyo. Mahé spoke of         key tenet to long term
          all the training sessions being about the ability to           wealth creation.
          withstand pain when it matters in the final leg of the race. − The impact of lower
          Likewise for us at Hobson, we believe the gradual build-       interest rates and factor
          up of resilience within a client’s portfolio should stand it   investing are topics we
          in good stead for when markets become more                     explore further.
          challenging. We do not think that the time is upon us yet,
          and we are pleased we recommended staying invested. In the short term, underperformance,
          just like an intense training session, can be painful but the benefits of good portfolio
          construction accrue at the time they are needed.

1 of 19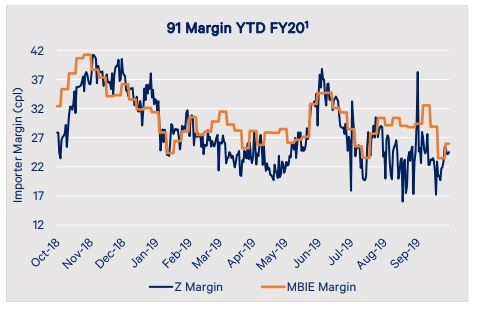
Table of Contents

          Foreword...................................................................................................................................... 3
          Executive Summary ...................................................................................................................... 4
          Recommended Tactical Asset Allocation ..................................................................................... 6
          Market Price Earnings Ratios ....................................................................................................... 7
          Market Outlook and Portfolio Positioning.................................................................................... 9
          Deal in Focus: Synlait Milk Bonds .............................................................................................. 14
          Hobson's Corner ……………………………………………………………………………………………………………………15

2 of 19
Foreword
As another year closes, we thank you for your continued support. 2019 has been a big year for
Hobson Wealth and pleasingly, investment markets have been co-operative. Many of you will
have visited our new premises in Auckland. It took months of planning and hard work, and would
not have been possible without you, our clients, and for whom we are especially grateful. Being
in a new and aesthetically pleasing office space has had a positive impact on staff and work
output and we look forward to continuing this for your benefit in 2020. We also launched our
new Navigator Fund series in October which you will hear more about in the coming months.
This time last year it would have been hard to predict that the Official Cash Rate would be at 1%
and our local equity market up almost +30% so far this year. The expectation that the All Blacks
would retain the Rugby World Cup in Tokyo failed to materialise. Congratulations to South Africa
who played a phenomenal tournament and achieved a well-deserved victory.
Despite the sizeable run-up in global equities this year, we don’t see a recession looming and
firmly believe clients will continue to be rewarded by staying invested. Despite interest rates
being at all-time lows, we value the benefit of bonds as ballast in a portfolio in the event of
uncertainty. We were pleased with our involvement in the recent Argosy Property and Synlait
Milk bond offerings and we were pleased to be able to accommodate those clients who had
interest in these bonds.
As Christmas fast approaches, we would like to thank you once again for your support.
Happy Holidays.
Warren Couilllaut – Managing Director
3 of 19Executive Summary
Global equity markets continued their climb in November, with the MSCI World Index closing at
an all-time high. Technology shares in the US in particular performed strongly during the month
with the benchmark NASDAQ Index up +4.5%. The US / China trade negotiations appeared to be
moving in the right direction over the course of the month and investor appetite improved as a
result. Boris Johnson’s Conservative Party victory in the UK general election on December 12th
is a strong endorsement of Brexit and we now expect a resolution in the coming months.
The S&P/NZX 50 Index rose +4.9% in November, its second highest monthly gain this year.
Retirement village operators rallied on the back of potential M&A activity in the sector, and
heavyweight offshore earners, Fisher & Paykel Healthcare and a2 Milk also contributed to the
index’s sharp move higher. FPH was up +15.6% in November after the breathing mask
manufacturer reported a +24.4% increase in first half profits. a2 Milk was +19.4% on the month
after encouraging comments were made at their AGM.
Overall, the S&P/ASX 200 Accumulation Index recorded a gain of +3.3%, which saw the index
close November just short of the all-time high. These gains occurred against a backdrop of
weakening earnings, and we have seen the one-year forward P/E increase through the course
of the year to currently 18.0x. Technology was the best sector on the ASX last month with Xero
and Afterpay strong performers. Following Technology, Healthcare and Consumer Staples
continued to outperform in a rising market.
The US equity market was particularly strong in November and outperformed most other major
markets. It reached record highs during the month on optimism over trade relations and a fresh
wave of M&A activity including LVMH buying luxury jeweller, Tiffany & Co. Investors were also
cheered by a resilient US economy, strong job growth and corporate earnings, putting the US
equity market on track for its largest annual rise since 2013.
President Trump said he was “very close” to a trade pact with Chinese President Xi Jinping as
officials in Washington and Beijing said they are moving closer to finalising a ‘phase one’ trade
pact. As we go to press, the US Federal Reserve has held its benchmark interest rate steady and
signalled no appetite to raise it anytime soon. After lowering rates at their three previous
meetings to guard the US economy from the effects of trade tensions and a global slowdown,
Fed officials indicated they were comfortable with leaving policy on hold through next year. This
is a positive signal for equities and we note it coincides with a pickup in the pace of the US
economy’s expansion, with data showing that GDP rose in the third quarter by more than initially
forecast.
European equity markets rallied for third consecutive month in November. Investor turned to
“risk-on” mode, after encouraging economic data was released and the hope that the US / China
trade dispute will eventually be resolved. Mario Draghi signed off after his final monetary policy
meeting at the European Central Bank last month with a call for unity on the ECB’s main aim of
boosting inflation. There was agreement that risks in the Eurozone were “still tilted to the
downside” which makes it an interesting time for Christine Lagarde, who replaced Draghi,
effective from November 1. At her first meeting as Chair in mid-December, we expect no change
to the current policy settings. Brexit continued to dominate headlines in the UK and the
Conservative Party victory in the election means Britain is likely to negotiate a deal early in the
new year.
Asian equities finished the month only slightly in the black as investors in the region were more
reserved in their expectations for a US-China trade deal. Although earlier in the month there
was hope a deal could be done, by month end, all hopes were dashed. The passing into US law
4 of 19of the Hong Kong Human Rights and Democracy Act, effectively giving protection to Hong Kong
protestors, may test China’s patience at a critical point in the prolonged negotiations.
Looking ahead into the first half of 2020, we believe the positive tailwinds to markets will
continue and therefore we remain bullish for now. Equity investors have stayed largely on the
side-lines this year as evidenced by outflows from global stock markets. We see an uptick in the
macro-economic outlook and do not see signs yet of a recession looming. Any truce on trade
between the US and China would be another catalyst for equities in general. Global
manufacturing data is expected to rebound and the easing bias of central banks is likely to
continue to filter through to the respective economies.
As we come into year end, with what could be the best yearly performance for the S&P/NZX 50
since its inception in 2003, we are glad we stuck to our call of staying invested. We remain
constructive on equities, both locally and internationally, and happily, are seeing more signs of
improving economic activity. Low interest rates and the potential that they may go lower, is
supportive for asset prices around the world. Any fiscal stimulus would further boost sentiment.
With an election year in both NZ and the US, and a yet to be resolved trade war between China
and the US, it must be remembered that risks to the downside are always present. Despite this
we believe it is prudent to stick with this investment cycle for some time yet.
5 of 19Recommended Tactical Asset
Allocation
Underweight Overweight
Asset Class Tactical Rationale
NZ Equities While we think Labour will do what they can to be re-
elected next year, following such a strong run we opt
to retain our Hold/Neutral call on NZ equities.
Australian Despite signs of life in the property market and the
Equities prospect of another RBA rate cut, we see headwinds
for the banks and resources.
US Large Cap The US stock market continues to offer the most
Equities compelling growth biased investment opportunities.
US Small Cap While a balanced Fed and positive economic data are
Equities supportive, we down-weight small caps as we believe
large caps offer more compelling exposure.
Developed World We are constructive on Europe but remain cautious
Equities on the UK despite the Conservative Party victory.
Japanese stocks are showing signs of upward
momentum and we upgrade to Overweight DM.
EM Equities We remain bullish on Emerging Markets on the back
of a stronger global economy, potential resolution on
trade, and ideally a weaker US$.
NZ Listed While we like the yield, we are cognizant of the
Property exceptional run this year and do not think that will be
repeated next year.
Fixed Interest Fixed Interest will always be a key component of client
portfolios but with rates at such low levels we believe
it prudent to move to Moderately Underweight.
Cash With the RBNZ explicitly stating their desire to keep
short term interest rates at low levels, we see little to
no benefit in holding excess cash.
6 of 19Market Price Earnings ratios
Price Earnings ratios 2014 – 2020*
Price/Earnings ratios are Bloomberg Best estimates for forecast year one.
Price Earnings ratios versus average*
NZ Australian US Large US Small Developed EM
Price Earnings*
Equities Equities Cap Equities Cap Equities World Equities
As at 30 November 25.8 18.0 19.6 31.8 15.3 13.8
10-year average 18.1 15.1 16.4 25.2 14.0 11.9
5-year average 20.5 16.2 18.1 26.8 14.9 12.5
*Price Earnings ratios are Bloomberg Best estimates for forecast year one.
NZ$ FX performance percentage returns to 30 November 2019
Currency Pair 1m 3m 6m 12m
NZ$/ US$ 0.1% 1.5% -1.7% -6.5%
NZ$/ AU$ 2.0% 1.0% 0.7% 0.8%
Source: Eikon, Bloomberg, November 2019.
7 of 19Index Returns to 30 November 2019
Index percentage returns in their currency
Asset Class Index 1m 3m 6m 12m
NZ Equities S&P/NZX 50 Gross NZ$ 4.9 5.2 11.8 28.3
Australian Equities S&P/ASX Accumulation 200 AU$ 3.3 4.8 9.2 26.0
US Large Cap Equities Russell 1000 Total Return US$ 3.8 7.8 15.0 16.1
US Small Cap Equities Russell 2000 Total Return US$ 4.1 9.1 1.7 7.5
Developed World Equities MSCI EAFE* US$ 1.0 7.2 8.6 9.1
EM Equities MSCI EM* US$ -0.2 5.7 4.2 4.6
NZ Listed Property S&P/NZX Property Gross NZ$ -0.4 -1.3 11.4 30.0
Fixed Interest S&P/NZX Corporate A NZ$ -0.1 -0.6 2.4 6.9
Cash ANZ New Zealand Call Rate NZ$ 0.1 0.2 0.6 1.5
Source: Eikon, Bloomberg, November 2019 (*not total return index).
Index percentage returns translated into NZ$
Asset Class Index 1m 3m 6m 12m
NZ Equities S&P/NZX 50 Gross 4.9 5.2 11.8 28.3
Australian Equities S&P/ASX Accumulation 200 1.2 3.3 8.4 24.9
US Large Cap Equities Russell 1000 Total Return 3.5 5.7 17.0 24.2
US Small Cap Equities Russell 2000 Total Return 3.9 6.9 13.6 15.0
Developed World Equities MSCI EAFE* 0.7 5.0 10.5 16.7
EM Equities MSCI EM* -0.4 3.6 6.0 11.8
NZ Listed Property S&P/NZX All Real Estate -0.4 -1.3 11.4 30.0
Fixed Interest S&P/NZX Corporate A -0.1 -0.6 2.4 6.9
Cash ANZ New Zealand Call Rate 0.1 0.2 0.6 1.5
Source: Eikon, Bloomberg, November 2019 (*not total return index).
Interest Rate and FX Forecasts as at 30 November 2019
Rate 4Q2019E 1Q2020E 2Q2020E 3Q2020E 4Q2020E
Australia Cash Rate 0.75 0.50 0.50 0.50 0.50
Australia 10yr govt 1.30 1.50 1.80 1.90 1.90
US Fed Funds Rate 1.50 1.50 1.50 1.50 1.50
US 10yr Treasury 1.80 2.10 2.50 2.50 2.50
NZD OCR 1.00 0.75 0.75 0.75 0.75
NZ 10yr Govt 1.40 1.65 1.95 2.05 2.05
NZ$/ US$ 0.640 0.650 0.650 0.645 0.640
AU$/ US$ 0.690 0.700 0.710 0.705 0.700
NZ$/ AU$ 0.928 0.929 0.916 0.915 0.914
EUR/ US$ 1.090 1.110 1.130 1.130 1.150
US$/ JPY 109.0 109.0 107.0 105.0 102.0
GBP/ US$ 1.300 1.300 1.300 1.320 1.350
Source; Macquarie Securities, November 2019.
8 of 19Market Outlook and
Portfolio Positioning
New Zealand equities
The New Zealand sharemarket was up strongly in November, returning +4.9% for the month.
The market was driven higher predominately by the outperformance of Fisher & Paykel
Healthcare (+15.6%) and a2 Milk (+19.4%), two of the biggest weights in the index. The S&P/NZX
50 Index’s performance now stands at +28.3% for year to date and looks set to break records
with one month to go in 2019. Since the advent of the S&P/NZX 50 in 2003, the record
performance for a calendar year was +25.1% in 2004.
Economic data this month surprised on the upside: BNZ business manufacturing picked up to a
mildly expansive 52.6 from a contractionary reading previously; REINZ housing data saw year-
on-year median price growth pick up to +8.2% nationally and +0.8% in Auckland; and retail sales
came in at +1.6% for the third quarter, ahead of expectations for +0.5%. Only third quarter
unemployment at 4.2% and building permits for October at -1.1% weakened.
Tactical Positioning
2019 does not feel like a bull market despite the almost +30% domestic equity rally. Earnings
have broadly been better than expected but what has driven a lot of this rally has been the shift
lower in interest rates. The Official Cash Rate was at 1.75% as recently as March this year and is
now at 1.00%. The rate was already low, but this is a further material reduction. This has caused
a rally in defensive, income yielding stocks which has driven the benchmark index much higher
than we anticipated this time a year ago.
We are now looking at what could be the best yearly performance for the S&P/NZX 50 since its
inception in 2003. We are glad we have stuck to our call of staying invested and we maintain our
recommendation of continuing to hold a full allocation to NZ equities. What is a little concerning
however is the fact that the strong index return is not necessarily the result of a broad based
rally across the entire New Zealand equity market. Many investors in our market are income
focused and passive flows and yield-seeking investors have pushed the market higher
particularly in the utility sector and high-dividend paying companies.
We remain constructive on the outlook for domestic equities but are somewhat cautious on
what we believe are elevated valuations. At 25.8x next year’s earnings – this is materially above
the 5 and 10-year averages. The domestic outlook is mixed and the Labour coalition is now
talking about fiscal stimulus to boost the economy further. Coming into an election next year
Labour will do what it can to be re-elected which could further boost investor sentiment.
However, looking at past election years in New Zealand, since the inception of the S&P/NZX 50,
there have been five years with general elections and only in three of them has the index
finished in positive territory. 2019 has been a stellar year, and we do not think this will be
repeated in 2020. We are therefore Neutral on NZ Equities rather than Overweight.
Australian equities
The Australian equity market was up +3.3% in November, outperforming buoyant global
markets which saw the MSCI All Country World Index up +2.7%. Banks continued to struggle this
month as weaker operating trends, the possibility of more capital raisings, and AUSTRAC’s civil
proceedings against Westpac dragged on the sector; four out of the five worst performing stocks
9 of 19in the ASX 100 were banks. The weakness in banks meant that the Financials sector (-2.0%) was
the worst performing sector in the market, edging out Utilities (-0.5%).
Economic data for the month was largely in line with expectations and similar to previous
readings with a few exceptions: Westpac Consumer Confidence increased +4.5%, reversing
some of the previous months -5.5% decline; building approvals also rebounded +7.6% after a -
1.1% fall the previous month; and the RBA’s index of commodity prices was up by the biggest
monthly margin since April 2010.
The RBA left rates unchanged at 0.75% in November. The RBA’s statement stayed close to the
script but leaving the option for quantitative easing if stimulus was needed. Macquarie is pricing
in one cut in early 2020 but speaking with a number of active managers who were recently in
Auckland, in their view, it now does not matter so much if the RBA does not cut further. Cuts to
date are working and even the credit squeeze, which has made it hard to access funding, is
starting to thaw a little. The recovery in property has sent building stocks higher but mining is
yet to turn as profitability in the sector has been under pressure. The 25% fall in the price of
Nickel in the last three months is evidence of this.
While we may be seeing early signs of a turning point, we remain hesitant on the outlook for
Australian corporate earnings growth next year. Interest rate cuts and tax cuts are no match for
high household debt and low wage growth. Manufacturing data has been resilient but valuations
are pushing to extreme levels. Ex-resources, and based on Macquarie data, ASX stocks were on
a forward P/E of 19.2x at the end of November, close to the highest since 1960. If you exclude
Banks, Insurance and REITs, the P/E is closer to ~24x. The rise is largely driven by lower global
bond yields, and demand for high dividend yield from, particularly, the ASX Industrials sector.
Tactical Positioning
Despite signs of life in the property market and the prospect of another RBA rate cut, we see
headwinds for the banks and resources. We expect volatility to persist and with downgrades
likely coming, we see a growing risk of downward moves in stock prices. We therefore maintain
our call to stay underweight the Australian equity market.
International equities (excluding Australia)
US equities
The US equity market ended November in positive territory after reaching record highs earlier
in the month. Both the S&P 500 and the Dow Jones Industrial Index have benefited from a US
Federal Reserve that has put interest rate rises on hold for the foreseeable future. Investors
have been buoyed by a resilient US economy, putting the US equity market on track for its
largest annual rise since 2013.
The big overhang is the uncertainty relating to President Trump’s spat with China on trade. The
trade war has escalated into a larger conflict between China and the US, and the West, and now
involves not just trade in goods, but also technology, intellectual property protection,
investment flows, industrial policies, and potentially much more. The back and forward nature
of the negotiation has been very hard for investors to gauge progress but recently US investors
have been buoyed by optimism about a potential “phase 1” deal. However, despite weeks of
ongoing negotiations, no concrete details have emerged.
10 of 19Tactical Positioning
With the US Fed on hold, we expect a relatively restrained outlook for the 10-year US Treasury
yield next year in the 1.75 - 2.00% range. This should translate into a stable environment for US
equities and an environment that is maybe more about stock picking rather than a call on the
interest rate setting and how that affects investor sentiment. We still prefer large caps over
small caps.
We are optimistic about the continued investment case for US equities for next year. In fact, we
are seeing signs of a “melt-up” scenario materialising, which should get more investors off the
sidelines. Retail sentiment is not exuberant and we have seen consistent outflows from US
equity funds this year. Hedge fund positioning is also light, so we expect the outflows to reverse
as the year progresses. Markets have been buoyed by the prospect of a “phase 1” deal reached
with China and if that materialises, then we would expect US equities, particularly large caps, to
be well-bid. It is for this reason, we up-weight our call on US large caps and down-weight our
call for US small caps. Unfortunately, most money flows have been to the larger US companies
and we think this trend is unlikely to change in 2020.
Developed World equities
The MSCI World Index of Developed Markets excluding the United States is up +19% year to
date. Without feeling like a bull market, equities round the world have rallied and many investors
feel like they have not truly participated in the rally. Investor sentiment is not euphoric,
positioning is light, bond yields are down and defensive stocks have led the market higher.
Having secured victory in the general election on December 12th , all eyes are on Boris Johnson
to see if he can, once and for all, end the multi-year political deadlock. This would revive investor
interest for UK equities and deliver more certainty for the Eurozone too. We look forward to
seeing how this eventuates over the coming days and weeks.
At this stage we prefer Europe to the UK as we believe the Continent offers more leverage to a
recovery in global growth which we see playing out in 2020. The decision (or not) to leave the
European Union has generated a substantial increase in macro-economic uncertainty in the UK.
This has depressed business investment which has had the cumulative effect of severely hurting
business formation, and confidence within the small and medium enterprise sector.
Japanese equities have rebounded strongly in the last few months, reversing the negative trend
experienced earlier in the year. A positive global industrial backdrop is supportive of Japanese
equities and a further tailwind would be a weaker yen. Tokyo hosts the Olympics next year and
this may be why we are seeing momentum build in Japanese equities. Prime Minister Shinzo
Abe has announced a stimulus package of almost US$240bn to support growth in an economy
contending with an export slump, natural disasters and the fallout from a recent sales tax
increase. The measures are aimed at boosting GDP and protect against downside economic risks
and prepare the country for longer-term growth after the Olympics.
Tactical Positioning
In the Eurozone, we see growth picking up gradually over the course of next year as external
headwinds ease and the impact of policy stimulus begins to be felt. We expect only a modest
recovery but this should be enough to drive returns higher for equity investors.
While we believe the Conservative Party’s sizeable majority in the December election is a major
endorsement of Britain’s desire to leave the EU, we stay underweight the UK specifically until
we see more clarity. We expect the UK to exit in the first quarter next year, but we remain
cautious of the possibility of a “No Deal Brexit”. The risks to free-flowing trade between the UK
and the Continent are not insignificant and we believe this uncertainty may persist for longer
11 of 19than expected. That being said, an end to the multi-year deadlock could revive investors’
appetite for the UK and we expect at some point next year to turn bullish on the UK, and not
just the Eurozone at this time.
Japan remains cheap on a valuation basis and global investor positioning is light. Foreign
investors have sold the most Japanese equities in 2019 since 1984 and only now are we seeing
some of these flows return coming into year-end. We see the positive momentum for Japanese
stocks continuing in 2020.
Emerging Market equities
Emerging Market equities have had a challenging 2019. Trade tensions and a stronger than
expected US dollar have been the main headwinds. In the last couple of months, as the outlook
for global growth has begun to improve, we have seen some small gains. Unfortunately, these
gains were short-lived in November as sentiment turned negative due to a mixture of economic,
political and corporate factors. Plagued with strikes and anti-government protests across the
region, Latin American equity markets, along with their respective currencies, came under the
most pressure. Chile has been the worst performer as the riots there forced the cancellation of
the APEC meeting that was to be hosted in Santiago. Brazil also lost ground on concerns that the
protests in Chile could spill over to Brazil and force the government to water-down their reform
agenda. By comparison, equity performance in Asia and EMEA (Europe, Middle East and Africa)
has been more mixed.
Chinese leadership may have struggled to predict which way Trump will turn on trade during
2019 but Chinese equities, with the exception of Hong Kong, have performed well relative to
other Asian and global markets. To an extent they are pricing in a deal being done. Domestic A-
share markets, particularly Shenzhen, have benefited from ongoing inclusion in global indices
and the Government’s stimulus measures helping to counter any potential trade-related
slowdown.
Tactical Positioning
While our positive call on Emerging Markets for 2019 did not materialise, we remain
constructive over a longer-term timeframe. The direction of the US dollar remains one of the
key drivers of Emerging Market equity performance. A strong US dollar has pressured EM
equities but we feel that could be about to turn next year. Under our Hobson Wealth Asset
Allocation model, we aim to maintain a small allocation to Emerging Markets in all but the most
conservative portfolios. We believe that while Emerging Markets do present downside risk, they
also offer the most upside if they stage a turnaround. Valuations are cheap, global investors are
underweight, and a weaker US dollar will be positive for stocks in these regions. We maintain
our call on being invested in Emerging Markets.
New Zealand listed property
The NZ listed property sector has had a weaker 4th quarter to this point but it is important to
note that this is in the context of a sector that has delivered a +30% return over the last 12
months. Overall YTD performance has been buoyed by falling bond yields, while exposures to
industrial properties remains the preference of the sector. The lower-for-longer interest rate
rhetoric should continue to see solid demand for equity yield but acknowledges that elevated
returns in 2019 would appear difficult to repeat in 2020. We maintain our preference for holding
listed property companies with high quality assets.
12 of 19Tactical Positioning
We move to an Underweight recommendation for New Zealand listed property. While we like
the yield, we are cognizant of the phenomenal run in 2019 and do not think this is likely be
repeated in 2020.
Fixed Interest and cash
It has been another solid year in 2019 for our domestic bond market. We continue to see new
borrowers raise money through our debt capital markets and many of these corporates will be
well known to our investors. Companies such as the aged care provider Metlifecare, and Synlait
Milk are two recent examples.
Despite all the talk around the potential for higher interest rates in 2019, this ultimately has not
materialised. In fact, central banks globally have embarked on further interest rate cuts to try
and stimulate growth and shore up confidence in financial markets. Locally, the RBNZ reduced
our official cash rate (OCR) down to 1.00%, after starting the year at 1.75%. Persistently lower
inflation and slowing global growth have been some of the reasons cited by Governor Orr.
Interest rate markets globally have ‘back-tracked’ swiftly when we consider this time last year
there was a growing belief that 2019 would finally be the year that would usher in higher interest
rate settings. In fact, the opposite has happened. The Federal Reserve in the US has been forced
to ease (reduce) interest rates despite a domestic economy that appears to be on a far firmer
footing. However, in order to stay competitive globally, and with the US-China trade war
continuing, the Fed has taken the path of least resistance. The US 10-year benchmark bond yield
has traded within a 1.45% - 2.55% range (currently ~1.84%) for much of 2019, now settling closer
to the bottom of that range as equity market volatility and softer central bank rhetoric has
started to have an impact. The recent moderation has market pricing continuing to question
global central banks’ willingness to raise interest rates and remove monetary policy stimulus.
We think a breakthrough higher above this recent range will need support from underlying
economic data.
Tactical Positioning
We move to a Moderately Underweight tactical position in Fixed Interest as we are mindful of
what is a backdrop of historically low interest rates. Fixed Interest will always be a key
component of client portfolios, but we are mindful that it will be difficult to move interest rates
materially lower from here short of a global shock; and are therefore are happy to allocate to
bonds on a case by case basis.
13 of 19Deal in Focus: Synlait Milk Bonds
It has been another noteworthy year for NZ debt capital markets, and we take this opportunity
to highlight the $NZ180m Synlait Milk subordinated bond deal in which Hobson Wealth was
mandated for the Co-Manager role.
Synlait has grown from a dairy manufacturing start-up back in 2009 to now producing 146,000
metric tonnes (MT) of milk solids in 11 years, growing top line revenue by a 25% compound
annual growth rate (CAGR) since FY09. This exceptional growth has seen revenue exceed $1
billion for the first time in FY19.
Synlait (SML) has a clear growth strategy of ‘doing milk differently’ and developing a world class
value chain. This includes significant investment in infant nutrition, their ingredients business
and everyday dairy products.
In order to help achieve this objective, Synlait, through their capital management programme
embarked on an inaugural domestic bond deal with the help of retail and institutional investors.
Key highlights of the deal:
• NZ$180 million raised in what was Synlait’s first foray into the domestic bond market
• Synlait is an NZX and ASX listed company with an NZX market capitalisation of NZ$1.7
billion that produces a range of nutritional milk products for global customers, including
their largest customer, the a2 Milk Company
• A straight 5-year maturity that is line with their recently extended exclusive supply
agreement with the a2 Milk Company
• Internal policy to maintain shadow investment grade credit metrics through the cycle –
targeting a total leverage ratio of less than 2.5x over the long term
The company is executing a number of large-scale capital projects supported by new and existing
customer commitments and acquisitions including Talbot Forest Cheese and Dairyworks.
Synlait is investing for the future and it is great to be involved to help them do this.
14 of 19Hobson’s Corner
Cost of Equity and Impact on Valuations
Ed Glennie - Investment Strategist
As the S&P / NZX 50 Gross Index heads into year-end at all-time highs, the doomsayers grow
louder declaring that the market is too expensive and surely it must drop sometime soon. While
we agree it is naive to think the market will stay elevated forever, it is also useful to understand
some of the reasons why prices are so high.
One reason valuations are higher is because of the macro-economic backdrop. Interest rates are
low and inflation is largely non-existent. Historically, when interest rates and inflation are low,
valuations tend to be higher. Intuitively, investors require a return above interest rates for
investing in the equity market and so when interest rates are higher, the return required to
invest in equity is higher. When rates and inflation are low, investors should be content with a
low return. In practice, this means investors bidding up share prices, paying high prices and in
doing so potentially reducing their future returns.
Valuations can be helpful for setting reasonable expectations for investors because higher
valuations typically lead to lower long-term returns while lower valuations typically lead to
higher returns. The stock market's reaction to interest rates is generally immediate, but the
economy usually lags by up to 12 months. Credit becomes less expensive with lower rates which
in many cases positively affects earnings and stock prices.
As the economy has slowed both here and abroad, the RBNZ has cut the cash rate to stimulate
economic activity. A decrease in interest rates is a catalyst for growth because borrowing rates
come down which, in turn, should lead to greater profits and a more robust economy.
Consumers tend to spend more, as lower interest rates make them feel wealthier because they
can afford to borrow more. Businesses can finance themselves at a cheaper rate, thereby
increasing their future earnings potential, which, in turn, should lead to higher stock prices.
Big winners of the lower cash rate in NZ have been the high dividend-paying stocks such as the
gentailers, listed property sector and bonds. As the cost of funding has come down, we have
observed investment houses lowering their discount rates which they use to value the long-term
cash flows of companies. This results in a higher target price for a particular stock because the
rate used to discount the cashflows is smaller, hence the value is higher. What may also happen
is that if rates drop even further and the discount rate comes down too, then investors could
still be prepared to pay even more for assets. Traditional metrics such as Price / Earnings ratios
are less relevant in a world where funding costs are low and investors are willing to pay higher
and higher prices. This combined with the rise of passive flows where the buyer may be less
sensitive to underlying fundamentals (and valuations) means the market gets pushed ever
upwards.
We have also seen off-shore investors who have access to even lower funding lines pay higher
prices than what local investors were prepared to pay. The acquisitions of Tip Top ice-cream and
Trade Me by overseas interests are examples of this.
Although the relationship between interest rates and the stock market is indirect, the two tend
to move in opposite directions. As a general rule of thumb, when the RBNZ cuts interest rates,
it causes the stock market to go up and when the RBNZ raises interest rates, it causes the stock
market as a whole to go down. But there is no guarantee how the market will react to any given
interest rate change the RBNZ chooses to make. That being said we are still of the view that
rates will be lower for longer - so long may the rally in stocks continue!
15 of 19Petrol Price Farce
Mark Fowler – Head of Investments
If we are led to believe the latest rumblings coming out of the current Government, apparently
fuel prices through competition could be expected to drop 18 cents to 32 cents a litre because
of new petrol company rules breaking the supply dominance of the big fuel companies.
This is premised on the Commerce Commission finding that major petrol suppliers will need to
change how the wholesale fuel supply market works, essentially to improve competition.
So how has this figure been calculated?
According to Consumer Affairs Minister Kris Faafoi: "Those are examples of what happens when
competition does happen." One of 'those' examples he is referring to is an 18c price drop in
Wellsford petrol when Gull entered the local market. That sadly, seems the depth of the analysis.
Z Energy recently flagged that the first five months of FY20 trading had been adversely affected
by several factors but notably compression in both volumes and margins in the retail fuel
market.
One could argue that fuel retailing has already been through a differentiated step change and
that the landscape has never been more competitive.
During July and August, increased industry discounting and promotional activity has resulted in
margin contraction of both the Z and the Caltex brands. Z Energy noted that its percentage of
retail fuel sales on discount has increased from about 75 per cent to about 90 per cent.
If we take the latest retail petrol margin data, MBIE estimate a regular petrol margin of about
25c/litre, which is consistent with Z Energy's estimates at the end of September 2019 (see graph
below).
Source: Z Energy
Is the Government to have us believe that petrol retailers shouldn't be making any money? That
doesn't seem a sensible premise to attract new competitors into a market.
Z Energy reported a return on capital of around 7% in its latest result, down from a 12 per cent
high in FY17.
16 of 19By my way of thinking, a 7 per cent return does not sound outlandish. What does this mean for
all New Zealand industries? Is this a Government that is opposed to an industry making a
reasonable return on their assets? If so, then should all industries be looking over their shoulder
under the current regime?
Clearly, the Government has no idea about the commercial realities of this industry. Instead of
attempting to score political points, how about focusing on making the industry more efficient,
or better yet, supporting local players to achieve better outcomes for everyone?
Note: The original article appeared in the NZ Herald on December 7th, 2019.
17 of 19Factor Investing
Ed Glennie - Investment Strategist
The use of Factor Exchange Trade Funds (ETFs) has been a growing investment trend as a way
to enhance returns or reduce risk within portfolios.
All investment portfolios are exposed to factors. Factors are historically persistent drivers of
returns within and across asset classes. Strategies that target certain factors can be used to
potentially improve a portfolio’s investment returns. Based on BlackRock research, the four
main factors that have outperformed the broader equity market over the long term are:
1. Value investing - Finding securities that are underpriced relative to fundamentals
2. Momentum investing - Investing in securities with upward trending prices
3. Quality investing - Preferring companies with solid balance sheets and less volatile
earnings
4. Small size investing - Tilting to smaller, more nimble companies
There are also strategies that target stocks with low exposure to the Volatility factor which can
be used to help reduce portfolio risk. Minimum Volatility investing is selecting stocks that have
historically displayed lower risk. This builds up a portfolio’s resilience without necessarily giving
up potential upside. Minimum Volatility ETFs do this by aiming to deliver the same return as the
underlying index but with a lower level of risk because they are invested in less risky stocks. They
have become a popular alternative to reducing portfolio risk from traditional means such as
fixed income or defensive equities. As global interest rates stay lower for longer, we think it is
prudent to consider some of these as options.
Quality stocks are financially healthy companies which have tended to perform better over time.
They exhibit the characteristics of being ‘quality’ companies, defined as demonstrating earnings
persistence, high profitability and low leverage. These quality companies have typically
outperformed during periods of economic slowdowns and over a long-term time horizon.
Quality as a factor has historically performed best in periods of modest growth, and as we start
seeing signs of global growth coming back, we believe that this is an environment when the
Quality factor should outperform.
Another option is a diversified multi-factor ETF because it is hard to know exactly what factor is
going to work at what time. These ETFs aim to outperform the index with the same level of risk
by targeting Value, Momentum, Quality and Size which are the four main factors as spelt out
above.
If you would like to learn more about factor investing and how factors could complement your
existing portfolio and potentially improve outcomes, please do not hesitate to contact your
Hobson Wealth adviser.
18 of 19General Disclaimers
This document has been distributed in confidence to New Zealand resident clients of Hobson Wealth Partners Limited (Hobson Wealth).
Hobson Wealth is an NZX Trading and Advising Participant, an Individual Clearing and Depository Participant, as well as a registered financial services
provider (L17, 88 Shortland Street, Auckland, New Zealand). Macquarie Group Limited (MGL) holds an interest in Hobson Wealth and provides certain
business and research services to Hobson Wealth and there is also a security distribution agreement in place between MGL and Hobson Wealth.
However, Hobson Wealth is not a wholly owned subsidiary of MGL, operates separately to MGL, and Hobson Wealth liabilities do not represent
liabilities of MGL.
The disclosure statements for Hobson Wealth and your adviser are available free of charge by contacting us on 0800 742 737.
Any materials disseminated contain market commentary and factual information or class advice only. They are not research. Nothing in these
documents shall be construed as a solicitation to buy or sell any security or product, or to engage in or refrain from engaging in any transaction. The
information in this presentation does not take account of any particular person’s objectives, financial situation or needs. Before acting on this
information, investors should therefore consider the appropriateness of the information having regard to their situation. We recommend investors
obtain financial, legal and taxation advice before making any financial investment decision.
The views contained in this document may not constitute the views of the Macquarie Group. While we believe the information to be accurate and any
recommendations to have reasonable basis, no warranty is made as to the accuracy or reliability thereof. There are risks involved in securities trading.
The price of securities can and does fluctuate and an individual security may even become valueless. International investors are reminded of the
additional risks inherent in international investments, such as currency fluctuations and international stock market or economic conditions, which may
adversely affect the value of the investment. The forecasts are predictive in character and therefore investors should not place undue reliance on the
forecast information. Whilst every effort has been taken to ensure that the assumptions on which the forecasts are based are reasonable, the forecasts
may be affected by incorrect assumptions or by known or unknown risks and uncertainties.
The actual results may differ substantially from the forecasts and some facts and opinions may change without notice. Hobson Wealth does not give,
nor does it purport to give, any taxation advice. The application of taxation laws to each investor depends on that investor’s individual circumstances.
Accordingly, investors should seek independent professional advice on taxation implications before making any investment decisions. Any documents
disseminated are based on information obtained from sources believed to be reliable but we do not make any representation or warranty that it is
accurate, complete or up to date. We accept no obligation to correct or update the information or opinions in it. Opinions expressed are subject to
change without notice. Hobson Wealth accepts no liability whatsoever for any direct, indirect, consequential or other loss arising from any use of this
document and/or further communication in relation to this document. Hobson Wealth, its associates, and the
Macquarie Group, their officers or employees may have interests in the financial products referred to in this document by acting in various roles
including as investment banker, underwriter or dealer, holder of principal positions, broker, lender, director or adviser. Further, they may act as market
maker or buy or sell those securities as principal or agent and, as such, may affect transactions which are not consistent with the recommendations (if
any) in this document. Hobson Wealth and members of the Macquarie Group of companies may receive fees, brokerage or commissions for acting in
those capacities and the reader should assume that this is the case.
Disclosures
Important disclosure information regarding MGL interest in the subject companies covered in this report is available at
www.macquarie.com/disclosures.
Contacts
For more information, call us on 0800 742 737 or visit our website at hobsonwealth.co.nz
Auckland Tauranga Wellington Christchurch
Level 4, Australis Nathan Level 2, Suite 6, The Vault Level 12, Deloitte Building Level 3
37 Galway Street 53 Spring Street 20 Customhouse Quay 151 Cambridge Terrace
Auckland 1010 Tauranga 3110 Wellington 6011 Christchurch 8013
t
19 of 19You can also read