Take Back the Tap The Big Business Hustle of Bottled Water - Food & Water Watch
←
→
Page content transcription
If your browser does not render page correctly, please read the page content below
Take Back the Tap The Big Business Hustle of Bottled Water
About Food & Water Watch
F ood & Water Watch FKDPSLRQVKHDOWK\IRRGDQGFOHDQZDWHUIRUDOO:HVWDQGXSWRFRUSRUDWLRQVWKDWSXWSURȴWV
before people, and advocate for a democracy that improves people’s lives and protects our environment. We
envision a healthy future for our families and for generations to come, a world where all people have the wholesome
food, clean water and sustainable energy they need to thrive. We believe this will happen when people become
LQYROYHGLQPDNLQJGHPRFUDF\ZRUNDQGZKHQSHRSOHQRWFRUSRUDWLRQVFRQWUROWKHGHFLVLRQVWKDWDHFWWKHLUOLYHV
and communities.
)RRG :DWHU:DWFKKDVVWDWHDQGUHJLRQDORɝFHVDFURVVWKHFRXQWU\WRKHOSHQJDJHFRQFHUQHGFLWL]HQVRQWKH
LVVXHVWKH\FDUHDERXW)RUWKHPRVWXSWRGDWHFRQWDFWLQIRUPDWLRQIRURXUȴHOGRɝFHVYLVLWfoodandwaterwatch.org.
1DWLRQDO2ɝFH
1616 P Street, NW
Suite 300
Washington, DC 20036
(202) 683-2500
Oakland, California Los Angeles, California Santa Barbara, California Ventura, California
1814 Franklin Street 915 Wilshire Boulevard 222 E Canon Perdido Street 940 E. Santa Clara Street
Suite 1100 Suite 2125 Suite 207C Suite 202
Oakland, CA 94612 Los Angeles, CA 90017 Santa Barbara, CA 93101 Ventura, CA 93001
(510) 922-0720 (323) 843-8450 (323) 843-8456 (805) 507-5083
Colorado Florida Maryland New Jersey
1801 N. Williams Street 2655 6 Avenue South
th
3121 St. Paul Street 100 Bayard Street
Suite 400 Suite 200 Suite 28 Suite 202
Denver, CO 80218 St. Petersburg, FL 33712 Baltimore, MD 21218 New Brunswick, NJ 08901
(720) 449-7505 (954) 687-9224 (410) 394-7650 (732) 839-0860
New Mexico New York Illinois Pennsylvania
7804 Pan American 147 Prince Street 670 W. Hubbard Street 1501 Cherry Street
East Freeway NE #2 4 Floor, No. 7
th
Suite 300 Second Floor
Albuquerque, NM 87109 Brooklyn, NY 11201 Chicago, IL 60654 Philadelphia, PA 19102
(505) 633-7366 (347) 778-2743 (773) 796-6086 (267) 428-1903
Oregon
1028 SE Water Avenue
Suite 245
Portland, Oregon 97214
(971) 266-4528
Copyright © February 2018 by Food & Water Watch. All rights reserved.
This report can be viewed or downloaded at foodandwaterwatch.org.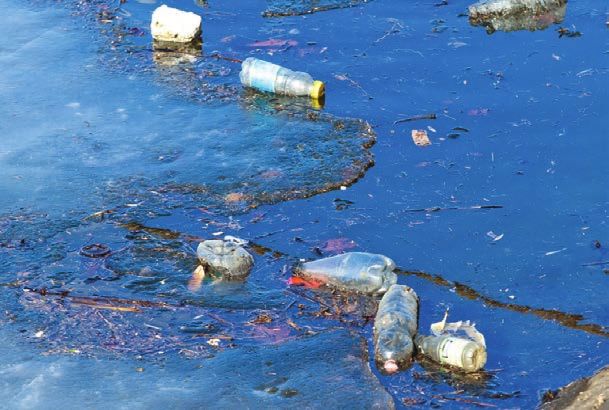
Take Back the Tap
The Big Business Hustle of Bottled Water

                                                               TABLE OF CONTENTS
   Executive Summary. . . . . . . . . . . . . . . . . . . . . . . . . . . . . . . . . . . 2
   Introduction . . . . . . . . . . . . . . . . . . . . . . . . . . . . . . . . . . . . . . . 3
   Bottled Water Trends . . . . . . . . . . . . . . . . . . . . . . . . . . . . . . . . . 3
   The Bottled Water Industry’s Latest Marketing Strategies . . . . . . . . . . . 4
      The Marketing Hype of Bottled Water Purity and Health . . . . . . . . . . . . . . . 5
      Targeting Vulnerable Populations . . . . . . . . . . . . . . . . . . . . . . . . . . . 5
   Less Stringent Regulation for Bottled Water            . . . . . . . . . . . . . . . . . . .7
   Bottled Water Industry Lobbying . . . . . . . . . . . . . . . . . . . . . . . . . . 8
   Bottled Water Is Not Better Water . . . . . . . . . . . . . . . . . . . . . . . . . 9
   Impacts to Essential Water Resources and the Environment . . . . . . . . . 10
      &RPPXQLW\&RQȵLFWDQG1HVWO«ȇV3XUVXLWRI3XEOLF:DWHU . . . . . . . . . . . . . 10
      %RWWOHG:DWHUΖQGXVWU\/LWWHU3ROOXWHV2FHDQV . . . . . . . . . . . . . . . . . . . 12
      3ODVWLFV(QHUJ\DQG)UDFNLQJ . . . . . . . . . . . . . . . . . . . . . . . . . . . . 13
   Conclusion: Take Back the Tap . . . . . . . . . . . . . . . . . . . . . . . . . . . 14
   Endnotes      . . . . . . . . . . . . . . . . . . . . . . . . . . . . . . . . . . . . . . . 15
bringing bottled water’s market share to 39 percent,
Executive Summary compared to 12.5 billion gallons for soft drinks.11 U.S.
Many Americans have bought into the myth that bottled bottled water sales hit $14.7 billion in 2016.12
water is purer and healthier than tap water, largely • %RWWOHGZDWHUUHPDLQVVLJQLȴFDQWO\PRUHH[SHQ-
because of the bottled water industry’s crafty marketing sive than tap water and gasoline. It can cost nearly
tactics — including targeting vulnerable and lower- 2,000 times the price of tap water, three times the
income consumers.1 But the federal government requires price for a gallon of milk and four times the price of
more rigorous safety monitoring of municipal tap water a gallon of gasoline.13
than it does of bottled water.2 • Bottled water advertising targets people of color,
After declining during the Great Recession, bottled women, mothers, children and lower-income
water sales and consumption increased from 2010 to groups.14 The industry emphasizes health and
20163 — including rapid growth in cheaper, private-label wellness trends, as well as concerns about sugary
water (store brands).4 The top beverage companies are beverages and obesity.15 It has focused its marketing
QRZXVLQJERWWOHGZDWHUDVD86SURȴWFHQWHUDQGDVD on women and on children and their moms, espe-
replacement for lagging soft drink sales. cially Latina mothers.16
In the face of intense marketing hype about purity and
Environmental Footprint of Bottled Water
health, most people do not realize that the majority
of bottled water sold today (nearly 64 percent) comes • In 2015, about 70 percent of plastic water bottles
from municipal tap water.5 When bottlers are not selling in the United States were not recycled and ended
municipal water, they are pumping and selling common XSLQODQGȴOOVDVOLWWHURULQFLQHUDWHG17 Much
water resources that belong to the public, harming the of this plastic waste ends up in our oceans and
environment and depleting community water supplies.6 surface waters. Municipalities can pay more than
Most people also do not realize that the drinking water $100 million a year for plastic bottled water waste
that they can get from their tap for a fraction of the disposal.18 In 2016, the 4 billion pounds of PET plastic
price of bottled water actually comes with more safe- XVHGIRUERWWOHGZDWHUZDVHQRXJKWRPRUHWKDQȴOO
guards than bottled water, since the federal government the Empire State Building.
requires more rigorous safety monitoring of municipal • %RWWOHGZDWHUFRPSDQLHVSURȴWE\GHSOHWLQJORFDO
tap water than it does of bottled water.7 water supplies; Nestlé pumped California water
during the recent historic drought, withdrawing
But getting people to kick their bottled water habit in
705 million gallons of water annually — enough to
favor of the tap is not enough. Our public drinking water
supply nearly 2,200 families per year.19
systems desperately need renewed federal investment.
Instead, Congress has slashed federal funding. Since • In 2016, 4 billion pounds of plastic was used in U.S.
SHDNLQJLQ
LQȵDWLRQDGMXVWHGIHGHUDOIXQGLQJIRU bottled water production.20 Total consumption
water infrastructure has been cut 74 percent.8 On a required an estimated energy input equivalent of
per capita basis, that is an 82 percent drop. In 1977, the 45 million to 82 million barrels of oil.21 The plastics
federal government spent almost $77 per person (in industry relies on fracking to produce the ingredients
2014 dollars) on water infrastructure, but by 2014 that for plastic bottles,22 and the bottled water industry
support fell to slightly more than $14 per person.9 relies on plastic to package its product.23
Congress must dedicate long-term public funding for
ȴ[LQJRXUGULQNLQJZDWHUDQGZDVWHZDWHULQIUDVWUXFWXUH
so that communities across the United States can keep
RUPDNHWKHLUWDSZDWHUFOHDQVDIHDQGDRUGDEOH
Key Findings:
The Big Business Hustle of Bottled Water
• In 2016, bottled water became the largest U.S.
beverage category by volume, surpassing soft
drinks.10 Total volume rose to 12.8 billion gallons,
2 Food & Water Watch • foodandwaterwatch.org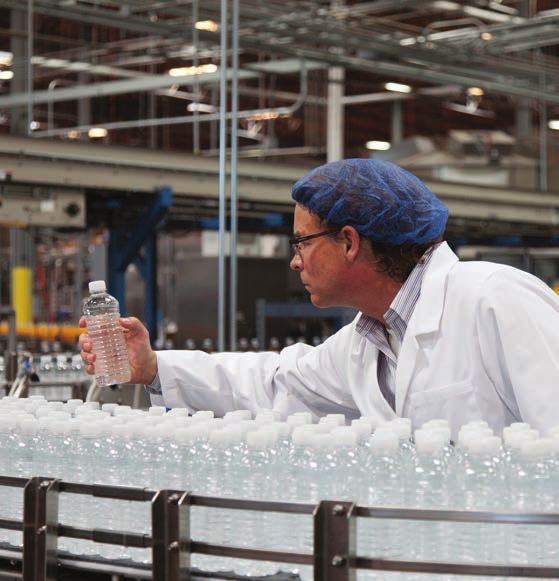
Introduction
Americans drink nearly 25 times as much bottled water
today than 40 years ago.24 Industry marketing has tried
to convince consumers of bottled water’s purity and
healthfulness compared to tap water.25 Bottled water has
become ubiquitous, and many people buy plastic water
bottles rather than drinking from the tap or a fountain.
By 2016, Americans drank nearly 40 gallons of bottled
water per person annually.26

But people may not know that the federal government
requires more rigorous safety monitoring for municipal
tap water than for bottled water (see “Less Stringent
Regulation for Bottled Water” on page 7).27 The U.S.
Food and Drug Administration (FDA) issued 35 bottled
water recalls for contamination between 2002 and 2017
(see "Bottled Water Recalls Challenge Safety Myth" on
page 10).

Consumers are wasting money on a product that costs
thousands of times more than water from their faucet
 VHHER[RQSDJH 8), even though about 64 percent of the             Bottled Water Trends
bottled water comes from municipal water systems.28                  Bottled water consumption has skyrocketed since the
3XPSLQJDQGSURGXFLQJERWWOHGZDWHUFUHDWHVVLJQLȴFDQW              late 1970s (see Figure 1).29 In 1976, the average U.S.
equity and environmental problems. Bottled water                     consumer drank less than 2 gallons of bottled water
FRPSDQLHVSURȴWIURPPLVOHDGLQJDGYHUWLVLQJFRPPRGL-                annually; by 2016, consumers drank 39 gallons per
fying public water supplies or selling overpriced tap                person.30 From 2000 to 2017, the bottled water market
water in environmentally damaging plastic bottles.                   has grown by more than 120 percent.31

   Fig. 1 • Total Annual Per Capita U.S. Bottled Water Consumption

                         40
                                                                                Great Recession
                         35                                                 Dec 2007 - June 2009

                         30
    Gallons Per Person

                         25

                         20

                         15

                         10

                          5

                          0
                          1976   1981          1986         1991   1996       2001        2006        2011        2016

SOURCE: Beverage Marketing Corporation data; Rich (2013).

Take Back the Tap: The Big Business Hustle of Bottled Water                                                                   3
U.S. bottled water sales have continued to recover water market grew 39 percent by volume, from
since the Great Recession,32 increasing by 48 percent 9.2 billion to 12.8 billion gallons, while the soft drink
from 2010 to 2016.33 Major bottled water companies — market shrank 8 percent in volume, from 13.6 billion to
1HVWO«:DWHUV1RUWK$PHULFD 1$ 3HSVL&R $TXDȴQD 12.5 billion gallons (see Figures 3.1 and 3.2 on page 6).39
and Coca-Cola (Dasani) — had rebounding sales after
U.S. bottled water industry sales totaled $14.7 billion
dipping during the recession, and private-label (store-
in 2016, selling 7.6 billion units.40 In 2016, still water
brand) bottled water (especially Niagara) sales grew at a
accounted for 77 percent of sales, or $12.6 billion.41
rapid pace (see Figure 2).34
In 2016, private-label bottled water made up more The Bottled Water Industry’s
than one-quarter of sales (28.3 percent), more than Latest Marketing Strategies
the bottled water sales of Coca-Cola and PepsiCo
It takes a lot of advertising to drive demand for a
combined.35 Nestlé Waters NA has the largest share of
SURGXFWWKDWLVSURYLGHGDVDQDRUGDEOHSXEOLF
the bottled water market for still water (see Table 1 on
service that people can get out of their faucets, and
page 5).36 Most bottled water is still water (non-
the bottled water industry spends millions of dollars
carbonated, not sparkling).
annually on advertising.43 During the 2017 Super Bowl,
The beverage industry has capitalized on bottled water where ad spots can cost up to $15 million (including
VDOHVDVDSURȴWFHQWHUDQGWRUHSODFHVWDJQDQWVRIW production costs) for 30 seconds of air time, PepsiCo
drink sales.37 In 2016, bottled water sales surpassed ran an ad for bottled water — a departure from its
VRIWGULQNVIRUWKHȴUVWWLPHDVWKHODUJHVW86EHYHUDJH usual soft drink ads.44
category by volume.38 From 2011 to 2016, the bottled
Fig. 2 • Top 4 U.S. Bottled Water Companies: Estimated Wholesale Sales (billions of dollars)
$5b
$4b
$3b
$2b
$1b
$0
2008 2009 2010 2011 2012 2013 2014
Nestlé Waters NA Niagara Coca-Cola (Dasani) 3HSVL&R $TXDȴQD
SOURCE: Beverage Marketing Corporation data.
4 Food & Water Watch • foodandwaterwatch.org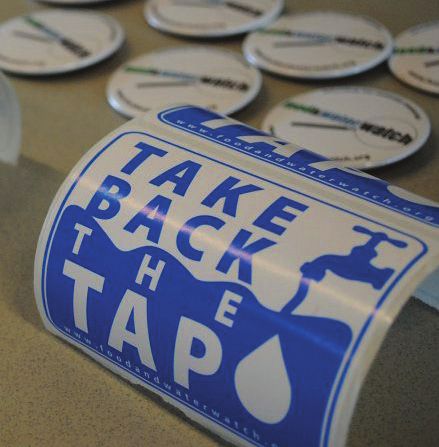
Table 1 • Top Bottled Water Companies Selling Still Water in the United States, 2016 42

                                                         2016 Sales     Change     Market      Unit Sales   Change     Avg. Price
                     Top Vendors
                                                         (Millions)     vs. 2015   Share       (Millions)   vs. 2015    per Unit

 Nestlé Waters North America                              $2,326.00      4.4%       30.2%        689.3       4.5%        $3.37
 Private Label                                            $2,183.00      6.4%       28.3%        824.4       7.9%        $2.65
 Coca-Cola Co. (Dasani, Glaceau)                          $1,041.30      7.3%       13.5%        385.6       5.5%        $2.66
 3HSVL&R $TXDȴQD                                             $654.60    10.0%       8.5%        214.5       7.5%        $3.05
 Total Bottled Water Category                             $7,702.90      6.3%       100.0%      2848.2       4.8%        $2.70
SOURCE: *URFHU\+HDGTXDUWHUV. April 2017.

The industry redoubled its marketing push after                           replacement and a refreshment beverage.… It was really
consumers turned away from pricier, brand name                            RQHRIWKHYHU\ȴUVWEHYHUDJHVWRVWDUWWREHFRQVXPHG
bottled water and even dropped bottled water entirely                     for health reasons.”49 Other companies blatantly aim to
during the recession. Nestlé lowered prices in response                   get consumers to abandon tap water. In 2000, the presi-
to lagging sales and more rigorous competition from                       dent of Quaker Oats Co.’s U.S. beverage division, which
private-label water.45 The company also has shifted                       was acquired by PepsiCo the following year, bragged
its advertising tactics to promote the healthfulness of                   that, “When we’re done, tap water will be relegated to
water compared to sugary beverages. In addition, it                       showers and washing dishes.”50
has targeted consumers in the developing world, new
immigrants, mothers and children, and women and                           Targeting Vulnerable Populations
lower-income consumers.                                                   Bottled water companies have honed their marketing to
                                                                          target lower-income groups, people of color and immi-
The Marketing Hype of                                                     grant communities in the United States — especially
Bottled Water Purity and Health
Bottled water was once marketed as natural spring
ZDWHUEXWWRGD\LWLVPRVWO\ȴOWHUHGPXQLFLSDOWDSZDWHU
The bottled water industry has promoted the purity of
LWVSURGXFWVWRVHOOWDSZDWHUXQGHUQRQVSHFLȴFODEHOV
that avoid questions about the origin of the water.
This helps companies avoid controversy and potential
lawsuits over how they advertise the source of their
ERWWOHGZDWHUΖQMXVWȴYH\HDUVWKHVKDUHRIERWWOHG
water from municipal tap water rose from just over half
(51.8 percent) in 2009 to nearly two-thirds (nearly
64 percent) in 2014 (see Figure 4 on page 7).46

Companies are promoting bottled water as a healthy
alternative to sugary beverages.47 In 2017, the Beverage
Marketing Corporation (BMC) observed that, “amid
worries about obesity, diabetes, and other health
PDWWHUVERWWOHGZDWHUȇVODFNRIFDORULHVDQGDUWLȴFLDO
ingredients, convenience, and refreshing taste attracts
health-conscious consumers.”48

This is paired with not-so-subtle suggestions that
ERWWOHGZDWHULVVXSHULRUWRWDSZDWHU$%0&H[HFX-
tive stated that, “[bottled] water is both a tap water

Take Back the Tap: The Big Business Hustle of Bottled Water                                                                         5
Latina mothers, children and women generally.51
Fig. 3.1 • U.S. Liquid Refreshment Beverage
Market Share by Volume Industry marketing strategies are designed to hype the
healthfulness and safety of bottled water to people who
35 historically have lacked access to safe tap water (espe-
Includes energy cially recent immigrants), and they prey upon those who
drinks, ready-
may mistrust tap water and on communities concerned
30 WRGULQNFRHH
22% & tea, sports about obesity and sugary beverages.
Everything Else drinks and fruit
23% beverages. Women: The industry promotes bottled water to
25
health-, beauty- and weight-conscious women. It
considers women’s concerns about skin health and
Billions of Gallons
20 weight loss as a motivating factor in purchasing bottled
31% Bottled Water 39% ZDWHU7KHPDUNHWLQJUHVHDUFKȴUP0LQWHOREVHUYHG
that bottled water’s association with “feeling full or
15 helping with weight loss also highlights opportunities for
cross-branding” and recommends marketing to younger
10 women because of their “concern [for] skin health and
weight loss.”52
46% Soda 38% 1HVWO«ȇVORQJVWDQGLQJ&RQWUH[EUDQGWDUJHWHGDW
5
women, is advertised as “the ideal water for the weight
conscious.”53 The water comes in “shapely, easy-grip
0 bottles” and touts health claims such as “supporting
2011 2016 strong bones and steady blood pressure…helping
women feel great and look beautiful.”54 In 2013, Nestlé
SOURCE: Food & Water Watch calculation from Beverage Marketing Corporation data.
launched Resource water nationwide, which the
Fig. 3.2 • Billions of Gallons of Bottled Water company’s marketing manager bragged was promoted
and Soda sold in the United States to women “on the trendy side and higher-income side,
and the bull’s-eye is 35 years old.”55
Parents, children and young people: The industry
14
Soda is marketing bottled water to children — and to their
parents who buy it.56 Much of the advertising focuses
13 on children’s “healthy hydration” and on concerns about
child obesity.577KHLQGXVWU\RHUVERWWOHVWKDWDUHVL]HG
12 DQGVKDSHGWRȴWLQWRFKLOGUHQȇVKDQGVZLWKVSHFLDO
caps.58 The companies emblazon these products with
11 cartoon characters, such as Nestlé’s “Share-a-Smile
kid-designed” bottled water.59 These infant-to-teenager
consumers represent over one-fourth of the U.S. popu-
10
lation, which the industry estimated was a population
Bottled Water that could consume as much as 14 billion gallons of
9 bottled water a year.60
8 The industry even makes bottled water for babies,
VXFKDV&RPIRUWVIRU%DE\SXULȴHGZDWHUZLWKȵXRULGH
added (sold at Kroger stores, among others), which was
7
recalled in 2017 for the possible presence of mold (see
ER[RQSDJH 61+RZHYHUH[SHUWVGRQRWDGYLVHWKDW
2016
2015
2013
2014
2012
2011
EDELHVXQGHUVL[PRQWKVROGGULQNZDWHUEHFDXVHRI
SRVVLEOHULVNVRIGLDUUKHDPDOQXWULWLRQZDWHULQWR[LFD-
SOURCE: Food & Water Watch calculation from Beverage Marketing Corporation data.
WLRQDQGH[SRVXUHWRSDUDVLWHV62
6 Food & Water Watch • foodandwaterwatch.orgFig. 4 • U.S. Retail Bottled Water by Source
5 Tap Water
4
Billions of Gallons
3
Spring Water
2
1
0
2000 2001 2002 2003 2004 2005 2006 2007 2008 2009 2010 2011 2012 2013 2014
Percent of Total Volume
33% 37% 39% 36% 33% 38% 44% 48% 49% 52% 54% 56% 58% 61% 63%
Tap Water
Spring Water
67% 63% 61% 64% 67% 62% 56% 52% 51% 48% 46% 44% 42% 39% 37%
SOURCE: Beverage Marketing Corporation data.
People of color, lower-income groups and immi- Latin-American immigrants, particularly mothers.67 In
grant communities: According to a 2014 market 2014, Nestlé spent over $5 million advertising Pure Life
research report, adults that consume large volumes — the most advertised U.S. brand — and three-quarters
of bottled water are more likely than average to of this spending ($3.8 million) went to Spanish-language
be African American, and Latinos make up the key television advertising.68 In 2015, Pure Life initiated a
customer base for bottled water.63 Researchers from campaign to encourage children to drink more water.69
the Medical College of Wisconsin and the University
of Wisconsin found that Latino and African-American Less Stringent Regulation
parents were more likely to buy bottled water than for Bottled Water
white parents, and they are dishing out more money
Contrary to the industry’s marketing, bottled water is
on bottled water primarily because of perceived health
not necessarily a purer, safer, healthier alternative to
EHQHȴWV64 According to the researchers, these “patterns
tap water.73 Federal oversight of bottled water is weaker
PD\SURGXFHDGYHUVHKHDOWKHHFWVDQGH[DFHUEDWH
than for tap water. The FDA regulates bottled water as
economic disparities.”65
a “food” under the Federal Food, Drug, and Cosmetic
The bottled water industry markets to Latino immi- Act, whereas the Environmental Protection Agency (EPA)
grants — despite admitting that tap water is much regulates tap water under the Safe Drinking Water Act.74
FKHDSHUDQGXVXDOO\VDIHUȃLQSDUWE\H[SORLWLQJ
7KH86*RYHUQPHQW$FFRXQWDELOLW\2ɝFH *$2 IRXQG
bottled water as part of the immigrant “heritage” of
that the FDA places low priority on bottled water and
coming from places with less access to clean drinking
devotes fewer resources to it than to food, because
water.66 Nestlé Pure Life’s target audience is recent
the agency considers it a lower health risk compared
Take Back the Tap: The Big Business Hustle of Bottled Water 7Contaminant Level (MCL) establishes legal limits on the
level of contaminants allowed in drinking water.80
The Price of Tap vs. Bottled
Federal law does not give the FDA authority to oversee
%RWWOHGZDWHULVH[SHQVLYH7KHDYHUDJHFRVWSHUJDOORQ state regulation of bottled water, only bottled water sold
of municipal tap water is half a penny — about $0.005
across state lines,81 leaving out the 60 to 70 percent of
in 2015.70 This is the cost to pump, treat and send water
water bottled and sold within a state.82 For the bottled
to the faucet.71 Water itself is a common resource and is
priceless. water that the FDA regulates,83 it requires bottlers to
test their source water once a week for microbiological
On the other hand, the price for a single-serve bottle
contaminants, unless the water comes from a municipal
of water ranges from $1.00 to $1.50. Using an average
of $1.25, a gallon’s worth of single-serve bottled water source, in which case it has to meet EPA testing require-
costs almost $9.50 — nearly 2,000 times the price of ments for tap water.84 Bottlers must test their source
tap water, three times the national average price for a water only once a year for chemical contaminants and
gallon of milk and four times the national average price once every four years for radiological contaminants.85
for a gallon of regular-grade gasoline (see Figure 5).72 States have enacted their own laws and regulations for
bottled water, but these are less consistent and compre-
hensive than the regulations for tap water.86
Fig. 5 • Cost per U.S. Gallon
The FDA also inspects bottling plants irregularly, with
$9.47 VRPHGLVWULFWRɝFHVLQVSHFWLQJWKHPRQO\RQFHHYHU\
two or three years, and others inspecting plants even
less frequently.87 Unlike public drinking water systems,
which maintain water testing records for 5 to 10 years,
the FDA requires bottling facilities to keep test records
for only 2 years.88 Records could be destroyed faster
than the FDA inspects the plants, and the FDA may
never learn of contamination problems.89
When inspectors do go to bottled water plants, they
FRPPRQO\ȴQGSUREOHPV7KHPRVWUHFHQWUHYLHZRI
$2.84 FDA bottled water inspections by the GAO reported that
$2.35
more than one-third of FDA inspections found potential
problems between 2000 and 2008, but the GAO has
not revisited this issue since 2009.90 Yet, the FDA infre-
$0.005 quently took any action to enforce its standards, and
Tap Water Gasoline Conventional Bottled often asked companies to voluntarily address issues.91 In
Milk Water a few cases, the FDA turned investigations over to state
SOURCE: Food & Water Watch calculation from AAA, 1HZThe IBWA has been particularly opposed to the NPS acute diarrhea than children who drank primarily tap
bottled water ban.103 In 2011, the NPS implemented the water.112 The researchers suggested that this might be
ban to combat bottled water plastic waste at national due to contamination of bottled water.113
parks.1047KHEXUGHQRIWKLVSROOXWLRQLVPDJQLȴHGLQ
7KH(QYLURQPHQWDO:RUNLQJ*URXSFRQȴUPHGWKHVH
remote parks that pay premiums for waste removal.105
contamination concerns in 2008, its most recent inves-
By 2013, major national parks such as the Grand Canyon
tigation of bottled water contaminants. It looked at 10
ZHUHSDUWLFLSDWLQJLQWKHEDQDQGWKHΖ%:$VLJQLȴFDQWO\
major brands of bottled water and found 38 chemical
LQFUHDVHGLWVOREE\LQJH[SHQGLWXUHV106 Bottled water
contaminants (averaging 8 per brand) that can be
allies in Congress unsuccessfully tried to derail the NPS
harmful to human health, including: disinfection byprod-
policy every year from 2015 to 2017, but failed.107
XFWVFDHLQHSKDUPDFHXWLFDOVKHDY\PHWDOVDQG
In August 2017, however, the Trump administration minerals (e.g., arsenic and radioactive isotopes), fertilizer
reversed the NPS policy.1087KH136MXVWLȴHGWKHDFWLRQ residue containing nitrate (an ingredient associated
by claiming that the ban removed healthy options with blue-baby syndrome and other health problems)
while allowing less-healthy options, such as soft and ammonia, and other industrial chemicals such as
drinks, to remain at parks.109 A month later, an NPS solvents, plasticizers and propellants.114 Nine brands
report showed that the ban policy had worked, yet contained industrial synthetic chemicals, including
the Trump administration maintained its reversal.110 LVREXWDQHRFWDQHKH[DQHWROXHQHDQGDFHWDOGHK\GH
According to the report, the bottled water ban had that could cause cancer, liver and kidney damage, and
prevented up to nearly 2 million plastic bottles from QHXURWR[LFLW\115
entering the waste stream per year — avoiding up to
Single-serve bottled water is commonly packaged in
almost 112,000 pounds of plastic waste and up to 141
polyethylene terephthalate (PET) plastic, which contains
PHWULFWRQVRIFDUERQGLR[LGHHPLVVLRQVDQGVDYLQJ
FRPSRXQGVVXFKDVEHQ]HQHWROXHQHDQG[\OHQHV116
XSWR
FXELF\DUGVRIODQGȴOOVSDFHHDFK\HDU111
3(7ERWWOHVFDQOHDFKWR[LQVLQFOXGLQJDFHWDOGHK\GH
Bottled Water Is Not Better Water antimony117 and formaldehyde.118 Acetaldehyde is a
possible human carcinogen that can cause genetic
Bottled water is usually no safer than tap water, and in
mutations, and formaldehyde can cause DNA and chro-
many cases it can be less safe. A study by researchers
mosome damage.119 Antimony has endocrine-disrupting
at the Medical College of Wisconsin and the University
HHFWV120 High temperatures, long shelf life and low pH
of Wisconsin-Milwaukee found that children who drank
OHYHOVPD\GULYHWR[LQVWROHDFKLQWRERWWOHGZDWHU121
primarily bottled water were more likely to get sick from
Table 2 • Bottled Water Industry U.S. Lobbying Expenditures, 2014-2016
Company/Trade International Bottled Nestlé Waters
Coca-Cola Company Nestlé USA Total
Association Water Association North America
2014 Lobbying
$360,00093 $9,320,00094 $130,00095 $1,226,87196 $11,036,871
Expenditures
2015 Lobbying
$420,00097 $8,670,00098 $120,00099 N/A $9,210,000
Expenditures
2016 Lobbying
$580,000100 $7,930,000101 $120,000102 N/A $8,630,000
Expenditures
Total 2014-2016 $1,360,000 $25,920,000 $370,000 $1,226,871 $28,876,871
7RWDOOREE\LQJH[SHQGLWXUHVIRUERWWOHGZDWHULQGXVWU\LQFOXGLQJOREE\LQJRQERWWOHGZDWHUOHJLVODWLYHLVVXHVE\HLWKHURUERWKLQKRXVHDQGKLUHG
OREE\LQJȴUPV
SOURCE: Center for Responsive Politics.
Take Back the Tap: The Big Business Hustle of Bottled Water 9Bottled Water Recalls
Challenge Safety Myth
Between 2002 and 2017, the FDA issued 35 bottled
water recalls — averaging more than two annually —
due to contamination from dangerous substances,
such as bromate and arsenic122 (which may increase
cancer risks), as well as the presence of E. coli, mold,
pieces of plastic and milk allergens.123 Recent recalls
included:
• In 2015, Niagara recalled nearly 40 million bottles
of water from 14 brands, across 15 states, after
the source spring water tested positive for E.
coli.124
• Coca-Cola had two Dasani recalls in 2014 and
2015 — totaling nearly 8 million bottles — due to
“the appearance of mold” and possible pieces of
plastic in some water.125
• In July 2017, Kroger recalled its bottled water for
EDELHVȊ&RPIRUWVIRU%DE\3XULȴHG:DWHU:LWK
Fluoride,” because it “may show signs of mold.”126
Companies that bottle water from municipal sources
Impacts to Essential Water often pay less per gallon than households pay for water
Resources and the Environment service. Other water ratepayers essentially subsidize
the cost of providing tap water to companies that then
Water bottlers like Nestlé present a threat to the environ-
VHOOLWIRUDSURȴW133
ment near their bottling facilities: they deplete commu-
nity water supplies either by pumping groundwater, or by Fights over water bottling plants have erupted across
WDNLQJPXQLFLSDOZDWHUDWDVLJQLȴFDQWGLVFRXQW the country as communities stand up to companies.
Bottlers’ groundwater pumping operations can harm Pumping groundwater during California drought:
the local environment as well as natural resources During the historic California drought, some bottled
that communities rely on for drinking water, farming, water companies — such as Nestlé Waters NA’s
recreation and other uses.127 Groundwater sources Arrowhead brand and Otsuka’s Crystal Geyser brand
are usually connected to surface waters,128 and when continued to take and bottle groundwater throughout
an aquifer is over-pumped, the water levels of a the state.134 Nestlé’s California water use increased by
FRQQHFWHGVXUIDFHZDWHUERG\FDQIDOODQGZDWHUȵRZV 19 percent during the 2011 to 2014 drought years, with-
can change.1296WDWHRɝFLDOVKDYHVDLGWKDWODUJHVFDOH drawing 705 million gallons of water annually — enough
JURXQGZDWHUH[WUDFWLRQVXFKDVIRUZDWHUERWWOLQJ to supply nearly 2,200 families annually.135 Nestlé Waters
plants, could reduce the availability of local groundwater NA’s CEO refused to consider moving bottling opera-
and surface water supplies to the detriment of the tions outside of California, stating: “Absolutely not. In
natural resources that depend on them.130 When bottled fact, if I could increase it, I would…. If I stop bottling
ZDWHUFRPSDQLHVH[WUDFWJURXQGZDWHUVRXUFHVWKH\GR water tomorrow, people would buy another brand.”136
not replenish what they take.131
Nestlé drew particular criticism during the drought for
SXPSLQJRQDSHUPLWWKDWKDGEHHQH[SLUHGIRUQHDUO\
&RPPXQLW\&RQȧLFWDQG1HVWO«ȄV
three decades, taking water from the San Bernardino
3XUVXLWRI3XEOLF:DWHU National Forest to sell under its Arrowhead brand.137
Nestlé is on the hunt for water across the United The company paid only $524 annually in permit fees to
6WDWHV3XEOLFRSSRVLWLRQWRJURXQGZDWHUH[WUDFWLRQ pump, amounting to $0.00002 per gallon for the nearly
has led the company to turn to municipal tap water.132 25 million gallons pumped in 2014.138
10 Food & Water Watch • foodandwaterwatch.orgThe amount of PET plastic
used in making
U.S. bottled water
in 2016...
ZRXOGȩOOWKH
Empire State Building
more than
1.3 times
annually.
QRWWRVFDOH
SOURCE: Food & Water Watch calculation from Gleick and Cooley, U.S. EPA, U.S. EIA, Beverage Marketing Corporation, Empire State Building and plastics industry data.
Take Back the Tap: The Big Business Hustle of Bottled Water 11Nestlé not welcome in Columbia River Gorge: Nestlé
has tried to open a bottling plant in the Columbia
River Gorge for nearly a decade, but has failed. The
Bottled Water and Emergencies
town of Enumclaw, Washington rejected Nestlé’s When disasters like hurricanes damage water treatment
overtures in 2008.139 The company’s seven-year plants and distribution systems, or when communities
OLNH)OLQW0LFKLJDQH[SHULHQFHDFULVLVLQWKHLUZDWHU
campaign in Cascade Locks, Oregon for a plant that
infrastructure that puts public health at risk, some
would pump 100 million gallons annually was rejected
communities may need to rely on bottled water for a
by a county referendum in 2016 that banned water short period of time. But it is important to be clear: the
bottling, but Nestlé continued to press for the plant in role of bottled water in providing access to safe water
2017.140 In Waitsburg, Washington, the city council told during an emergency does not make it an acceptable
Nestlé in 2016 that it was not interested in a substitute for daily use in communities that are not
150 million gallon per year bottled water plant.141 In H[SHULHQFLQJDQHPHUJHQF\
2017, the mayor of Goldendale, Washington rejected a Communities without safe tap water need resources to
similar Nestlé plant proposal.142 At each step, commu- rebuild damaged infrastructure — to a standard that
nities fought to keep Nestlé out of the Columbia River makes our water systems more resilient in the face of
ZDWHUVKHGGHVSLWHDJJUHVVLYHDQGZHOOȴQDQFHG future threats. While this rebuilding takes place, there
are options besides bottled water to make sure that
HRUWVWRVHFXUHQHZSODQWV
people have access to clean water for drinking and
Michigan’s battle with Nestlé: Michigan residents sanitation — ranging from small treatment systems to
and Indigenous communities near Osceola Township bulk water distribution.147
KDYHEHHQȴJKWLQJ1HVWO«ȇVSODQVWRQHDUO\WULSOHDORFDO
SODQWȇVH[WUDFWLRQWRPLOOLRQJDOORQVDQQXDOO\143
Nestlé only pays an annual $200 water use fee and a
RQHWLPHDSSOLFDWLRQIHHWRH[WUDFWKXQGUHGV
of millions of gallons.1441HVWO«ȇVFKHDSH[WUDFWLRQRI
Michigan water is in contrast to high water service fees
paid by Flint residents for contaminated drinking water
and by Detroit residents, tens of thousands of whom
H[SHULHQFHZDWHUVKXWRVRYHUXQDRUGDEOHZDWHUELOOV
each year.145 In 2017, Osceola Township blocked a permit
that Nestlé needed to increase pumping, and although
the permit remained under review in 2017, public
opposition has delayed approval.146
%RWWOHG:DWHU,QGXVWU\/LWWHU3ROOXWHV2FHDQV
3ODVWLFERWWOHVIURPWKHH[SDQGLQJERWWOHGZDWHU
LQGXVWU\PRVWO\HQGXSDVOLWWHUDQGLQODQGȴOOVΖQ
4 billion pounds of PET plastic was used for bottled
ZDWHUSURGXFWLRQȃHQRXJKWRPRUHWKDQȴOOWKH
Empire State Building — and 43 percent more than the
2.8 billion pounds used in 2007.148 In 2015, the majority 1960 and 2015, 79 percent of which (about 14 trillion
of PET plastic water bottles — an estimated 70 percent SRXQGV KDVDFFXPXODWHGLQODQGȴOOVRUWKHQDWXUDOHQYL-
ȃZHUHQRWUHF\FOHG
WKHVHERWWOHVHQGHGXSLQODQGȴOOV ronment, including in our oceans.151ΖQWKH3DFLȴF2FHDQ
as litter or incinerated, amounting to nearly 3 billion DȊSODVWLFVRXSȋGXEEHGWKHȊ*UHDW3DFLȴFJDUEDJH
pounds of waste.149 The cleanup burden falls to local patch” circulates among four ocean currents — it is the
governments, which spent over $100 million to dispose world’s largest dump.152 High concentrations of plastics
of non-recycled plastic bottled water waste in 2016.150 pollution are also reaching the Arctic Ocean.153
Much of this plastic waste ends up in our oceans and This plastics pollution damages ocean ecosystems and
surface waters. A 2017 study calculated that 18 trillion PDULQHOLIHΖQRQHVFLHQWLVWȴOPHGWKHPRPHQW
pounds of plastic has been produced globally between when plankton ingested plastic, documenting it
12 Food & Water Watch • foodandwaterwatch.orgentering the food chain.154$VWXG\VKRZHGWKDWȴVK The bottled water industry relies on PET plastic to
VXHUHGOLYHUWR[LFLW\IURPLQJHVWLQJSODVWLFVSROOXWLRQ155 package its single-serve bottles, and the plastics
A 2014 University of Ghent study estimated that regular LQGXVWU\KDVUHDSHGXQGHUWKHUDGDUEHQHȴWVIURP
human mussel and oyster consumers ingest between the environmentally destructive fracking boom.162
1,800 to 11,000 microparticles of plastic annually.156 By Plants that convert natural gas into petrochemicals
2012, nearly two-thirds of seabird species had ingested such as plastics emit massive amounts of air pollutants
plastic and had plastic debris in their organs, which can including polycyclic aromatic hydrocarbons, carbon
cause gut blockages and organ damage.157 GLR[LGHDQGR]RQHFUHDWLQJYRODWLOHRUJDQLFFRPSRXQGV
VXFKDVEHQ]HQHDQGWROXHQH DQGQLWURJHQR[LGHV163
3ODVWLFV(QHUJ\DQG)UDFNLQJ This petrochemical production has human health
It takes a lot of energy and fossil fuels — mostly from HHFWV6HYHUDOVWXGLHVKDYHGHPRQVWUDWHGWKDWH[SR-
fracked gas — to make billions of pounds of plastic sure to these pollutants is associated with heightened
ZDWHUERWWOHVDQQXDOO\$3DFLȴFΖQVWLWXWHVWXG\IRXQG cancer risks, acute irritative symptoms (such as nausea
that, in total, the manufacture, production and trans- and eye and throat irritation) and respiratory-related
portation of bottled water is 1,100 to 2,000 times as illnesses, especially in children.164
energy intensive as the treatment and distribution of
tap water.158 Based on this research, 2016 U.S. bottled
Conclusion: Take Back the Tap
water consumption used the energy input equivalent of 7KHSURGXFWLRQRIERWWOHGZDWHUFDXVHVVLJQLȴFDQWHTXLW\
about 64 million barrels of oil (a range of 45 million to 82 and environmental problems, including taking water
million barrels).159 The gasoline from 64 million barrels of from communities that depend on it, polluting the envi-
oil could more than fuel the round-trip commutes of the ronment, contributing to global warming and creating
population of the entire Detroit, Michigan metropolitan billions of empty bottles that end up as waste.
area for one year.160 This amount of gasoline is also Instead, federal, state and local governments need to
equivalent to the annual greenhouse gas emissions from protect the quality and integrity of our water sources so
nearly 2.5 million passenger cars, or nearly 11.5 million WKDWHYHU\RQHKDVDFFHVVWRVDIHDRUGDEOHWDSZDWHU
PHWULFWRQVRIFDUERQGLR[LGHHPLVVLRQV161 that they trust.
Take Back the Tap: The Big Business Hustle of Bottled Water 13Our public drinking water systems desperately need 37 percent drop.171 Per capita funding fell from just
federal investment, but federal funding for water and under $23 in 2010 to just under $14 in 2014, a drop of
sewer systems is decreasing. Reliance on bottled water nearly 39 percent.172
may make people less inclined to support public invest-
While there has been growing recognition of the need
ment in municipal water systems, even though nearly
for investment in the United States’ aging infrastructure,
two-thirds of bottled water comes from municipal
KRZZHZLOOȴQDQFHLWLVOHVVFOHDU3ODQVWKDWUHO\RQ
sources.1650XOWLQDWLRQDOERWWOLQJFRPSDQLHVEHQHȴWIURP
privatization including public-private partnerships, such
public disinvestment, as the chairman of Nestlé Waters
as those advanced by the Trump administration, are
stated in 2009: “We believe tap infrastructure in the U.S.
not acceptable. Private control of our water systems will
ZLOOFRQWLQXHWRGHFOLQHȐ3HRSOHZLOOWXUQWRȴOWUDWLRQ
lead to rate hikes, job loss, lack of accountability and
and bottled water for pure water needs.”166
poor service. It is imperative that we dedicate long-term
7KHQDWLRQȇVGULQNLQJZDWHUSLSHVVSDQDSSUR[LPDWHO\ federal funding to our water and wastewater systems
1.5 million miles, and most public networks were built at WRHQVXUHWKDWDOOSHRSOHKDYHDFFHVVWRVDIHDRUGDEOH
least half a century ago.167 This infrastructure is wearing and locally managed tap water.b
out, and many pipes have reached the end of their
The following steps must be taken to safeguard our
XVHIXOQHVVZLWKPXFKRIWKHUHVWH[SHFWHGWRZHDURXW
essential water resources:
ZLWKLQWKHQH[WIHZGHFDGHV168
• Consumers should “Take Back the Tap,” reclaiming
In total, our drinking water, wastewater and stormwater
WKHZDWHUWKDWȵRZVIURPRXUIDXFHWV Tools like
systems need a $35 billion per year investment over the
Food & Water Watch’s Guide to Safe Tap Water and
QH[W\HDUV1696LQFHSHDNLQJLQ
UHDOLQȵDWLRQ
:DWHU)LOWHUV, annual quality reports from public
adjusted federal funding for water infrastructure has
ZDWHUV\VWHPVDQGȴOWUDWLRQV\VWHPVWKDWFDQ
been cut by 74 percent as of 2014. On a per person basis,
improve the taste and quality of tap water can help
it has dropped 82 percent — in 1977 the federal govern-
people make informed choices about their tap water.
ment spent almost $77 per person (in 2014 dollars), but
by 2014 that support fell to just under $14.170 • Students should also “Take Back the Tap,” and
organize to get colleges and universities to elimi-
From 2010 to 2014, while U.S. bottled water increasingly nate bottled water on campus. Over 70 U.S. colleges
came from municipal tap water sources, total federal and universities have passed full or partial bottled
funding for public water infrastructure fell from water bans, and many more have increased access to
$6.9 billion in 2010 to nearly $4.4 billion in 2014, a public tap water by installing on-campus water bottle
ȴOOLQJVWDWLRQV
• The U.S. Congress should pass the Water
$RUGDELOLW\7UDQVSDUHQF\(TXLW\DQG5HOLDELOLW\
Act (WATER Act), which would dedicate federal
funding to our drinking water and wastewater
infrastructure and help ensure that everyone has
safe tap water.
• Surface and groundwater resources must be
managed under a public trust framework. The
public trust doctrine enables sovereign states to hold
and protect natural resources.173 Under this doctrine,
running water — just like the air we breathe and
the sea — is a common resource174 and should be
protected and preserved for the public.175
• America must move OFF fossil fuels and achieve
100 percent renewable energy by 2035. We must
end reliance on dirty fossil fuels like fracked natural
gas and oil, as well as highly polluting plastics made
from petrochemicals.
14 Food & Water Watch • foodandwaterwatch.orgEndnotes
1 Mulier, Tom. “Nestlé Waters ‘optimistic’ sales will rebound on (USDA). Agricultural Marketing Service. “National Retail Report –
emerging markets growth.” Bloomberg. June 21, 2010; de La- Dairy.” Vol. 84. Iss. 44. November 3, 2017 at 3.
fuente, Della. “Nestlé pitches Pure Life to U.S. Hispanics.” Brand 14 Mulier (2010); de Lafuente (2008); Fernandez, Maria Elena.
ZHHN. August 6, 2008; Corporate Accountability International “Farewell for ‘El Show de Cristina.’” Los Angeles Times. November
&$Ζ Ȋ7DSSLQJ&RQJUHVVWR*HW2WKH%RWWOHȋ)HEUXDU\ 1, 2010; BMC (2010) at 262, 263 and 270.
at 4; Hu, Zhihua et al. “Bottled water: United States consumers
15 Arthur, Rachel. “’Huge potential’ in children’s bottled water cat-
and their perceptions of water quality.” International Journal of
egory.” %HYHUDJH'DLO\. October 19, 2016; Mintel. “Better-for-you
(QYLURQPHQWDO5HVHDUFKDQG3XEOLF+HDOWK. Vol. 8. February 21,
movement leads to record-high US bottled water sales in 2015.”
2011 at 565 to 566 and 574; Barsamian, David. “Maude Barlow
February 23, 2016; “Nestlé Pure Life launches loyalty program
interview.” 7KH3URJUHVVLYH. December 2008.
and shares valuable health tips with Latina mothers.” 1HVWOH
86*RYHUQPHQW$FFRXQWDELOLW\2ɝFH *$2 Ȋ%RWWOHG:DWHU
Pure Life. July 21, 2014; Newman, Andrew. “Nestlé adds premium
FDA Safety and Consumer Protections Are Often Less Stringent brand in still water arena.” 1HZ28 BMC. “U.S. Bottled Water Through 2019” at 280 to 283; Food & 0LQWHOȊ([HFXWLYH6XPPDU\
%RWWOHG:DWHU86-DQXDU\ȋ
Water Watch (2010) at 1; BMC (2010) at 255; CAI (2011) at 4 and 5; January 2017 at 5.
Gleick and Cooley (2009) at 2. 53 Nestlé Waters. “Our Brands.” Available at http://www.nestle-
29 BMC (2010) at 15; BMC (May 2012); BMC (2014) at 2 to 3; BMC waters.com/brands/all-brands/all-brands-list?char=C. Accessed
(2015) at 2 to 3; BMC (2016) at 2 to 3; BMC (March 9, 2017) at 2 to 3. -XO\
1HVWO«:DWHUVȊ&RQWUH[ȋ$YDLODEOHDWKWWS
ZZZ
30 BMC (March 9, 2017) at 3; BMC (2010) at 15. QHVWOHZDWHUVFRPEUDQGVFRQWUH[$FFHVVHG-XO\
31 Mendelson (2017). 54 Nestlé Waters (July 6, 2017).
32 Rich, Robert. Federal Reserve Bank of New York. “The Great 55 Newman (2013).
Recession: December 2007-June 2009.” Federal Reserve History. 56 “Global Children’s Bottled Water Market Report 2016 — Increas-
November 22, 2013. ing Concerns Over Child Obesity Are Providing Opportunities —
33 BMC (May 2012); BMC (March 9, 2017) at 2. Research and Markets.” BusinessWire. December 7, 2016; Arthur
(2016); 1HVWO«3XUH/LIH (July 21, 2014).
34 BMC (2010) at 220; BMC. “U.S. Bottled Water through 2019” at
250. 57 1HVWO«3XUH/LIH (July 21, 2014); BusinessWire (2016); “Nestlé Pure
/LIHNLFNVRWKHULSSOHHHFWPRYHPHQWWRHQFRXUDJHKHDOWK\
35 “2017 State of the Industry Almanac.” *URFHU\+HDGTXDUWHUV
hydration habits among kids.” 1HVWO«3XUH/LIH. September 16,
April 2017 at 45 and 74.
2015.
36 ΖELG at 74.
58 Arthur (2016).
37 BMC (April 19, 2017).
59 Ibid.; Nestlé Pure Life. “Share-a-Smile Kids 8 oz Bottled Water.”
38 BMC (March 9, 2017). Available at https://www.nestle-purelife.us/products/8-oz-bot-
39 BMC. [Press Release]. “The U.S. Liquid Refreshment Beverage tled-water/. Accessed June 20, 2017.
Market Grew by 1.0% in 2012, Reports BMC.” March 25, 2013; 60 Arthur (2016).
BMC. [Press Release]. “The U.S. Liquid Refreshment Market
&RPIRUWVIRU%DE\Ȋ3XULȴHG:DWHUȋ$YDLODEOHDWKWWS
ZZZ
Remained Flat in 2013.” March 31, 2014; BMC. [Press Release].
FRPIRUWVIRUEDE\FRPRXUSURGXFWVIRRGSXULȴHGZDWHU$F-
“The U.S. Liquid Refreshment Beverage Marketing Enlarged
cessed July 6, 2017; “Kroger recalls bottled water for babies.”
in 2014, Reports Beverage Marketing Corporation.” March 26,
WRCB TV (TN). July 6, 2017.
2015; BMC. [Press Release]. “The U.S. Liquid Refreshment Bever-
age Market Accelerated in 2015, Reports Beverage Marketing 62 Comforts for Baby (2017); World Health Organization. “Why
Corporation.” July 12, 2016; BMC (April 19, 2017); BMC (March 9, can’t we give water to a breastfeeding baby before the 6
2017). months, even when it is hot?” July 2014; “Is it safe for babies to
drink water?” 1HZ83 Ibid. 4 and 6 to 7; IBWA. 2015 Second Quarter Lobbying Report. July
84 GAO (2009) at 4; 21 CFR § 129.35 (a)(3) and (4) (2012). 20, 2015 at 1 and 4 to 7; Van Ness Feldman, LLP. IBWA. 2015 Sec-
ond Quarter Lobbying Report. July 16, 2015 at 1 to 4 and 6 to 7;
85 21 CFR § 129.35 (a)(3) (2012).
IBWA. 2015 Third Quarter Lobbying Report. October 20, 2015 at
86 GAO (2009) at 8 and 12 to 13. 1 and 4 to 7; Van Ness Feldman, LLP. IBWA. 2015 Third Quarter
87 Ibid. at 10. Lobbying Report. October 15, 2015 at 1 to 4 and 6 to 7; Van Ness
88 Ibid. at 9. Feldman, LLP. IBWA. 2015 Fourth Quarter Lobbying Report.
January 20, 2016 at 1 to 4 and 6 to 7; IBWA. 2015 Fourth Quarter
89 Ibid. at 9. Lobbying Report. January 19, 2016 at 1 and 4 to 7.
90 Ibid. at 12. 98 Lobbying totals include both in-house lobbying and hired lobby-
91 Ibid. at 12. ists. Center for Responsive Politics. Lobbying database for Coca-
92 Ibid. at 12. Cola Co. 2015 election cycle. Available at www.opensecrets.org.
Accessed July 11, 2017; The Coca-Cola Co. 2015 First Quarter
93 Lobbying totals include both in-house lobbying and hired lob-
Lobbying Report. April 20, 2015 at 1, 6 and 9; The Coca-Cola Co.
byists. Center for Responsive Politics. Lobbying database for
2015 Second Quarter Lobbying Report. July 20, 2015 at 1, 6 and
International Bottled Water Association (IBWA). 2014 election
9; The Coca-Cola Co. 2015 Third Quarter Lobbying Report. Octo-
cycle. Available at www.opensecrets.org. Accessed July 11, 2017;
ber 20, 2015 at 1 and 6; The Coca-Cola Co. 2015 Fourth Quarter
Van Ness Feldman, LLP. IBWA. 2014 First Quarter Lobbying Re-
Lobbying Report. January 20, 2016 at 1 and 6.
port. April 21, 2014 at 1 to 4 and 6 to 7; IBWA. 2014 First Quarter
Lobbying Report. April 21, 2014 at 1 and 4 to 7; Van Ness Feld- 99 Lobbying totals include both in-house lobbying and hired lob-
man, LLP. IBWA. 2014 Second Quarter Lobbying Report. July 10, byists. Center for Responsive Politics. Lobbying database for
2014 at 1 to 4 and 6 to 7; IBWA. 2014 Second Quarter Lobbying Nestlé SA. 2015 election cycle. Available at www.opensecrets.
Report. July 31, 2014 at 1 and 4 to 7; Van Ness Feldman, LLP. RUJ$FFHVVHG-XO\
3RUWHUȴHOG/RZHQWKDO)HWWLJ
IBWA. 2014 Third Quarter Lobbying Report. October 17, 2014 Sears, LLC. Nestlé Waters North America. 2015 Second Quarter
at 1 to 4 and 6 to 7; IBWA. 2014 Third Quarter Lobbying Report. /REE\LQJ5HSRUW-XO\DWWR
3RUWHUȴHOG/RZHQWKDO
October 15, 2014 at 1 and 4 to 7; Van Ness Feldman, LLP. IBWA. Fettig & Sears, LLC. Nestlé Waters North America. 2015 Third
2014 Fourth Quarter Lobbying Report. January 16, 2015 at 1 to 4 Quarter Lobbying Report. October 20, 2015 at 1 to 2; Por-
and 6 to 7; IBWA. 2014 Fourth Quarter Lobbying Report. January WHUȴHOG/RZHQWKDO)HWWLJ 6HDUV//&1HVWO«:DWHUV1RUWK
20, 2015 at 1 and 4 to 7. America. 2015 Fourth Quarter Lobbying Report. January 19,
2015 at 1 to 2.
94 Lobbying totals include both in-house lobbying and hired lobby-
ists. Center for Responsive Politics. Lobbying database for Coca- 100 Lobbying totals include both in-house lobbying and hired
Cola Co. 2014 election cycle. Available at www.opensecrets. lobbyists. Center for Responsive Politics. Lobbying database
org. Accessed July 11, 2017; The Coca-Cola Company. 2014 First for IBWA. 2016 election cycle. Available at www.opensecrets.
Quarter Lobbying Report. May 15, 2014 at 1 and 7; The Coca- org. Accessed July 11, 2017; IBWA. 2016 First Quarter Lobbying
Cola Company. 2014 Second Quarter Lobbying Report. July 21, Report. April 20, 2016 at 1 and 4 to 7; Van Ness Feldman, LLP.
2014 at 1, 6 and 13; The Coca-Cola Company. 2014 Third Quarter IBWA. 2016 First Quarter Lobbying Report. April 20, 2016 at 1 to
Lobbying Report. March 24, 2015 at 1, 6 and 10; The Coca-Cola 4 and 6 to 7; IBWA. 2016 Second Quarter Lobbying Report. July
Company. 2014 Fourth Quarter Lobbying Report. January 20, 19, 2016 at 1 to 2 and 4 to 9; Van Ness Feldman, LLP. IBWA. 2016
2015 at 1, 6 and 9. Second Quarter Lobbying Report. July 19, 2016 at 1 to 4 and 6 to
9; Van Ness Feldman, LLP. IBWA. 2016 Third Quarter Lobbying
95 Lobbying totals include both in-house lobbying and hired lob-
Report. October 19, 2016 at 1 to 4 and 6 to 9; IBWA. 2016 Third
byists. Center for Responsive Politics. Lobbying database for
Quarter Lobbying Report. October 20, 2016 at 1 to 2 and 4 to 9;
Nestlé SA. 2014 election cycle. Available at www.opensecrets.
Van Ness Feldman, LLP. IBWA. 2016 Fourth Quarter Lobbying
org. Accessed July 11, 2017; ML Strategies, LLC. Nestlé Waters
Report. January 17, 2017 at 1 to 4 and 6 to 9; IBWA. 2016 Fourth
North America. 2014 First Quarter Lobbying Report. April 17,
Quarter Lobbying Report. January 23, 2017 at 1 to 2 and 4 to 9.
2014 at 1 to 2; ML Strategies, LLC. Nestlé Waters North America.
2014 Second Quarter Lobbying Report. July 18, 2014 at 1 to 2; 101 Lobbying totals include both in-house lobbying and hired lob-
ML Strategies, LLC. Nestlé Waters North America. 2014 Third byists. Center for Responsive Politics. Lobbying database for
Quarter Lobbying Report. October 17, 2014 at 1 to 2; ML Strate- Coca-Cola Co. 2016 election cycle. Available at www.opense-
gies, LLC. Nestlé Waters North America. 2014 Fourth Quarter crets.org. Accessed July 11, 2017; The Coca-Cola Company. 2016
/REE\LQJ5HSRUW-DQXDU\DWWR
3RUWHUȴHOG/RZHQ- First Quarter Lobbying Report. April 20, 2016 at 1 and 6; The
thal, Fettig & Sear, LLC. Nestlé Waters North America. 2014 Coca-Cola Company. 2016 Second Quarter Lobbying Report. July
Fourth Quarter Lobbying Report. January 20, 2015 at 1 to 2. 20, 2016 at 1 and 6; The Coca-Cola Company. 2016 Third Quarter
Lobbying Report. October 20, 2016 at 1 and 6; The Coca-Cola
96 Lobbying totals include both in-house lobbying and hired lob-
Company. 2016 Fourth Quarter Lobbying Report. January 23,
byists. Center for Responsive Politics. Lobbying database for
2017 at 1 and 5; Williams and Jensen, PLLC. The Coca-Cola Com-
Nestlé SA. 2014 election cycle. Available at www.opensecrets.
pany. 2016 Fourth Quarter Lobbying Report. January 18, 2017 at
org. Accessed July 11, 2017; Nestlé USA. 2014 Second Quarter
1 to 2; Fierce Government Relations. The Coca-Cola Company.
Lobbying Report. July 16, 2014 at 1 and 3; Nestlé USA. 2014 Third
2016 Fourth Quarter Lobbying Report. January 23, 2017 at 1 to
Quarter Lobbying Report. October 17, 2014 at 1 and 3; Nestlé
2.
USA. 2014 Fourth Quarter Lobbying Report. January 20, 2015 at
1 and 3. 102 Lobbying totals include both in-house lobbying and hired lob-
byists. Center for Responsive Politics. Lobbying database for
97 Lobbying totals include both in-house lobbying and hired
Nestlé SA. 2016 election cycle. Available at www.opensecrets.
lobbyists. Center for Responsive Politics. Lobbying database
RUJ$FFHVVHG-XO\
3RUWHUȴHOG/RZHQWKDO)HWWLJ 6HDU
for IBWA. 2015 election cycle. Available at www.opensecrets.
LLC. Nestlé Waters North America. 2016 First Quarter Lobbying
org. Accessed July 11, 2017; IBWA. 2015 First Quarter Lobbying
5HSRUW$SULODWWR
3RUWHUȴHOG/RZHQWKDO)HWWLJ
Report. April 20, 2015 at 1 and 4 to 6; Van Ness Feldman, LLP.
Sear, LLC. Nestlé Waters North America. 2016 Second Quarter
IBWA. 2015 First Quarter Lobbying Report. April 20, 2015 at 1 to
Take Back the Tap: The Big Business Hustle of Bottled Water 17/REE\LQJ5HSRUW-XO\DWWR
3RUWHUȴHOG/RZHQWKDO 2015; FDA. Recall F-1179-2017. December 15, 2016; FDA. Recall
Fettig & Sear, LLC. Nestlé Waters North America. 2016 Third F-1333-2017. January 4, 2017; FDA. Recall F-1950-2014. April 23,
4XDUWHU/REE\LQJ5HSRUW2FWREHUDWWR
3RUWHUȴHOG 2014; FDA. Recall F-0615-2015. October 31, 2014; FDA. Recall
Lowenthal, Fettig & Sear, LLC. Nestlé Waters North America. F-2789-2015. May 8, 2015; FDA. Recall F-0611-2015. November
2016 Fourth Quarter Lobbying Report. January 18, 2017 at 1 to 2. 24, 2014; WRCB TV (2017); FDA. [Press Release]. “Bottled Water
103 John Dunham & Associates. Prepared for IBWA. “A Report on Recall: Recall Lots Include Water Distributed During Recovery
Failure to Follow Procedures in the National Park Service’s (RUWLQ&OLQWRQȋ0D\
Flawed Campaign Against Bottled Water.” February 2016 at 1 124 FDA. Recall F-2958-2015. June 19, 2015; Niagara. Consumer No-
to 2; Rein, Lisa. “How Big Water is trying to stop the National tice. September 8, 2015.
Park Service from cleaning up plastic bottles fouling the parks.” 125 FDA. Recall F-2789-2015. May 8, 2015; FDA. Recall F-0611-2015.
Washington Post. July 13, 2015; Rein, Lisa. “Park Service to Big November 24, 2014.
:DWHU
1RIHGHUDOIXQGLQJIRUERWWOHGZDWHUEDQV":HȇOOȴQGRXU
126 :5&%79 (2017).
own money, thanks.” Washington Post. July 30, 2015; Leaven-
ZRUWK6WXDUWȊ(RUWWREDQSODVWLFZDWHUERWWOHVLQQDWLRQDO 127 Hall, Noah D. Testimony on Assessing the Environmental Risks
parks would end under budget deal.”0F&ODWFK\ (DC Bureau). RIWKH:DWHU%RWWOLQJΖQGXVWU\ȇV([WUDFWLRQRI*URXQGZDWHU
May 2, 2017. Domestic Policy Subcommittee, Oversight and Government
Reform Committee, U.S. House of Representatives. December
104 Rein (July 13, 2015).
12, 2007 at 8 and 9.
105 Ibid.
128 Winter, Thomas C. et al. U.S. Department of the Interior. U.S.
106 Leavenworth (2017). Geological Survey. “Ground Water and Surface Water. A Single
107 Ibid. Source.” (Circular 1139). 1998 at iii and 1.
108 Fears, Darryl. “National parks put a ban on bottled water to 129 ΖELG at iii and 14; Hall (2007) at 8 and 9.
ease pollution. Trump just sided with the lobby that fought it.” 130 GAO (2009) at 26 to 27.
Washington Post. August 17, 2017.
131 Boldt-Van Rooy (2003) at 279 and 280.
109 National Park Service. Department of the Interior. [Press Re-
132 BMC (2010) at 253 to 254; Food & Water Watch (2010).
OHDVH@Ȋ1DWLRQDO3DUN6HUYLFH(QGV(RUWWR(OLPLQDWH6DOHRI
Disposable Water Bottles.” August 16, 2017; Fears (August 17, 133 CAI (2011) at 8.
2017); Aubrey, Allison. “Trump administration reverses bottled 134 James (March 8, 2015); Lurie, Julia. “Bottled water comes from
water ban in National Parks.” 135. August 18, 2017. the most drought-ridden places in the country.” Mother Jones.
110 Fears, Darryl. “The National Park Service showed that its bottled August 11, 2014; Otsuka. “Annual Report 2015.” December 31,
water band worked — then lifted it.” Washington Post. Septem- 2015 at 41.
ber 26, 2017; National Park Service. Department of the Interior. 135 James (March 8, 2015); Brown (April 28, 2015); Dangelantonio
“National Park Service ‘Disposable Plastic Water Bottled Recy- (2015).
cling Reduction’ Program Evaluation Report.” May 2017 at 8. 136 Dangelantonio (2015).
111 Fears (September 26, 2017); National Park Service (2017) at 8. 137 James (March 8, 2015); Steinberg, Jim. “Why Nestlé can continue
112 Gorelick, M. H. et al. “Water use and acute diarrhoeal illness in to bottle water in the San Bernardino Mountains.” The Sun (CA).
children in a United States metropolitan area.” (SLGHPLRORJ\ September 21, 2016.
ΖQIHFWLRQ. Vol. 139. 2011 at 295, 297, 298 and 300. 138 James (March 8, 2015).
113 Ibid.; Cambridge University Press (2010) at 300. 139 Solomon, Cara. “Nestlé water plant? Not in our town, Enumclaw
114 Naidenko, Olga et al. Environmental Working Group. “Bottled says.” Seattle Times. July 10, 2008.
Water Quality Investigation: 10 Major Brands, 38 Pollutants: 140 Loew, Tracy. “Hood River voters block Nestle bottling plant.”
Bottled water contains disinfection byproducts, fertilizer resi- Statesman Journal 25 0D\
3URȴWD&DVVDQGUDȊ+RRG
due, and pain medication.” October 15, 2008 at 1 to 2 and 10. River County voters approve water bottling ban.” 2UHJRQ3XEOLF
115 Naidenko et al. (2008) at 12. 5DGLR May 17, 2016; Gutierrez, Simon. “Plans for Nestlé water
%0& DW[LL
*UDG\DQGYou can also read