TANK CLEANING IN THE BALTIC SEA - ASSESSMENT OF THE ECOTOXICITY OF TANK CLEANING EFFLUENTS
←
→
Page content transcription
If your browser does not render page correctly, please read the page content below
TURUN YLIOPISTON
MERENKULKUALAN KOULUTUS- JA TUTKIMUSKESKUKSEN JULKAISUJA

       PUBLICATIONS FROM THE CENTRE FOR MARITIME STUDIES
                      UNIVERSITY OF TURKU

                             A 63
                             2012

   TANK CLEANING IN THE BALTIC SEA –
ASSESSMENT OF THE ECOTOXICITY OF TANK
         CLEANING EFFLUENTS

                        Milja Honkanen
                         Jani Häkkinen
                           Antti Posti
TURUN YLIOPISTON
MERENKULKUALAN KOULUTUS- JA TUTKIMUSKESKUKSEN JULKAISUJA

  PUBLIKATIONER AV SJÖFARTSBRANSCHENS UTBILDNINGS- OCH
          FORSKNINGSCENTRAL VID ÅBO UNIVERSITET

    PUBLICATIONS FROM THE CENTRE FOR MARITIME STUDIES
                   UNIVERSITY OF TURKU

                          A 63
                          2012

TANK CLEANING IN THE BALTIC SEA –
ASSESSMENT OF THE ECOTOXICITY OF
    TANK CLEANING EFFLUENTS

                      Milja Honkanen
                       Jani Häkkinen
                         Antti Posti

                        Turku 2012
JULKAISIJA / PUBLISHER:
       Turun yliopisto / University of Turku
MERENKULKUALAN KOULUTUS- JA TUTKIMUSKESKUS
        CENTRE FOR MARITIME STUDIES

             Käyntiosoite / Visiting address:
      ICT-talo, Joukahaisenkatu 3-5 B, 4.krs, Turku

              Postiosoite / Postal address:
             FI-20014 TURUN YLIOPISTO

           Puh. / Tel. +358 (0)2 333 51
                  http://mkk.utu.fi

                    Kopijyvä Oy
                   Kouvola 2012

       ISBN 978-951-29-5173-4 (paperback)
          ISBN 978-951-29-5174-1 (PDF)
                  ISSN 1456–1816
FOREWORD Far more studies have been conducted on the risks of marine transport of oil than on the risks arising from chemical transportation. Furthermore, most of the studies dealing with either oil or chemical shipping are focused on large spills resulting from shipping accidents. Studies on the impacts of chronic pollution from routine shipping operations, such as tank cleaning and bilge water handling are relatively scarce – particularly regarding chemicals. This is partly due to the “invisible” nature of operational discharges. The amounts of hazardous substances that are released at a time are relatively small and the consequences cannot be seen instantly. In contrast, a spill from a disastrous shipping accident may be over a thousand tonnes at worst, and the consequences can typically be seen immediately (e.g. surfacing of dead fish). All in all, due to its invisibility, the issue of chronic pollution resulting from operational discharges has been, at least to some degree, overlooked by both researchers and the shipping industry. This report reviews the environmental impacts of operational discharges resulting from tank cleaning. This study was conducted as a part of the Chembaltic (Risks of Maritime Transportation of Chemicals in Baltic Sea) project which gathers information on chemicals transported in the Baltic Sea. The Chembaltic project is implemented in co-operation with the University of Turku Centre for Maritime Studies, Aalto University and Kotka Maritime Research Centre. The project is funded by the European Regional Development Fund (ERDF) and the Finnish Funding Agency for Technology and Innovation (Tekes) as well as the following companies and agencies: Neste Oil Oyj, Vopak Chemicals Logistics Finland Oy, Port of HaminaKotka Ltd, Crystal Pool Ltd, and the Finnish Transport Safety Agency (Trafi). The project has also been supported by the Finnish Port Association and the Finnish Shipowners Association. The authors of the report would like to thank Jyrki Vähätalo from the Finnish Transport Safety Agency (Trafi), Crystal Pool Ltd and MARPOL surveyors Pentti Keskitalo and Laila Carlson for informative discussions on different aspects of tank cleaning. Further, the authors would like to thank the project partners and the steering group of the Chembaltic project. Lastly, M.Sc. Irina Wahlström and M.Sc. (Tech.) Olli-Pekka Brunila are acknowledged for reviewing the report. Kotka, 8 October 2012 The Authors The Centre for Maritime Studies, University of Turku
FUNDING PROVIDERS AND PARTNERS OF THE CHEMBALTIC PROJECT
ABSTRACT

This study was conducted as a part of the Chembaltic project which gathers information
on chemicals transported in the Baltic Sea and the risks they present to the environment.
In this study, the environmental risks of tank cleaning waters were evaluated by
conducting a literature survey and a small-scale risk assessment of five target chemicals
following EU methodology laid down in the Technical Guidance Document on Risk
Assessment where applicable. The target chemicals were chosen based on existing
studies and projects where chemicals were ranked by their hazardousness in the aquatic
environment and their shipping volumes in the Baltic Sea. The selected chemicals were
nonylphenol ethoxylate (nonylphenol), phenol, sulphuric acid, styrene and xylenes.

In the risk assessment carried out for this study, the Predicted Environmental
Concentrations (PECs) of all five target chemicals were determined. The PECs were
calculated based on the residual cargo quantity that was estimated to remain in a tank
after unloading (=strip) and the water quantity that is used in the cleaning process. The
cargo residue that remains in a tank after unloading depends not only on the cargo
characteristics but also on the size of the tank and the stripping technique used in a
particular ship. Therefore, the PECs were calculated for a hypothetical 1,000 m3 tank
using three different strip sizes: 15 litres, 50 litres and 300 litres. The 15-litre and 50-
litre strips are more or less typical for modern tankers. The PECs were calculated with
and without the dilution effect caused by prewashing to evaluate the importance of these
mandatory in-port prewashes. The PECs obtained for the target chemicals were
compared to their corresponding Predicted No Effect Concentrations (PNECs), which
were derived from toxicity data in the available literature. Whenever the calculated
PEC/PNEC ratio exceeds 1, a risk is indicated.

The results of the risk assessment clearly demonstrated the importance of prewashing
cargo tanks ashore before the main washing. Without prewashing the cargo tanks and
discharging the generated prewashing effluents into reception facilities ashore, the
PEC/PNEC ratios obtained for further washings exceed 1 regardless of the chemical and
the quantity of chemical residue (15/50/300 litres). In contrast, if the cargo tanks are
prewashed and the remaining prewash residues in the tanks are small (≤ 15 l), the risk
arising from tank cleaning effluents stays at accepted levels, and no significant harm
seems to be caused to aquatic organisms. When the prewash residue is around 50 litres,
the risk arising from further washings mostly remains at accepted levels as well.

Whenever the prewashing is carried out properly, the tank washings only represent a
very minor and local risk for water biota. The results of the study showed that
prewashing requirements for the most hazardous category of X cargoes and high-
viscosity and solidifying Y cargoes are without a doubt necessary to keep the hazards
arising from these substances at accepted levels. Further, MARPOL Y class also
includes persistent and toxic chemicals whose release in the sea without prewashing is
not recommended, even if the regulations might not necessarily require prewashing.
Since this study was conducted by modelling, more research is needed e.g. to measure
the actual chemical concentrations in the sea after release of tank washings.
TIIVISTELMÄ

Tutkimus on tehty osana Chembaltic-hanketta, jonka tavoitteena on kerätä tietoa
Itämerellä      kuljetettavien   kemikaalien        riskeistä.   Tässä     tutkimuksessa
kemikaalisäiliöalusten pesuvesien ympäristölle aiheuttama riski arvioitiin viiden
tutkitun kemikaalin osalta noudattamalla ja soveltamalla EU:n teknisiä
ympäristöriskinarviointiohjeita. Arvioidut kemikaalit valittiin huomioiden aiemmin
tehdyt tutkimukset, joissa kemikaalit on laitettu järjestykseen ympäristövaarallisuutensa
ja Itämerta koskevien kuljetusmäärätietojensa perusteella. Tutkimuksessa arvioiduiksi
kemikaaleiksi valikoituivat nonyylifenolietoksylaatti (nonyylifenoli), fenoli, rikkihappo,
styreeni ja ksyleenit.

Riskinarvioinnin alkuvaiheessa tutkituille viidelle kemikaalille määritettiin ennustettu
pitoisuus ympäristössä (PEC). PEC-arvo laskettiin lastin tyhjennyksestä jäljelle jäävän
kemikaalin määrän (strip eli jäännös) ja tankkien puhdistukseen käytettävän pesuveden
määrän perusteella. Kemikaalijäännöksen määrään vaikuttavat paitsi lastin
ominaisuudet, myös säiliön koko ja käytettävä aluskohtainen strippaustekniikka. Tämän
vuoksi PEC laskettiin hypoteettiselle 1 000 m3 säiliölle sekä kolmelle eri
kemikaalijäännökselle: 15 litraa, 50 litraa ja 300 litraa. Moderneissa aluksissa 15 l ja 50
l jäännökset ovat tyypillisiä. PEC-arvo laskettiin tutkituille kemikaaleilla sekä ilman
esipesua että esipesu huomioiden, mikä mahdollisti satamien suorittamien esipesujen
merkityksen arvioimisen ympäristölle aiheutuvien riskien kannalta.

Tutkituille kemikaaleille laskettua PEC-arvoa verrattiin EU-menetelmällä laskettuun
ennustettuun vaikutuksettomaan pitoisuuteen (PNEC), joka perustuu kirjallisuudesta
kerättyihin arvoihin eri kemikaalien ekotoksisuudesta. EU-ohjeistuksen mukaan aina,
kun laskettu PEC / PNEC-suhde on suurempi kuin 1 on olemassa riski ympäristölle. Nyt
toteutetun riskinarvioinnin tulokset korostavat selvästi satamassa suoritettavan esipesun
ja siinä syntyvien jätteiden maihin jättämisen merkitystä ennen pääasiallista pesua ja
tästä syntyvien pesuvesien laskemista meriveteen. Ilman esipesua, saadut PEC/PNEC-
suhteet ylittävät arvon 1 – riippumatta kemikaalista tai näiden jäännösmääristä
(15/50/300 l). Sen sijaan, jos esipesu suoritetaan ja säiliön esipesujäännökset ovat hyvin
pieniä (≤ 15 l), pesuvesistä aiheutuvat päästöt pysyvät alle hyväksyttävän tason ja eikä
niistä näyttäisi aiheutuvan merkittävää haittaa vesieliöille. Myös silloin, kun
kemikaalijäännös on esipesun jälkeen noin 50 litraa, pesuvesistä aiheutuva riski pysyy
hyväksyttävällä tasolla.

Jos esipesu tehdään sääntöjen mukaisesti, kemikaalialusten pesuvedet muodostavat vain
hyvin vähäisiä ja paikallisia haittoja vesieliöille. Tutkimuksen tulokset osoittavat, että
esipesuvaatimukset vaarallisimman eli MARPOL X -luokan kemikaaleille sekä
kiinteytyville ja korkean viskositeetin kemikaaleille ovat perusteltuja. Lisäksi myös Y-
luokan kemikaaleissa esiintyy pysyviä ja myrkyllisiä yhdisteitä, joiden päästäminen
mereen ilman esipesua ei ole suositeltava, vaikka säännöt eivät tätä edellyttäisi.
Tutkimuksessa tulokset saatiin mallintamalla. Tulevaisuudessa tarvitaan lisää
tutkimusta esimerkiksi todellisista kemikaalipitoisuuksista meressä pesuvesien
purkamisen jälkeen.
TABLE OF CONTENTS
1 INTRODUCTION ................................................................................................... 9
2 GENERAL BACKGROUND ............................................................................... 12
2.1 The Baltic Sea – a particularly sensitive sea area .......................................... 12
2.2 Transportation of chemicals in the Baltic Sea ............................................... 13
2.3 MARPOL categorization of noxious liquid substances carried in bulk......... 15
2.4 Effects and behaviour of chemicals in the environment ................................ 16
2.4.1 Toxicity of a chemical ........................................................................ 18
2.4.2 Movements and distribution of a chemical in the (marine)
environment........................................................................................ 19
3 TANK CLEANING IN PRACTICE .................................................................... 24
3.1 Cleaning and stripping ................................................................................... 24
3.2 Prewashing ..................................................................................................... 28
3.2.1 Solidifying and high-viscosity substances – definitions and prewash
requirements ....................................................................................... 29
3.3 Ventilation...................................................................................................... 30
4 TANK CLEANING AND THE ENVIRONMENT ............................................ 32
4.1 Oil .................................................................................................................. 32
4.2 Chemicals ....................................................................................................... 35
5 EVALUATING THE ECOTOXICOLOGICAL EFFECTS OF TANK
CLEANING ........................................................................................................... 41
5.1 Target substances ........................................................................................... 42
5.1.1 Nonylphenol and nonylphenol ethoxylates ........................................ 45
5.1.2 Phenol ................................................................................................. 46
5.1.3 Sulphuric acid..................................................................................... 47
5.1.4 Styrene ................................................................................................ 48
5.1.5 Xylenes ............................................................................................... 50
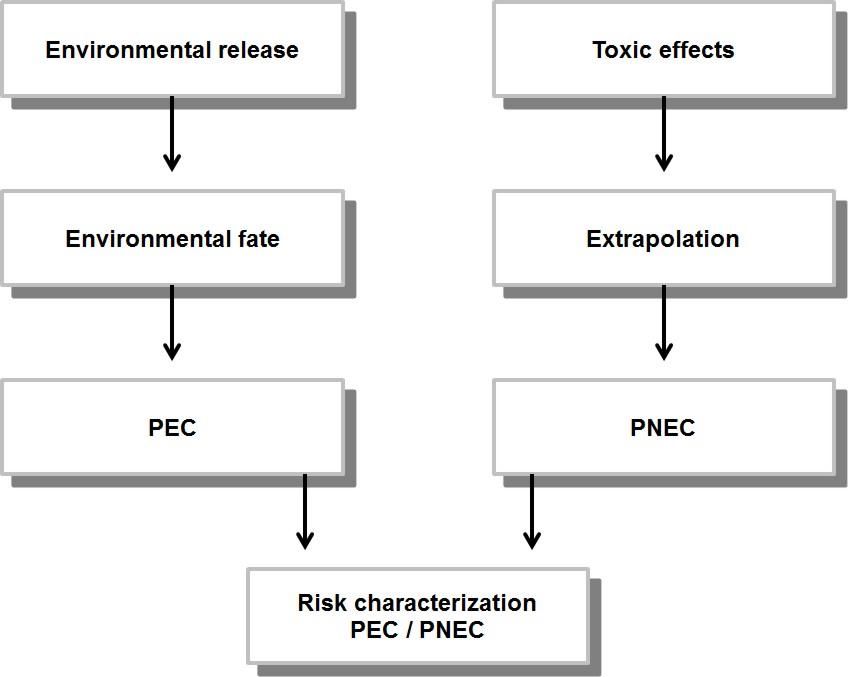
5.2 EU risk assessment ........................................................................................ 51
5.2.1 Predicted Environmental Concentration (PEC) ................................. 52
5.2.2 Predicted No Effect Concentration (PNEC) ...................................... 60
6 RESULTS ............................................................................................................... 63
6.1 PEC/PNEC ratios ........................................................................................... 63
6.2 Nonylphenol ................................................................................................... 64
6.2.1 Exposure (local PEC) ......................................................................... 64
6.2.2 Effects (PNEC for aquatic environment) ........................................... 65
6.2.3 Bioaccumulation ................................................................................ 65
6.2.4 Environmental fate and persistence ................................................... 65
6.2.5 PEC/PNEC ratio ................................................................................. 676.3 Phenol ............................................................................................................ 68
6.3.1 Exposure (local PEC) ......................................................................... 68
6.3.2 Effects (PNEC for aquatic environment) ........................................... 68
6.3.3 Bioaccumulation ................................................................................ 68
6.3.4 Environmental fate and persistence ................................................... 69
6.3.5 PEC/PNEC ratio ................................................................................. 69
6.4 Sulphuric acid ................................................................................................ 70
6.4.1 Exposure (local PEC) ......................................................................... 70
6.4.2 Effects (PNEC for aquatic environment) ........................................... 70
6.4.3 Bioaccumulation ................................................................................ 71
6.4.4 Environmental fate and persistence ................................................... 71
6.4.5 PEC/PNEC ratio ................................................................................. 72
6.5 Styrene ........................................................................................................... 72
6.5.1 Exposure (local PEC) ......................................................................... 72
6.5.2 Effects (PNEC for the aquatic environment) ..................................... 73
6.5.3 Bioaccumulation ................................................................................ 73
6.5.4 Environmental fate and persistence ................................................... 73
6.5.5 PEC/PNEC ratio ................................................................................. 74
6.6 Xylenes .......................................................................................................... 74
6.6.1 Exposure (local PEC) ......................................................................... 74
6.6.2 Effects (PNEC for aquatic environment) ........................................... 75
6.6.3 Bioaccumulation ................................................................................ 75
6.6.4 Environmental fate and persistence ................................................... 75
6.6.5 PEC/PNEC ratio ................................................................................. 76
7 SUMMARY AND CONCLUSIONS .................................................................... 78
REFERENCES ............................................................................................................. 84Tank cleaning in the Baltic Sea – Assessment of the ecotoxicity of tank cleaning effluents 9
1 INTRODUCTION
The volume of marine shipping has increased significantly in the Baltic Sea in recent
years, and it is predicted to increase even further in the future. The Baltic Sea is, in fact,
one of the busiest seas in the world, and at any given time, approximately 2,000 sizeable
ships are estimated to sail on its routes. The ships sailing the Baltic Sea include large
passenger ferries, cargo vessels, and tankers carrying oil and other hazardous
substances. In 2009, 51% of these ships were cargo vessels, 17% tankers and 11%
passenger ferries (HELCOM 2010a). The traffic is busiest on major routes from ports in
the Gulf of Finland to the Danish straits, through which all ships entering and leaving
the Baltic Sea must travel (HELCOM 2009). The transport of hazardous substances
presents a great diversity of risks. First of all, because of the busy traffic, shallow depth,
narrow navigation routes, numerous islands, and ice cover during the winter period, the
risk of an accident in the Baltic Sea area while transporting chemicals is ever present.
Luckily, major chemical transportation accidents are very rare. In the Gulf of Finland,
for example, a collision involving a chemical tanker can only be expected to happen on
average once every 45 years (Sormunen 2012). In addition to unintended accidental
spills, chemicals may also be introduced in the marine environment deliberately within
the limits of the law. Releasing tank cleaning waters containing a chemical into the sea
is an example of an activity that falls within this category of “legal discharges”.
Chemical tankers can carry various kinds of hazardous substances including highly
toxic, flammable and/or corrosive chemicals, such as phenol, benzene and ammonia, but
they can also carry lighter products, such as ethanol and edible vegetable oils (Posti &
Häkkinen 2012). Consequently, cargo tanks need to be efficiently cleaned every time
after cargo unloading to avoid contamination of the following cargo and also to keep the
tanks and their associated pipelines in good condition (McGeorge 1995).
The cleaning of chemical tanks and the discharge of the resulting washings are
controlled by Annex II of the international convention MARPOL 73/78 1 – to which all
the Baltic Sea coastal countries (i.e. the HELCOM2 countries) are parties. Regulation 13
of the Annex states that any tank cleaning waters, or ballast waters, containing chemical
residues must be predominantly discharged into a reception facility at the port of
unloading – in other words, releasing these cleaning waters (or ballast waters containing
a chemical) in the sea is predominantly prohibited. The discharge of tank cleaning
effluents in the sea is only allowed if it is done strictly by the guidelines and criteria set
out in Annex II. For example, chemical concentrations in the washings must be within
the MARPOL limits, and washings can only be discharged in deep waters (MARPOL
Annex II reg. 13). In addition, for tanks having contained highly hazardous cargo or
certain solidifying or high-viscosity cargoes, the Annex requires mandatory in-port pre-
washes – where the slops generated during these prewashes must always be discharged
into reception facilities ashore (Kunichkin 2006, MARPOL Annex II reg. 13.6 and
13.7). In practice, only the prewash effluents are discharged to the shore reception
facilities, and the main washings are practically always discharged directly into the sea,
1
The International Convention for the Prevention of Pollution from Ships, 1973, as modified by the
Protocol of 1978 relating thereto (MARPOL 73/78).
2
HELCOM countries: Denmark, Estonia, Finland, Germany, Latvia, Lithuania, Poland, Russian
Federation and Sweden.10 Honkanen, Häkkinen and Posti as it is legal when accomplished as required in the Annex II. If the main slops were to be discharged ashore as well, the costs would skyrocket, as the appropriate disposal and handling of tank cleaning effluents is extremely expensive and time-consuming (HELCOM 1993). The amount of a chemical that may legally be released into the sea per cargo tank is 75– 300 litres depending on the ship’s construction year (Appendix 4 to MARPOL Annex II). When chemical remnants are washed away with water, the total quantity of slop generated per tank in the main washing procedure may vary from 10 m3 to hundreds of cubic meters per tank (HELCOM 1993). This gives us a rough estimate of the amounts of effluents that are released in the sea from a ship that typically has a capacity of 10–60 cargo tanks (Hänninen & Rytkönen 2006). In the Gulf of Finland, particularly in the busy Hamina-Porvoo district, the shallow waters and the nearness of land rather limits the possibilities of discharging tank cleaning effluents (HELCOM 1993). In the main basin of the Baltic Sea where the waters become deeper, however, the releasing of tank washings is not as restricted. Even though MARPOL Annex II regulates tank cleaning and the disposal of cleaning effluents to some extent, there are still gaps in our knowledge of how the discharged substances behave once they are introduced in the sensitive marine environment and what adverse effects they might have once there. In addition, when solvents or detergents are used in tank cleaning, the resulting washings act as chemical mixtures leading to the possibility of joint toxicity. With the continuously growing volumes of chemical transportation in the Baltic Sea, it is important to evaluate all risk factors relating to chemical shipping, including tank cleaning. Therefore, in this report, the possible environmental effects of releasing tank cleaning waters into the Baltic Sea ecosystem are evaluated based on a literature survey and a small-scale risk assessment conducted for five target substances (nonylphenol ethoxylates, phenol, sulphuric acid, styrene and xylenes) following the methodology set out in the Technical Guidance Document of the EU on Risk Assessment (EC 2003) where applicable. This report was written as part of the Chembaltic project (Risks of Maritime Transportation of Chemicals in the Baltic Sea). The project gathers information on chemicals transported in the Baltic Sea. The risk of chemical accidents in open water and ice conditions is being modelled in the project. The risks caused by port operations with chemicals are being studied as well. In addition, the impact of other special environmental risk factors that chemical transportation involves is being evaluated. Tank cleaning is one of these special risk factors, and its environmental impact is examined in this report. The Chembaltic project is scheduled to take place between February 2011 and December 2013, and it is being carried out in co-operation with the University of Turku Centre for Maritime Studies, Aalto University and Kotka Maritime Research Centre. The project is funded by the European Regional Development Fund (ERDF) and the Finnish Funding Agency for Technology and Innovation (Tekes) as well as the following companies and agencies: Neste Oil Oyj, Vopak Chemicals Logistics Finland Oy, Port of HaminaKotka Ltd, Crystal Pool Ltd, and the Finnish Transport Safety Agency (Trafi). The Finnish Port Association and the Finnish Shipowners Association have also supported the project. The report was mainly written
Tank cleaning in the Baltic Sea – Assessment of the ecotoxicity of tank cleaning effluents   11

by Milja Honkanen, co-authored with and supervised by Jani Häkkinen (Ph.D.) and
Antti Posti (M.Sc. Tech.). The publication reflects the views of the authors. The
Managing Authority of the project cannot be held liable for the information published in
this report.
12    Honkanen, Häkkinen and Posti

2     GENERAL BACKGROUND

2.1    The Baltic Sea – a particularly sensitive sea area

The Baltic Sea is an exceptionally sensitive sea area for many different reasons. It is a
large but shallow semi-enclosed inland sea with brackish water – meaning that its water
is neither saline nor fresh water, but instead has a salinity between the two
(approximately 3–15‰) (HELCOM 2010b). In comparison, the salinity in oceans is
approximately 35‰ (Hallanaro 2010). The unusual salinity conditions in the Baltic Sea
are challenging for the aquatic organisms, as the salinity is too low for most marine
species while it is, especially in the main basin, too high for freshwater species.
Consequently, only relatively few species have adapted to living in the Baltic Sea. In
addition to salinity, the cold winters of the Baltic Sea area strain the biota and thus
contribute to the low species richness (Håkanson et al. 2003). Its poor biodiversity
makes the Baltic Sea an unstable ecosystem and thus highly susceptible to
environmental impacts: if one species is lost, for example due to chemical exposure,
there may be no other species to take its place in the ecosystem. The brackish water and
cold climate not only affect the abundance of species but also cause physiological stress
to them (HELCOM 2010c). Since the Baltic Sea biota is under constant natural stress, it
is understandably more susceptible to the effects of hazardous substances.

The Baltic Sea also differs from most of the world's seas in that it is a continental sea
(instead of a sea that lies between continents). This feature accounts for the shallowness
of the Baltic Sea: its mean depth is only about 54 metres and its maximum depth 459
metres (Landsort deep), which is still relatively shallow (Hallanaro 2010). The mean
depth of the Gulf of Finland is only 38 metres. In comparison, the mean depth of the
Atlantic Ocean is approximately 4,000 meters, and that of the Mediterranean Sea is
about 2,000 metres (Hallanaro 2010, Furman et al. 1998). Consequently, the water
volume of the Baltic Sea is relatively small, making the dilution of hazardous
substances less efficient compared to deep oceans. In addition, owing to the restricted
passage of water via the Danish straits which connect the Baltic Sea to the North Sea,
the water exchange time in the Baltic Sea is very slow (half-life of water ca. 30 years;
HELCOM 2010c). Therefore, hazardous substances stay in the Baltic Sea for a very
long time. The cold climate also contributes to the long turnover rate of hazardous
substances, as the degradation processes slow down at low temperatures (Håkanson et
al. 2003).

Despite the high vulnerability of the Baltic Sea, it is under a lot of different pressures.
The catchment area of the Baltic Sea is heavily populated (about 85 million people live
across the catchment area and its shorelines) and it has a lot of industry, busy traffic and
intense agriculture. Heavy loads of hazardous substances and nutrients causing
eutrophication are emitted or discharged from households, traffic and industrial and
agricultural sources, and they enter the Baltic Sea via surface waters or the air.
Nevertheless, one of the biggest threats to the Baltic Sea environment is the ever
increasing marine transport of oil and chemicals (HELCOM 2010c). Regardless of their
source, once released into the Baltic Sea, hazardous substances may remain there for
decades, accumulating in the food webs to reach toxic levels and causing harmful
Tank cleaning in the Baltic Sea – Assessment of the ecotoxicity of tank cleaning effluents 13
effects on the sensitive ecosystem. Consequently, identifying and mitigating the risks
arising from chemical transportation is essential to achieve better protection of the
Baltic Sea.
In 2005, the Baltic Sea, with the exception of the Russian waters and the Russian
economic zone, was declared a Particularly Sensitive Sea Area (PSSA) by the
International Maritime Organization (IMO). A PSSA status is given to sea areas that are
especially vulnerable to risks caused by marine transport and other harms. The
recognition as a PSSA area allows for specific protective measures to be taken to
control maritime activities in the Baltic Sea, such as routeing measures and installation
of Vessel Traffic Services (VTS) (IMO 2011a). The Baltic Sea has also been defined as
a “special area” according to several annexes to MARPOL 73/78, meaning that it is
provided with a higher level of protection than other sea areas (FEA 2012). The
MARPOL discharge and equipment requirements for ships, for example, are more
stringent in special areas.
MARPOL Annexes under which the Baltic Sea is defined as a special area are (Date of
Entry into Force):
Annex I: Oil (2 Oct 1983)
Annex IV: Sewage (1 Jan 2013)
Annex V: Garbage (31 Dec 1988)
Annex VI: Prevention of air pollution by ships - Emission control area; SOx (19
May 2005) (MEPC 2008).
Originally, the Baltic Sea, the Black Sea and the Antarctic were all designated as special
areas under MARPOL Annex II (Noxious liquid substances). The annex was, however,
revised in 2007, and the revision set significantly stricter discharge limits for new ships
(constructed or converted after 1 Jan 2007) compared to the previous limits.
Consequently, there was no longer any need for special requirements for the Baltic and
the Black Sea areas (IMO 2008). Only the Antarctica's status as a special area remained
after the revision: the discharge of noxious liquid substances in the Antarctic area is
strictly prohibited.
2.2 Transportation of chemicals in the Baltic Sea
Chemicals can be transported by ships either in packages or as bulk cargo. Bulk
chemical cargoes can be further dived into solids, liquids and gases, and they can be
transported either in chemical carriers or in specialized gas carriers. The carriers
transporting liquid bulk chemicals in the Baltic Sea are typically parcel tankers, which
can carry from 10 to 60 cargo tanks (“parcels”) at a time (Hänninen & Rytkönen 2006).
This consequently means that a parcel tanker can carry up to 60 different chemicals
simultaneously – although the number of different cargoes on a tanker seldom exceeds
10 (Posti & Häkkinen 2012). The total cargo capacity of chemical tankers varies from
400 to over 40,000 m3 and that of individual tanks from 70 m³ to 2,000 m³ (Hänninen &
Rytkönen 2006).14 Honkanen, Häkkinen and Posti Different cargoes cannot be placed randomly in chemical tankers, and there are several factors that must be taken into account when planning the cargo placement (Kunichkin 2006). Cargo compatibility is one of these factors: cargoes that react dangerously with each other must be separated (e.g. by a cofferdam, a void space or a tank containing compatible cargo). Further, some tank coatings are not compatible with all cargoes. Lastly, the FOSFA (The Federation of Oils, Seeds and Fats Associations) and the NIOP (the National Institute of Oilseed Products) have placed restrictions on what can be carried as previous immediate cargoes before edible animal and vegetable oils and fats (Verwey 2007). These prior cargo restrictions are in place because previous cargo carried in a tank is a potential source of contamination, despite efficient cleaning methods (Kunichkin 2006). Some residues may, for example, be adsorbed into the tank coating or find their way into areas the cleaning machines have trouble reaching and be consequently released into oil or fat even after adequate cleaning. Lastly, the IBC Code grades chemical tankers into type 1, type 2 and type 3 tankers based on their design and construction standards, and defines which substances can be transported in each type of ship (IMO 2008). The most hazardous substances can only be carried in type 1 carriers, whereas type 2 and type 3 tankers are suited for carrying progressively less hazardous substances (IMO 2011b). The liquid cargo transported in the Baltic Sea consists of various kinds of compounds, some of which are highly toxic, corrosive, and/or flammable and are therefore dangerous to both human health and the environment, and some of which pose no hazard even if released in the environment in large quantities. Of all the hazardous liquid substances transported in the Baltic Sea area, oil is by far transported the most. For example in 2010, approximately 290 million tonnes of the international liquid cargo handled in the Baltic Sea ports were oil and oil products (Holma et al. 2011). The amount of liquid chemicals handled annually in the Baltic Sea ports is over 11 million tonnes – and about one half of that (roughly estimated 5.0–6.3 million tonnes) is handled in Finnish ports (Posti & Häkkinen 2012). Even though the volume of chemical transportation may seem small in relation to oil and oil products, the potential risks relating to chemicals may actually be greater. Firstly, chemicals may be far more toxic than oil, and secondly, the high cargo diversity in chemical carriers poses a special risk in accident conditions, as different chemical cargoes with different reactive properties may be mixed together, forming a chemical mixture significantly more reactive and/or more toxic than its parent compounds (Hänninen & Rytkönen 2006). On the other hand, in reality a spill resulting from a chemical tanker accident is typically significantly smaller than a spill from an oil tanker accident (due to smaller transport volumes per ship and compartmentalisation of the cargo). Either way, it is clear that the risks relating to chemical shipping are more difficult to identify than the risks arising from oil transportation. This stems from the fact that thousands of chemicals with different properties are transported by sea each year, and the environmental risk profiles and potentials of these chemicals, compounds and other substances are very complex and highly variable (Malmsten 2001). The chemicals handled in greatest quantities in the Baltic Sea ports are methanol, sodium hydroxide solution, methyl tert-butyl ether (MTBE), xylenes, pentanes, ammonia, phosphoric acid, sulphuric acid, and ethanol and ethanol solutions (Posti &
Tank cleaning in the Baltic Sea – Assessment of the ecotoxicity of tank cleaning effluents   15

Häkkinen 2012). At least hundreds of thousands of tonnes of all these substances are
handled annually – some of the volumes even amounting to over 1 million tonnes per
year. The majority of the most frequently handled substances belong to MARPOL's
pollution category Y, meaning that they are of a moderate hazard if released in the
marine environment. Only MTBE, ethanol and ethanol solutions are category Z
substances, i.e. the hazard arising from them, according to MARPOL, is only minor (for
a more detailed discussion of MARPOL pollution categories, see the following section).

2.3    MARPOL categorization of noxious liquid substances carried in bulk

The regulations on the transport of liquid bulk chemicals are laid down in SOLAS 3
chapter VII (Carriage of dangerous goods) and in the revised MARPOL Annex II (IMO
2011b). SOLAS is an international treaty which concerns the safety of commercial ships
(IMO 2011c), whereas MARPOL is primarily concerned with aspects of maritime
environmental protection. Both treaties require chemical tankers built after 1 July 1986
to comply with the International Code for the Construction and Equipment of Ships
carrying Dangerous Chemicals in Bulk (IBC Code) (IMO 2011b). The IBC code lays
down the construction standards for chemical tankers and identifies and categorises the
substances that may be carried in them. MARPOL Annex II originally entered into
force in 1983 but has since been revised, and the revision entered into force in 2007.
Annex II contains regulations and guidelines on the cleaning and discharge of liquid
bulk chemicals carried in ships. The precise requirements for cleaning and discharge
depend on the pollution category to which the substance at hand has been categorised in
the IBC code. In Finland, MARPOL Annex II is implemented through the Act and
Decree on Maritime Environmental Protection (1672/2009 and 76/2010).

The revised Annex II introduced a new four-category classification system for noxious
liquid substances carried in bulk (previously, there were five categories: A, B, C, D and
Appendix III; Luhtala, 2010). In Regulation 6 of the revised Annex II, noxious liquid
substances are now divided into four categories: X, Y, Z and OS according to their
potential for harm. Another significant change in the revision is that vegetable oils,
which were previously unrestricted, must now be transported in chemical carriers
(Kunichkin 2006). All the example substances in the following are from MEPC (2007)
– the latest list of substances that can be carried in bulk by ships (Chapter 17 of the
IBC-code).

Category X includes liquid chemicals which, if discharged into the sea from tank
cleaning or deballasting operations, would present a major hazard to either marine
resources or human health. Therefore, the prohibition on the discharge of these
substances into the marine environment is justified. Examples of category X substances
are coal tar, pine oil, all isomers of octane, triethylbenzene, and diphenylether.

Category Y chemicals are liquid substances which, if discharged into the sea, would
present a hazard to either marine resources or human health or cause harm to amenities

3
    The International Convention for the Safety of Life at Sea (SOLAS).
16 Honkanen, Häkkinen and Posti
or other legitimate uses of the sea. Therefore a limitation on the quality and quantity of
the discharge of category Y substances into the marine environment is justified. For
example, methanol, phenol, sodium hydroxide, sulphuric acid, vegetable oils, and
xylenes are category Y substances.
Category Z chemicals are not as harmful as the X and Y chemicals: they, if discharged
into the sea, would present a minor hazard to either marine resources or human health
or cause minor harm to amenities or other legitimate uses of the sea and therefore
justify less stringent restrictions on the quality and quantity of the discharge. Examples
of Z category chemicals are diethyl ether, ethyl acetate, methyl tert-butyl ether (MTBE),
isobutyl alcohol and urea solution.
The OS category (Other Substances) contains liquid substances which cannot be divided
into any of the above-mentioned categories (X, Y or Z). They are, at present, considered
to present no harm to marine resources, human health, amenities or other legitimate uses
of the sea. Consequently, there is no compelling need to restrict the discharge of these
substances into the marine environment. Substances such as molasses, apple juice, and
coal and clay slurries are examples of “other substances”. None of the Annex II
requirements apply to OS substances.
The categorisation criteria for liquid chemicals mentioned above are rather broad. More
precise guidelines for the categorization of hazardous liquid substances and mixtures
are, in fact, given in Appendix 1 to Annex II. The actual hazard assessment procedure
for liquid substances on which the categorization is based was carried out by the EHS 4
working group of the Joint Group of Experts on the Scientific Aspects of Marine
Pollution (GESAMP 2002). The working group evaluates new liquid substances to be
transported in bulk by ships based on their toxicity and behaviour in the environment,
both of which arise from the intrinsic properties of the chemical at hand. The GESAMP
rating scale begins with the value 0 (“non-hazardous” or a “negligible hazard”), and
continues through medium values of 1 and 2 to maximum values of 3–6, which indicate
a more severe hazard (GESAMP 2002). The GESAMP hazard evaluation procedure for
a given liquid substance results in a “hazard profile”, and based on these profiles, the
IMO assigns the substances to one of the four pollution categories (X, Y, Z and OS).
The hazard profiles for liquid substances are published regularly, and the composite list
of them is available from the IMO (IMO 2011d).
2.4 Effects and behaviour of chemicals in the environment
The release of chemicals in the environment may result in adverse effects on the
environment and its organisms – the flora and the fauna. The actual chemical-organism
interactions occur at molecular level (e.g. when a chemical binds to a protein or DNA in
a cell), but the effects are reflected on all the higher biological levels, including the
ecosystem level (Fent 2004) (Figure 2.1). Because a viable population needs its
individuals to survive until reproductive age and to grow mature enough to be able to
4
EHS Working Group on the Evaluation of the Hazards of Harmful Substances Carried by Ships.Tank cleaning in the Baltic Sea – Assessment of the ecotoxicity of tank cleaning effluents 17 reproduce, any interferences with an organism’s physiological processes relating to survival, growth or reproduction can understandably also be seen on the population level. Then, if a population of a species declines in numbers or becomes completely extinct as a result of a chemical exposure, the effects on the community structure may be extensive – especially if the affected species is an ecosystem key species (HELCOM 2010c). For example, the extinction of an important predator fish species may lead to massive algae blooms due to the cascade effects along the food chain (Walker et al. 2006). Changes in community structure, on the other hand, may cause shifts in a whole ecosystem and its functions. As seen in Figure 2.1, the effects of hazardous substances are easiest to define on molecular and organism level, but the further one goes on the biological organization scale, the harder it becomes to determine and predict environmental effects. Figure 2.1 Linkages of responses between the biological organizational levels. (Walker et al. 2006) The environmental effects of a single chemical mostly depend on two factors: the toxicity of the chemical and the degree of exposure (e.g. the amount and frequency of the releases; Walker et al. 2006). Simply put, the chemical poses no hazard in the environment if the exposure is marginal, despite the toxicity of the compound. Similarly, even the most substantial exposure to a chemical is insignificant, if the toxicity of the compound is negligible. Of course, it should be noted that in practice these dose-response relationships are rarely as simple as described above (Walker et al. 2006). In addition to exposure and toxicity, the environmental fate of the chemical (i.e.
18    Honkanen, Häkkinen and Posti

its persistency, mobility and tendency to accumulate) contributes notably to the
chemical’s harmfulness (Fent 2004). The environmental fate of a chemical is
determined by both environmental conditions and the properties of the chemical.

2.4.1 Toxicity of a chemical

Mere exposure to a chemical does not necessarily mean that toxic effects will actually
occur. To produce toxic effects, a chemical must, first of all, be taken up by an
organism, and secondly, find a target site inside it. In case of aquatic organisms,
exposure may occur either directly from water or indirectly via food. For example, if a
chemical is tightly bound to sediment, it is not easily taken up by organisms living in
the water phase (e.g. fish). However, worms living burrowed in the sediments could be
exposed to the chemical by consuming contaminated sediment particles. Consequently,
the same fish that was not affected before via water could now be affected by
consuming contaminated worms. Once a chemical is taken up by an organism, it will be
distributed within the organism through the circulatory system (blood or hemolymph),
and the toxic effect will manifest when the chemical binds to its specific target site (to a
molecule, such as receptor, protein, cell membrane or DNA). If an organism lacks the
specific target site for a particular chemical, it will obviously not be affected. Plants and
algae, for example, lack a central nervous system (or a corresponding target site) and are
therefore not affected by neurotoxins. This consequently means that a chemical may
either have a target species, or it may be uniformly toxic to all species, depending on
whether its target site is found in one or in all species (or group of organisms) (Walker
et al. 2006).

Once in an organism, the chemical will be gradually metabolised (either to a less toxic
and water soluble metabolite or to a more reactive and harmful metabolite) and finally,
the chemical or its metabolites will be excreted through urea, feces and/or gills.
Depending on its properties, parts of the chemical may also be stored within the
organism in specific vacuoles in cell membranes or in adipose tissue. When the
chemical is stored, it will not be able to cause toxic effects, i.e. it is not bioavailable.
However, the stored chemical may be released in time, for example when food is scarce
and the stored fat needs to be broken down for energy, and then reach its target site
causing delayed toxicity (Walker et al. 2006).

The most useful way to evaluate the toxicity of a substance is to perform dose
(concentration) – response (effect) tests on organisms of different trophic levels. In
toxicity testing, the relationship between concentration and effect for the test species is
studied, and the test results in a toxicity value LC/EC/IC505, which describes the
concentration where 50% of the test population is affected (Walker et al. 2006). The No
Observable Effect Concentration (NOEC), which is the highest concentration tested at
which no significantly different effects from the control population are observed, may
also be obtained from these same tests. In aquatic toxicity testing, the typical test
5
     LC50; Lethal concentration, EC50; Effect concentration (previously defined end point; for example
     immobilization), IC50; Inhibition concentration (end point may, for example, be growth or
     reproduction).
Tank cleaning in the Baltic Sea – Assessment of the ecotoxicity of tank cleaning effluents 19 species are algae, planktonic crustacean Daphnia (water flea) and different species of fish. The studied end points may be, for example, death, growth, development or reproduction – an effect that is relevant on all organism, population, and community and ecosystem levels (SYKE 2004). In acute testing, the test organisms are exposed to high concentrations for a short period of time (typically 24/48/96hrs), whereas in chronic testing, the test organisms are exposed to lower concentrations for a longer time period – for the whole life cycle, or a part of it. In chronic tests, the sublethal responses (growth, behaviour, reproduction etc.) are usually more important, as the concentrations are not typically high enough to cause death in test organisms. In field conditions, organisms are typically exposed to low concentrations of chemicals more or less frequently. Between acute and chronic testing, the test circumstances in chronic testing are far closer to field conditions. The acute toxicity values, on the other hand, are characteristically so high that such concentrations very rarely occur in nature. Typical situations where organisms are acutely exposed to high concentrations of chemicals are disastrous accidents (e.g. tanker collisions) (Häkkinen et al. 2010). Moreover, the high chemical concentrations after a large spill decrease rapidly in the environment, reaching below acute toxicity levels. Therefore, it is most often preferable to use chronic toxicity data in environmental monitoring and the risk assessment of hazardous chemicals. However, chronic toxicity data for chemicals is hard to obtain because the tests are rather expensive and difficult to perform. Therefore, chronic toxicity data is only available for relatively few chemicals (Häkkinen et al. 2010). Toxicity tests are typically based on national and international standards (SFS, ISO, EN), and the testing of chemicals is performed by the technical OECD guidelines. The testing guidelines of the United States (EPA, ASTM) and Canada (Environment Canada) can also be applied, even though they differ in some parts from the EN and ISO standards (SYKE 2004). 2.4.2 Movements and distribution of a chemical in the (marine) environment Once a chemical is introduced in the marine environment, it will, first of all, be diluted in the vast amount of water, and secondly, be degraded by both chemical processes (e.g. hydrolysis, photodegradation) and by microorganisms (biodegradation) – at least to some extent (Walker et al. 2006). Sometimes, in a process called bioactivation, the biodegradation may lead to the formation of degradation products which are more reactive and toxic than the original parent chemical. A good illustration of the effect of dilution is comparing the total content of haloforms in river water (up to 13.4 μg/l) to that in seawater (0.119 μg/l) (Crompton 2007). In addition to dilution and degradation, the chemical may also exhibit other behaviours. Depending on its properties, the chemical will move between different environmental compartments (water, air, sediment and living biota) until it reaches a steady state. This environmental partitioning and harmfulness of a chemical are linked together in a sense that a chemical is only toxic when its concentration exceeds a certain threshold in a given compartment (Walker et al. 2006). For example, if we consider a situation where a chemical is released in water, the final steady state concentration to which the pelagic organisms
20   Honkanen, Häkkinen and Posti

will be exposed to will be more or less lower than the original concentration during the
release. This is partly due to the fact that parts of the original chemical will, for
example, evaporate into the air and parts of it will be bound to sediments. Of course,
dilution and degradation have a great influence on the chemical concentration as well.

The environmental partitioning, i.e. the environmental fate, of a chemical is a physical
process which is highly dependent on the physico-chemical properties of the chemical,
as well as on environmental conditions (Allen 2002). Based on the chemical’s physico-
chemical properties, it is possible to predict the likely movements and partitioning of a
pollutant in the environment (the fugacity approach) (MacKay 1979). The most
important physico-chemical properties affecting the environmental fate of a substance
are: water solubility, vapour pressure, density, and lipophility (described by the octanol-
water partitioning coefficient, Kow). Implications of the different physico-chemical
properties on the chemicals’ behaviour in the environment are briefly reviewed in the
following.

Water solubility S is a central factor determining the environmental fate of a chemical.
Water solubility greater than 1,000 mg/l makes a substance highly soluble in water
(Nikunen & Leinonen 2002) and thus easily available to pelagic organisms. In
comparison, poorly soluble (< 10 mg/l) and hydrophobic substances are typically tightly
bound to organic particles and the sediment, and are therefore less available for uptake
by pelagic organisms. On the other hand, highly water soluble substances are typically
readily biodegraded and do not, therefore, have the tendency to accumulate in
organisms and food webs (Häkkinen et al. 2010).

Vapour pressure Pvp (Pa) (at 20–25 °C) describes a chemical’s solubility in air. When a
substance has a vapour pressure greater than 0.1 kPa, it is considered highly volatile,
whereas substances with a vapour pressure lower than 10-5 kPa are not readily
volatilized (Nikunen & Leinonen 2002). When a chemical is highly volatile, its risks in
aquatic environments are greatly reduced, as it will volatize into the air and leave the
water system. In the air, substances are rapidly diluted and typically more readily
degraded than in water (Häkkinen et al. 2010). In relation to their environmental fate,
Henry’s law constant H (Pa m3/mol) is also a relevant property, as it characterises the
partitioning of a substance between air and the aquatic phase (“evaporation from
water”). A Henry's law constant greater than 100 Pa m3/mol means that the substance
evaporates extremely easily; values between 1 and 100 Pa m3/mol indicate that the
substance evaporates relatively easily, and values lower than 10-2 Pa m3/mol indicate
that the substance does not evaporate well (Nikunen & Leinonen 2002).

Density (kg/l) is also an important factor determining the final fate of a substance in the
aquatic environment. When a substance has a density lower than that of sea water
(1.025 g/l at 20°C), it will float, whereas a substance with a greater density than that of
sea water will sink (presuming that the compound is neither highly volatile nor water
soluble) (GESAMP 2002). Viscosity (cSt) is a property of liquids. Viscosity determines
a substance’s resistance to flow, and floating substances with a viscosity greater than ca.
10 cSt (at 10–20 °C) have a tendency to form persistent slicks on the water surface
Tank cleaning in the Baltic Sea – Assessment of the ecotoxicity of tank cleaning effluents   21

(GESAMP 2002). Besides centistokes (cSt), other units, such as Pa.s (pascal-seconds)
and poises (P), can be used for viscosity as well.

The solids-water partitioning coefficient Koc describes the compound’s tendency to be
adsorbed into suspended matter (e.g. organic particles in the water phase and sediment).
When the Koc value is high, i.e. > 5,000, the compound will be tightly bound to organic
matter and will not move freely in water. A Koc value between 150–500 indicates that
the compound’s adsorption to solids is moderate, and Koc values lower than 50 indicate
that the compound is not readily adsorbed into particles, and consequently, moves freely
in the water phase (Nikunen & Leinonen 2002).

The octanol water partitioning coefficient Kow (typically presented on a logarithmic
scale; log Kow) is the ratio of a chemical’s solubility in n-octanol and water at a steady
state (Nikunen & Leinonen 2002). The log Kow is an indicator of a chemical's
lipophility/hydrophobicity, and as n-octanol has similar polarity to animal fats, the log
Kow can also be used as an indicator of a chemical's potential to bioaccumulate in
organisms. A compound’s lipophility and the tendency to bioaccumulate increase with
an increasing log Kow value. A log Kow value greater than 4 indicates high and a log Kow
value greater than 5 extremely high lipophility (Nikunen & Leinonen 2002). Owing to
its high lipophility, a substance that is not originally present in toxic concentrations in
the environment may still accumulate in organisms and produce toxic effects in time
(Walker et al. 2006). Additionally, some chemicals which accumulate readily in
organisms have a tendency to bioconcentrate along the food chain, as the predators
receive larger chemical concentrations via food than what the chemical concentration is
in the surrounding water (Grey 2002). Therefore, the concentrations of such lipophilic
chemicals are typically highest (possibly even up to toxic levels) in top predators, such
as fish-eating birds and seals. Even though high lipophility is most often associated with
negative consequences for the environment, lipophilic substances are, on the other hand,
readily adsorbed into sediment and into organic matter in the water phase. Therefore,
lipophilic substances are not necessarily as bioavailable to organisms as highly water
soluble substances are. On the other hand, sediment-ingesting and sediment-dwelling
organisms, such as oligochaeta worms, may be readily exposed to sediment bound
substances (Walker et al. 2006). And, as the oligochaeta worms and other benthos are
an important food source for example for fish, even sediment-bound chemicals may be
introduced to the pelagic food webs.

As mentioned above, the bioaccumulation tendency of a substance can be roughly
estimated from its log Kow value. However, typically more defined and reliable
partitioning coefficients are used to evaluate a chemical’s bioaccumulation tendency.
The bioconcentration factor (BCF) describes the distribution of a substance between the
tissues of a fish (or some other organism) and its surroundings (water) (Nikunen &
Leinonen 2002). The bioaccumulation factor, on the other hand, is the ratio of a
substance between an organism and its food (or ingested water) (Walker et al. 2006).
Factors affecting the BCF are: bioavailability, distribution and biotransformation in an
organism, and excretion (Nikunen & Leinonen 2002). These processes are typically
taking place simultaneously, and it takes some time until a steady state is reached. The
biota-sediment accumulation factor (BSAF) is somewhat similar to BCF, only it
You can also read