Targeted SME Financing and Employment Effects - JOBS WORKING PAPER Issue No. 3 - World Bank Document
←
→
Page content transcription
If your browser does not render page correctly, please read the page content below
Public Disclosure Authorized

                                     JOBS
                                 WORKING
                                   PAPER
                               Issue No. 3
Public Disclosure Authorized
Public Disclosure Authorized

                                  Targeted SME Financing
                                 and Employment Effects
                                                                      Ruchira Kumar
Public Disclosure Authorized

                                    What Do We Know and What Can We Do Differently?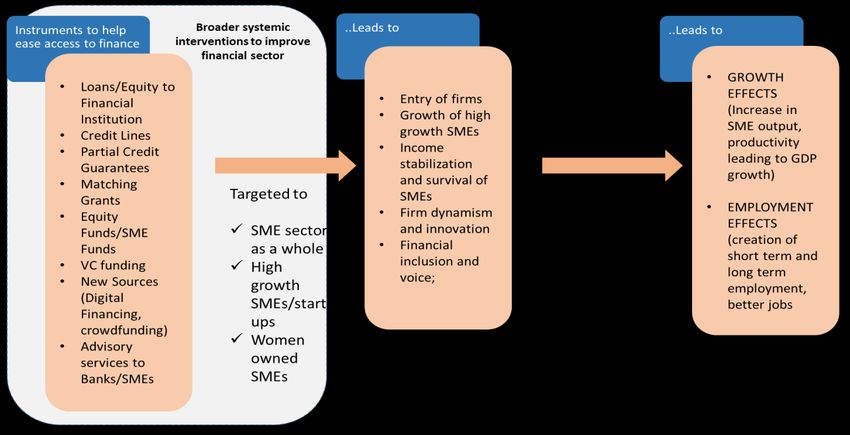
TARGETED FINANCING FOR SME’S AND
EMPLOYMENT EFFECTS: WHAT DO WE KNOW
 AND WHAT COULD BE DONE DIFFERENTLY?

                                RUCHIRA KUMAR

                            Draft Date: 7/17/2017

                                               1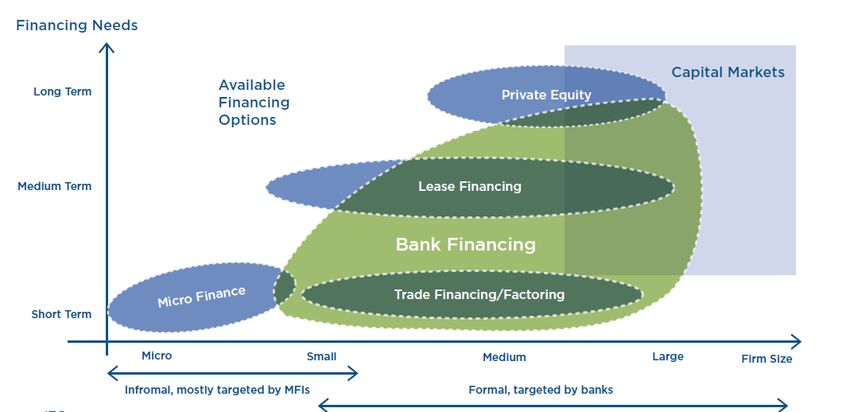
ABSTRACT
SMEs form a dominant share of the private sector in developing countries, and account for more than 50
percent of jobs in their respective economies. Besides their positive employment effects, the growth and
vibrancy of these firms is also important for broader economic growth, diversification of economic base
and as a source of innovation that is exhibited by some of the start-ups. Women-owned SMEs are
emerging as one of the fast growing segments within the SME sector. Youth play an important role in the
creation of new firms and start up activities. Given this importance of SMEs for creation of more, better
and inclusive jobs, there is significant focus on understanding the constraints to growth of this sector and
implementing programs to address them in the World Bank Group and the other development
institutions. Among the several constraints that they face, access to finance is usually cited as the most
important and there are several instruments that can be applied to address this constraint. However, what
is the evidence of impact of these programs on the employment effects? This note brings together the
learnings and evidence from access to finance interventions on employment and provides some
recommendations for development practitioners who seek to maximize this objective from their access
to finance interventions.

                                                                                                          2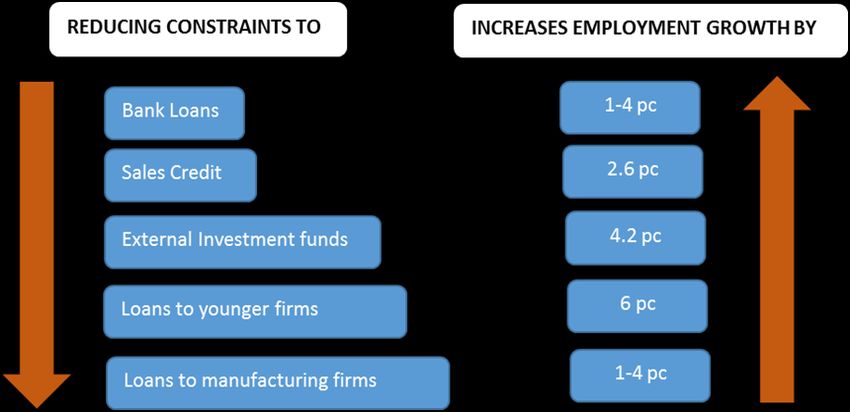
ACKNOWLEDGEMENTS
The principal author of this report is Ruchira Kumar, Senior Private Sector Development Specialist in the
World Bank Group’s (WBG) Jobs Group, and has been reviewed by Simon Bell, Global Solution Lead for
SME Finance in the Finance & Markets Practice Group. Invaluable inputs have been provided by the
Financial Institutions Group Strategy team in IFC, and by John Barham, Senior Strategy Officer, CGRDR,
IFC. The paper has been written under the general direction and guidance of Alvaro Gonzalez (Principal
Economist, Jobs Group), David Robalino (Lead Economist and Manager, Jobs Group) and Thomas Farole
(Lead Economist, Jobs Group).

                                                                                                       3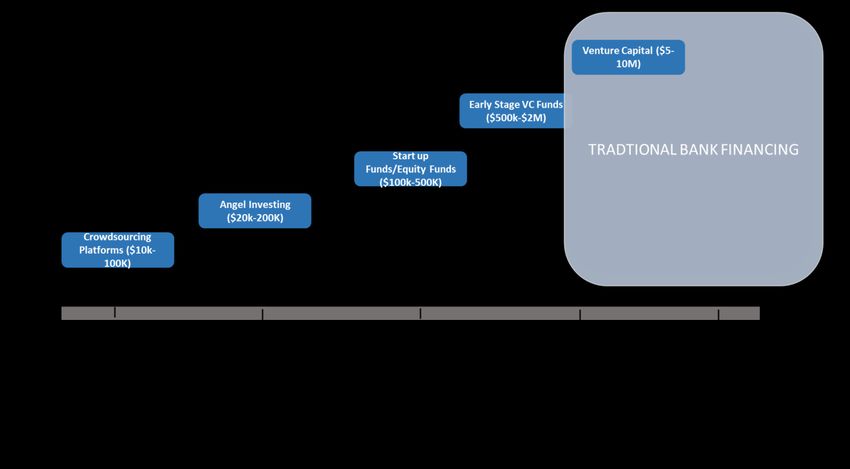
TABLE OF CONTENTS
EXECUTIVE SUMMARY .......................................................................................................................5
I.     THE WORLD OF SMES .................................................................................................................7
A.     WHAT DOES THE SME MAP LOOK LIKE? .......................................................................................7
B.     WHY ARE SMES IMPORTANT? .....................................................................................................8
C.     CONSTRAINTS TO SME GROWTH AND ABILITY TO DO BUSINESS ................................................ 16
II.    ACCESS TO FINANCE FOR SMES AND THEIR EMPLOYMENT EFFECTS ........................................... 21
A.     DEMAND OF AND SUPPLY FOR SME FINANCING ........................................................................ 21
B.     THEORY OF CHANGE: FROM FINANCING INTERVENTIONS TO SMES TO EMPLOYMENT EFFECTS .. 25
C.     EVIDENCE OF EMPLOYMENT EFFECTS OF REMOVING ACCESS TO FINANCE CONSTRAINTS........... 27
III.      IMPLICATIONS ...................................................................................................................... 35
IV.       CONCLUSIONS ...................................................................................................................... 37

                                                                                                                                              4
EXECUTIVE SUMMARY
From the perspective of job creation, Small and Medium Enterprises (SMEs) play an important role.
SMEs, comprising over 90 percent of the private sector among developing countries, create more than 50
percent of jobs in their respective economies. The growth and vibrancy of these firms is also important
for broader economic growth, diversification of economic base and as a source of innovation that is
exhibited by some of the start-ups. Women-owned SMEs are emerging as one of the fast growing
segments within the SME sector. While the employment effects of women-owned SMEs are not
necessarily different from their male owned firms, growth of women-owned SMEs is critical for inclusive
growth. Youth also play an important role in the SME sector given their significance in starting SMEs.
Given the important role that SMEs play, there is great focus on programs to address constraints to SME
growth within the World Bank Group (WBG) and the other development institutions. These include both
systemic programs designed to improve the broader business and financial environment in which these
firms operate, and also targeted interventions aimed at improving firm operations. SME manager opinions
collected through the World Bank Enterprise Surveys indicate that among the several obstacles faced by
SMEs, access to finance is the most important. And there are several instruments designed and
implemented by the international development community to ease this constraint. However, what
evidence exists regarding the achievement of the expected results of these programs by way of creation
of more, better and inclusive jobs? And does this evidence allow us to help design these interventions
better?
This note brings together evidence from existing literature and analysis on creation of more, better and
inclusive jobs through targeted interventions to facilitate access to finance for SMEs. The objective is to
identify solutions for task team leaders that would help them design projects for greater impact on
employment. The scope of the analysis covers formal SMEs in non-agricultural sectors and looks
specifically at targeted interventions for financing for SMEs. While the more systemic interventions aimed
at financial sector deepening are critical for SME growth, these are outside the scope of this particular
review.
The analysis finds that while there is a large amount of empirical evidence on the effects of SME growth
on jobs, there is limited evidence of SME financing interventions at the sector or firm level on job
creation. Evidence is usually collected for identifying impact on SME growth but there is a lack of rigorous
data from program level evaluations on the creation of more and better jobs. SME interventions, including
those for addressing financing constraints, cover a spectrum of objectives from SME income stabilization,
growth, economic diversification and employment. Data suggests that based on objectives, there is a need
for greater targeting of types of SMEs within the broader SME sector. There are some segments of SMEs
which create more jobs than others- the transformational high growth SMEs. Identifying these SMEs using
big data and innovative methods such as psychometric testing is important. From the perspective of
financing interventions, this also means a deeper understanding of not only the SME sector but also the
differing financing needs of different segments of SMEs. This, along with a well-established monitoring
and evaluation program will help to better outline a theory of change and the suite of effective solutions.
The note is organized as follows. In Section I, the note presents a summary of relevant SME statistics, the
role SMEs play and the constraints they face. Section II delves into access to finance constraints for SMEs,
5discusses the different financing instruments used to target SMEs and summarizes the evidence of
employment effects of these access to finance programs. It also looks specifically at particular segments
of SMEs- startups, high growth SMEs and women-owned SMEs to determine what is known about the
effects of targeting their financing constraints. Section III ends with recommendations for future designs
of programs and concludes.
6I. THE WORLD OF SMES
A. WHAT DOES THE SME MAP LOOK LIKE?
There are approximately 35-45 million formal non-agricultural SMEs globally, comprising about 10
percent of the universe of both formal and informal micro SMEs (MSMEs) of 400-500 million.1 Figure 1
shows that of these, approximately 67 percent, or 25-30 million operate in developing countries, with the
largest share in East Asia and Pacific.
FIGURE 1: SHARE OF FORMAL NON AGRICULTURAL SMES; BY REGION
Source: IFC Enterprise Finance Gap Database, 20112
The split of the firms by size by region also highlights the existence of the ‘missing middle’ in developing
countries, or the very small share of medium sized firms (having 50-99 employees).3 For example, as
Figure 1 shows, this segment of SMEs is 20 percent of the total in Middle East & North Africa (MENA) and
close to nonexistent in South Asia. There are several reasons for this problem of the missing middle,
including severe constraints that small and potentially productive firms face in growth. Access to finance
is a key one, with these firms being too large for micro finance institutions and too small for corporate
banking.4 Evidence suggests that if their access to finance constraints were alleviated, they would be able
to generate positive and significant returns to capital. As these firms would grow, there would be a
positive impact on generation of more and better jobs.
The SME sector is also heterogeneous. A large percentage of the SME sector is small, comprising tiny
workshops, service providers and craftsman enterprises. These small enterprises are essentially reluctant
entrepreneurs who do not have access to wage income and are in survival mode. Only a small fraction of
1
IFC Enterprise Finance Gap Database 2011
2
By definition, very small comprises firms with 5-9 employees, small comprises firms with 10 to 49 employees and
medium comprises firms with 50 to 99 employees.
3
The missing middle refers to the shape of the distribution of firms by size in an economy wherein a large number
of firms are either very small and informal, or large and formal. There is a gap of existence of formal medium sized
firms, which is a constraint to the country’s economic growth and employment.
4
In the case of Sub Saharan Africa, the percentage of very small firms is also tiny. Access to any sort of finance,
including micro financing, is scarcer, due to several issues including lack of capacity of the banking system to measure
and manage risks, as well as being geared more towards the business of deposits than lending.
(http://www.economist.com/news/middle-east-and-africa/21701484-africa-has-enterprising-people-too-few-
businesses-opportunities-galore)
7SMEs, about 5 to 10 percent, have the potential to grow larger and more productive if their constraints
are eased.5 However, these ‘high growth’ SMEs or ‘transformational’ SMEs or gazelles account for a
significant percentage of job creation, as much as 25 percent of SME employment, and 40-45 percent of
new employment (ILO 2015).
Of the total number of SMEs in developing countries, women-owned SMEs account for 30 to 37 percent,
or about 8 to10 million SMEs Within size class, women own smaller enterprises, and about 20 percent of
medium-sized enterprises. Further, a majority of women-owned SMEs are in the retail and wholesale
sector (about 40 percent).
Given the difference in types of SMEs, either by age, size, ownership or the countries in which they
operate, they face different constraints. For instance, small, women-owned SMEs, SMEs in certain
sectors such as agriculture, SMEs in fragile states are all more likely to face severe constraints to growth
and survival. More details on the difference in the nature of these constraints are provided in the next
section. The implication is that a clear understanding of the context in which SMEs operate, the
segmentation of the SME sector and the prioritization of their needs is an important prerequisite before
SME programs are successfully implemented.
B. WHY ARE SMES IMPORTANT?
There is a large body of literature that outlines the important role SMEs play in economies including
supporting economic growth, innovation, employment and reducing informality. Figure 2 describes a
simple causal chain of the outcome of easing barriers to the SME sector and the follow on impact on the
larger economy via economic growth and employment. The figure below also lists the types of
interventions that are used to help facilitate these vectors of SME growth and specific variables that reflect
SME sector development. Evidence of the impact of SME development on two key variables- growth and
employment, is discussed thereafter.
5
There are several benchmarks to define these high-growth SMEs including growth rates, employment sizes. (For
example, Coad et al discuss two types of definitions- one is the share of firms in a population that see the highest
growth during a particular period. The other defines such firms as growing at or above a particular pace, measured
either annualized or between start and end year). Global Entrepreneurship Monitor, 5-year study of 800,000
entrepreneurs found that while high growth was 4%, they generated 38% of all jobs. Research on 925 Colombian
companies from Enterprise Surveys found that high growth was 8% but represented 45% of new job creation. NESTA
paper showed 6% of UK firms were high growth.
8FIGURE 2: CAUSAL CHAIN OF EASING CONSTRAINTS TO SME SECTOR
A vibrant SME sector has a significant role to play in the economy.
1. Growth:
A vibrant and growing SME sector is a key ingredient in contribution to growth in both developed
and developing countries. Evidence indicates that SME sector size and economic growth are positively
related though the causal impact on long run growth is not clear (Beck 2005). Figure 3 shows evidence
from an empirical study in the manufacturing sector (Ayaggari 2007) of growing SME sector
contribution to GDP with increasing levels of income. While its contribution to GDP is less than 10
percent in low income countries, the share increases to close to 50 percent or higher in high income
countries.
As countries grow richer, the constraints to SME growth ease up (examples being easier firm entry
and exit, access to finance, electricity, credit information sharing) leading to greater opportunity for
formalization, economic dynamism and innovation among SMEs. If the conditions are provided for
SMEs to thrive, there is a greater churn that allows the most efficient firms to survive and grow in
efficiency, allowing the economy to push toward the productivity frontier. High income countries are
characterized by high rates of entry and turnover of small firms rather than a large SME sector.
Increased opportunities and incentives for formalization also result in a contraction of the informal
sector, which is less productive than the formal sector. Therefore, there is a reallocation of resources
towards more productive uses.
9FIGURE 3: RELATIONSHIP BETWEEN SME GROWTH AND GDP, FORMALIZATION AND ENTRY DENSITY
Source: Adapted from Ayaggari (2007 and 2011). Entry density is defined as the number of newly registered
limited liability firms per 1000 working age people- ages 15 to 64. (World Bank Entrepreneurship Database)
2. Employment: The empirical evidence of SME contribution to jobs is much more robust and clear. In
summary, SMEs contribute the largest share to stock of employment globally across all income
groups, and specifically in the low income countries. In the long run, the number of jobs in countries
may also increase through the indirect spillover employment effects of SME growth which become
linked to larger eco systems. Within the firm size class, it is the smaller and younger firms that
contribute more to dynamic employment growth. In terms of productive jobs, when measured by
wages and labor productivity, it is the medium sized firms that have a dominant share. More
specifically,
a. SMEs have large shares of employment in developing countries though this employment share
exhibits a U shape as one moves from low income to high income countries. More than 50 percent
of formal jobs in developing countries are in small firms6, and SMEs provide approximately two thirds
of jobs in all countries, both developed and developing countries (Ayyagari, 2011). This data is based
on formal nonagricultural enterprises and excludes micro and informal firms. Therefore, the share is
even higher if the latter were taken into account.7 The share of SME employment in total employment
however declines for middle income countries before rising again, thereby creating a U shape as
shown in Figure 4.
6
This is assuming cut off of 100 employees to define SMEs. When the definition expands to firms with less than 250
employees, this percentage share of employment goes up to over 70 pc in developing countries.
7
For example, a literature review of evidence on size and age of firms identifies a study of manufacturing firms in
India that indicates that micro enterprises (1-5 employees) account for 84 percent of total manufacturing
employment. (Hasan and Jandoc, 2009)
10FIGURE 4: SME SHARE OF EMPLOYMENT BY FIRM SIZE AND INCOME GROUPS
Source: Ayaggari, 2007 and 2011
In the long run too, SME growth contributes to employment which are observable at the economy wide
level, as productive firms survive, grow and create jobs directly, and indirectly through linkages to eco-
systems.
b. SMEs are also larger contributors to employment growth compared to larger firms. Figure 5
highlights empirical analysis that indicates that for a majority of countries, both developed and
developing, more than 50 percent of total net employment creation can be attributed to firms
with fewer than 100 employees (Ayaggari 2011). Within regions too, the two size classes (small
and medium) contribute to more than 50 percent of employment growth. In South Asia, this share
is close to 100 percent. Larger firms with more than 100 employees contribute a fraction to job
growth. Further, in countries which witness net job losses, it is the small firms that show net
positive job growth rates, implying that the jobs destroyed by larger firms far outweigh the job
creation by smaller ones. This trend of small firm contribution to job creation is also seen at the
country level. For instance, evidence from Ethiopia indicates that relative employment growth is
largest for the smallest firms (+6 percent for firms with 10 to 19 workers) (ILO 2013). Firm analysis
in Tunisia indicates that between 1996 and 2010, for every year, firms with fewer than 10
employees account for about 55 percent of total net employment growth and those with less than
100 employees account for 73 percent (Aga 2015).
11FIGURE 5: SME CONTRIBUTION TO EMPLOYMENT GROWTH
Source: Ayaggari, 2013
c. Older firms contribute larger shares to stock of employment compared to younger firms, while
it is the young small firms that are larger contributors to net employment growth. This pattern
has been identified in several empirical analyses for firm data in developed countries (Haltwinger,
Klette et al, Criscuolo) and also for data from developing countries. In the latter, data from the
Enterprise Surveys indicates that firms 11 years and older contribute the largest share to stock of
employment (about 35 percent).
However, in terms of contribution to net employment growth, data from developed countries
indicates that younger firms (less than 2 years) are the biggest contributors to net job creation.
Analysis from the Kaufmann Institution shows that virtually all net jobs in the United States over
the period 1980- 2012 were created by firms less than five years old. While young and old firms
have similar job destruction rates, gross job creation rates decline with firm age. In developing
countries, it is firms less than 5 years that grow faster in terms of employment, but size matters.
As Figure 6 shows, it is the smaller, younger firms that are key contributors to employment
growth. Census data from Chinese manufacturing firms over 1998 to 2007 also indicates that net
job growth rates decline with firm age; i.e. younger firms contribute more to net job growth. Older
and larger firms also have high gross job creation rates, but given their higher job contraction,
their net effect in job creation is smaller than younger and smaller firms. It is this cohort of firms
within the broader sector, sometimes called gazelles, or high growth SMEs, or transformational
entrepreneurs or startups, that are key contributors to job creation.
12FIGURE 6: SHARE OF SME’S VS LARGE FIRMS BY AGE ON NET EMPLOYMENT GROWTH
Source: Aga, Francis, Meza, 2015; based on initial sizes of firms
d. SMEs, though primary contributors to jobs and creation of jobs, are less productive and
contribute less to productivity growth than large firms. Figure 7 highlights this difference in labor
productivity and wages by size of firms across different regions. Smaller firms are more
constrained for key factors of production, and less able to overcome these constraints compared
to larger firms which adversely affects their productivity. According to the World Development
Report 2013, larger firms are more productive and innovative, and pay higher wages. Small firms
command a wage premium of the order of 10-30 percent compared to micro enterprises, and
large firms exhibit a premium of 20-50 percent compared to small firms. Evidence from Africa
indicates that firms with 30 employees have twice as much value added per worker than firms
with 5 employees (Page & Soderbom 2012). For firms with more than 100 employees, it is three
times a much. Smaller firms, whose objective is basic income stabilization, are also less likely to
engage in innovative activities that come with increasing capital intensity. A firm with 100
employees on an average employs 3 times more capital than a firm with 10 employees.
Similarly, on wage differential, the above analysis shows that the earnings of the average worker
in a 100 worker firm is about 80 percent higher than his counterpart in a 5 worker firm. Finally,
there is some evidence from data in Ethiopia (Page et al) that wages in small firms do not catch
up to those in large firms even as they grow.
13FIGURE 7: SMEs AND CONTRIBUTION TO PRODUCTIVITY
Source: Small and Medium Enterprises and Decent and Productive Employment Creation, ILO, 2015
e. SMEs have an important contribution in creating inclusive opportunities for women. As
mentioned earlier, women-owned SMEs comprise 30 to 37 percent of all SMEs in emerging
markets, totaling about 8 to 10 million SMEs. Figure 8 shows regional differences and that
women-owned SMEs are fewer in MENA, South Asia and Sub Saharan Africa. Within size class,
women own smaller enterprises, and about 20 percent of medium-sized enterprises. Further, a
majority of women-owned SMEs are in the retail and wholesale sector (about 40 percent). Data
suggest that employment in women-owned SMEs is not necessarily higher than in those owned
by men. In fact, given their smaller size, the total employment is marginally less. However, women
start businesses at a faster rate than men, they are expected to create approximately 50 percent
of new small business jobs by 2018 (IFC 2016).
FIGURE 8: SHARE OF WOMEN-OWNED SME’S BY REGION
Number of women owned SMEs by region & percentage share
6000000 60%
57%
5000000 50%
4000000 40%
# of SMEs
% share
3000000 30%
2000000 20%
14% 14%
10%
1000000 10%
3% 2%
0 0%
Eastern East Asia Latin America MENA South Asia Sub-Saharan
Europe and Africa
Central Asia Very Small Small Medium
Source: IFC Enterprise Finance Gap Database, 2011
14f. Youth are an important segment in specific SME sectors as they are 1.6 times more likely to
display entrepreneurial skills. Figure 9 shows the higher contribution of youth on an average to
start up efforts and ownership of new business. Within the young, it is the 25-29 year olds on an
average who are the most active age groups in startup efforts and in running businesses that are
less than three years old. To the extent that startups and young firms are important for job
creation as discussed previously, focusing on the needs for this set of firms driven by the youth is
important. Young entrepreneurs are also more likely to employ younger people and are usually
active in high growth sectors.
FIGURE 9: CONTRIBUTION OF YOUTH TO START UPS AND NEW BUSINESSES
Source: Towards Solutions for Youth Employment, 2015
All of the above evidence points to the fact that within the SME sector, different types of SMEs are more
likely to create more and/or better jobs. Therefore, it is important to differentiate and target
interventions to specific sub segments within the SME sector depending on whether the objective of
interventions is job creation, diversification of the economic base, or growth of the private sector. For
example, Fafchamps and Woodruff (2011) suggest tools for identification of SMEs with growth and job
creation potential such that programs can be targeted. SMEs that are unlikely to expand and are in survival
mode are more likely to require interventions to mitigate risk or stabilize their income. This would include
basic training and skill building, access to reliable sources of steady finance etc. These approaches
however may or may not have significant employment effects.
On the other hand, the high growth SMEs, or the high growth start-ups, or transformational
entrepreneurs, have different constraints and will require a different set of interventions. As mentioned
earlier, these small share of firms contribute to disproportionately large shares to job creation (ranging
from 38- 50 percent) and also tend to pay wages that are higher than national averages. 8 Focusing on
their specific needs and designing suitable instruments to address their constraints will contribute to the
8
Global Entrepreneurship Monitor, 5-year study of 800,000 entrepreneurs found that while high growth was 4%,
they generated 38% of all jobs. Research on 925 Colombian companies from Enterprise Surveys found that high
growth was 8% but represented 45% of new job creation. NESTA paper showed 6% of UK firms were high growth.
High growth SMEs are also called transformational SMEs, graduate enterprises or gazelles.
15agenda of creating more and better jobs.9 For example, the suite of interventions for these firms would
include more sophisticated products and services such as advanced training around employee
management, focus on R&D and innovation, establishment of management information systems or formal
linkages to markets etc. Since these firms are more productive and pay higher wages, removing barriers
to growth for such SMEs would also translate to better quality of jobs. The challenge is to be able to
identify these SMEs. There is innovative work using psychometric testing that is being applied in some
World Bank Group projects that will be discussed later. Further, as will be outlined in the section on access
to finance interventions, different SME types require different types of financing. An understanding of this
is critical for the intervention to achieve its desired outcome.
The next section summarizes the key constraints to the ability of SMEs to grow and do business, which in
turn creates jobs.
C. CONSTRAINTS TO SME GROWTH AND ABILITY TO DO BUSINESS
According to the latest analysis using World Bank Enterprise Survey (WBES) data, managers of SMEs
across all countries surveyed consider access to finance the biggest obstacle to growth, followed by
competition from the informal sector and then taxation. From an employment perspective, another
analysis based on WBES data from 2006-2010 looks specifically at top constraints for employment growth
among SMEs and again identifies access to finance as the top binding constraint for SME employment
growth across all firm sizes and regions (Figure 10). The other constraint for SME employment growth is
competition from the informal sector again.
When grouped by firm size, the top constraints for the small sized firms continues to be the same as
above- access to finance, informality and tax rates. The top three constraints for medium and large sized
firms also included access to finance and informality, but it was political instability that mattered more to
them than taxation.
9
A study of conversion rates of self-employed people to successful entrepreneurs (and hence employers) in
developing countries shows that a third of unsuccessful self-employed people (i.e unable to employ others) share
the same characteristics as those of their successful counterparts, suggesting they have the potential to grow and
become employers but face external constraints. Hence even before reaching the stage of a potential high growth
SME, there is entrepreneurial dynamism which gets stunted. However, this is outside the scope of this analysis.
16FIGURE 10: CONSTRAINTS TO DOING BUSINESS FOR SMEs
Source: World Bank Enterprise Surveys (2010-2016), Enterprise Surveys (http://www.enterprisesurveys.org), The World Bank.
When it comes to regional differences, managers of SMEs in Africa, Latin America & Caribbean and East
Asia cite access to finance as the biggest constraint to doing business. This is highlighted in Figure 11
below. Given their smaller financial size, SMEs are less able to cope with costs that arise from trying to
access electricity, transportation, costs of business licensing and taxes and other costs of doing business.
SMEs are also less likely to have transparent information on past performance and current operations,
which increases the perception of riskiness. Finally, they are typically too small to be able to exploit
efficiencies in operations and management. In terms of doing business, SMEs present relatively higher
transaction costs; whether it is with financial institutions or larger firms that would allow them access to
markets.
FIGURE 11: BIGGEST OBSTACLE FOR SMEs BY REGION
Source: World Bank Enterprise Surveys (2010-2016), Enterprise Surveys (http://www.enterprisesurveys.org), The World Bank.
According to a 2011 World Bank survey of development banks, SME support was the second most
important mandate after agricultural development. As many as 92 percent of responding development
banks targeted SME clients. For the period 2006-2012, for the World Bank Group specifically, SME
17programs comprised 28 percent of IFC investment projects and 30 percent of IFC advisory projects. The
World Bank’s SME focused support comprised 14 percent of investment projects and 4 percent of
Analytical and Advisory Activities (AAA). Further relevant details are provided in Box 1 below.
18BOX 1: A SUMMARY OF WORLD BANK GROUP SUPPORT FOR SMEs (based on IEG Report, 2013)
The World Bank Group provides a suite of solutions to help address constraints for SME growth and
productivity. These include the systemic policy reforms addressed to improve the business environment
for SMEs, and the targeted approach at firm level (TSMEs). The overall number of projects focusing on
SMEs for the period 2006-2012 comprised 28 percent of IFC’s investment portfolio and 30 percent of its
advisory portfolio. For the World Bank, these figures were 14 percent and 4 percent respectively. Of
these, more than half of the interventions in both institutions were targeted (TSMEs).
In IFC, the bulk of targeted SME support is for financial support of SMEs. More than half the projects are
loans or investment guarantees to financial institutions for onlending to SMEs, or direct investments
including leasing and insurance products. In terms of value, of the total USD 10.5 billion committed to
TSMEs, USD 10 billion comes from this portfolio. Therefore, about 97 percent of the portfolio is
concentrated in the erstwhile Financial Markets industry group. According to the 2013 IEG report that
studied the World Bank Group’s SME portfolio, the regional spread of IFC’s TSME portfolio is
predominantly focused in the ECA region with close to 40 percent of the share.
Targeted SME support through erstwhile IFC Advisory services comprises half of all SME related
services, with a portfolio of about 272 projects being launched in the period 2006-2012, with a total
value of USD 170 million. Of this, almost half the projects provide advice to financial institutions,
predominantly through SME Banking and Farmer/SME Training products.
Similarly, in the World Bank, a dominant share of targeted SME support takes the form of financing
through Lines of Credit (which are channeled through government agencies, state owned banks or
financial intermediaries who on lend to SMEs), Partial Risk Guarantees and Matching Grants as financing
mechanisms. They comprise over half of the total number of TSME project count, and close to 80
percent of the portfolio by value. A large share of this portfolio was concentrated in the erstwhile
Finance & Private Sector Development group (now T&C and Finance & Markets). Regionally, like IFC,
about 30 percent of the World Bank’s TSME portfolio is focused on ECA.
The World Bank’s AAA portfolio for TSMEs is relatively small for this period- 62 relevant projects with a
collective expenditure of USD 11 million dollars. This grossly underestimates the work being done to
support SMEs because this type of analysis is usually multisectoral and the AAA work is therefore
tagged under other categories. OF the 62 identified projects however, the 85 percent related to
19
technical assistance to governments.The rest of the note will focus on the constraint to access to finance, which has been cited as the most
important challenge to growth by managers of SMEs. The note will look at the causal link between
interventions that aim to address this particular constraint and try to highlight evidence that measures
the impact of how these interventions might impact creation of more, better and inclusive jobs. While we
know that SMEs play an important role in job creation compared to large enterprises, there is scarcer
evidence on the extent of this impact, and on how different types of access to finance interventions
targeted at different types of SMEs fare in employment generation.
20II. ACCESS TO FINANCE FOR SMES AND
THEIR EMPLOYMENT EFFECTS
A. DEMAND OF AND SUPPLY FOR SME FINANCING
As discussed in the section above, access to finance was identified as the most important to SME entry,
growth and survival. This is even more so for the smallest firms, of 5to 9 employees and in low income
countries. The extent of the problem is significant with approximately 55 to 68 percent of formal SMEs
estimated to be unserved or underserved by the formal financial sector. This amounts to a credit gap of
approximately USD 1 trillion and is equivalent to about 30 percent of current outstanding SME credit. In
comparison, about 16 percent of formal SMEs are unserved or underserved in developed economies,
amounting to a credit gap of 5-6 percent of outstanding SME credit (Stein 2010).
Regional needs are different with Sub Saharan Africa and MENA requiring the largest increase of 250-
350 percent in outstanding SME financing to close the credit gap. Women-owned businesses have an
unmet credit need of USD 260-320 billion. Besides the general lack of availability of finance, SMEs are
usually provided a narrower range of products from the financial sector. For instance, approximately 30
percent of SMEs also do not have access to deposit accounts, with a deposit gap of USD 300-360 billion
(Stein 2010).
The reasons for lack of suitability for SME bankability are many, both on the supply and demand side.
On the supply side, these include high transaction costs, lack of collateral and high leverage ratios that
arise due to unavailability of equity. Asymmetric credit information and lack of property rights and/or
their enforceability also deters financial institutions to lend to SMEs. This is reflected in the restricted SME
portfolio among financial institutions. SME loans account for 19 percent of total lending volume of
financial institutions in developed countries, and 15 percent in developing countries (IFC 2010). These
institutions typically target larger firm and in most developing countries, commercial banks restrict their
SME activity to fully secured short term working capital facilities or small loans with short tenures.
The very small firms usually fall in the group of those having to source financing from micro finance
institutions that are also limited by their size and financial products such as leasing. It is as firms become
large that the financial sector is willing to bear the risk of providing finance to firms, and other sources
such as private equity and capital markets become available to them. Figure 12 indicates the available
financing options for firms depending on firm size and financing need.
21FIGURE 12: TYPOLOGY OF TYPES OF AVAILABLE FINANCING OPTIONS FOR DIFFERENT SIZED SMEs
Source: IFC 2010
On the demand side, SMEs forgo formal financing on account of relatively high credit costs or lack of
information about financial products. Sometimes, the extensive information requirements of lenders are
a deterrent to firms, either because of weak reporting systems or cost. Finally, smaller firms, which are
unsure about their survival or growth tend to shy away from formal external sources because of potential
inability to repay their debts.
Traditional bank financing sources are available to only 17-32 percent of small firms in low and middle
income countries, compared to over 50 percent of small firms in high income countries. Medium sized
firms in low income countries are also constrained compared to their counterparts, but less so. Large
enterprises are much less so even in low income countries. (Figure 13). On average, a small firm’s
probability of access to a bank loan is less than half of what it is for a medium sized firm and about a third
compared to a large enterprise in the same environment.
FIGURE 13: FINANCING SOURCES FOR SMEs IN DEVELOPING COUNTRIES
Source: IFC 2010
22Besides bank financing, other forms of financing such as private equity that become important for firms
to grow, are even more restricted given the higher credit risk for smaller financial needs. The Venture
Capital (VC) market is also less mature in developing countries. As of 2009, there were approximately 192
investment funds providing support to SMEs (IFC 2010).
Empirical evidence also indicates that age of firm and its export orientation also affects its ability to
access finance. Figure 14 highlights the analysis for firms by age and export orientation and ability to
access sources of finance. Older firms are able to secure financing with relatively more ease than younger
firms. This is most likely because their longer existence presents less risk and higher credit worthiness to
lenders. Similarly exporting firms are more likely to have access to financing compared to firms that serve
the domestic market. This could be due to several reasons including linkages to more credit worthy foreign
firms and being more productive themselves, besides access to foreign exchange revenue streams. These
differences in ability to access finance is important to keep in mind given that these different types of
SMEs have different impacts on creation of more and better jobs.
FIGURE 14: SME ABILITY TO SOURCE FINANCE BY AGE AND EXPORT ORIENTATION
Source: Dinh, 2010
High Growth SMEs and startup firms usually require different types of financing compared to other
SMEs, and these requirements change during their growth cycle. High Growth SMEs and startup firms’
financing needs usually falls outside of the traditional form of bank financing depending on the stage of
their life cycle. As Figure 15 shows, at the nascent stage, they require pre-seed or early seed financing of
smaller sizes. As they grow, angel investments and crowdfunding platforms, early stage equity funds and
venture capital funds become important. Once they have achieved a critical scale and are in the growth
phase, the more traditional forms of bank financing are required. Financing for startup initiatives or firms
run by the youth are an important challenge given the propensity of young people to participate in trying
to start up or run young firms.
23FIGURE 15: FORMS OF FINANCING NEEDS FOR START UPS AND HIGH GROWTH SMEs
Source: Adapted from Summary Report of the World Bank Group Working Group on Small and Medium Sized Enterprises, October
2015, World Bank Group
Finally, the challenge of access to finance for women-owned SME is even bigger. These SMEs are more
likely to cite access to finance constraints as the first or second barrier to business than their male
counterparts. Data on availability of finance to women-owned enterprises indicates that close to 70
percent of women-owned SMEs are unserved or underserved leading to a credit gap of about USD 287
billion, or about 30 percent of the total (IFC 2014). Similar to the overall SME sector financing needs,
women-owned SMEs have different financing needs. For example, women business owners surveyed in
the MENA region cited greater need for long term financing rather than short term working capital.10
Women-owned SMEs are less likely to receive a loan, and they have a lower formal bank account
penetration. While avenues of debt financing has increased for them, they receive a very small percentage
of venture capital and equity funding compared to men. According to an IFC report, women-owned
businesses attract less than 5 percent of VC funding, even though their requirements for starts up are
similar. Yet IFC research indicates that female borrowers have a stronger repayment history and present
greater potential for cross sales compared to male entrepreneurs, making them roughly twice as
profitable for banks as a consumer segment. A research by the US Small Business Administration indicates
that firms that invest in women-owned businesses have higher returns on their investments. Evidence
from the financial sector suggests that angel investing and crowdfunding are more attractive to women-
owned SMEs in growth mode because they are more egalitarian and transparent.
All of the above points to the need for adopting a dynamic approach to identifying and targeting of
SMEs, both women-owned and overall, in terms of their specific financing needs. It is important to
understand the nature of financial constraint by the types of SMEs being targeted, especially if the end
10
From IFC, Vital Voices and MENA Businesswomen Network Report, 2013, in Brookings, 2013.
24objective is employment. Different SMEs, depending on ownership, life cycle, age and size, might require
different financing but will have varying effects on creation of more, better and inclusive jobs.
B. THEORY OF CHANGE: FROM FINANCING INTERVENTIONS TO SMES TO
EMPLOYMENT EFFECTS
In the previous section, we have discussed briefly the sources of supply of financing and the different
needs for it for different types of SMEs at different stages of their life cycle. Alleviating this critical
constraint to doing business for SMEs leads to firm entry, survival and growth, and creation of more and
better jobs.
There are several targeted instruments through which credit constraints to SMEs are sought to be
alleviated. Some of these are indirect- through financial institutions who on lend to SMEs, while others
are direct financial instruments for SMEs. Some of these instruments are targeted by types of SMEs; for
start-ups, high growth SMEs, and women-owned SMEs, while others are broader for the SME sector as a
whole.
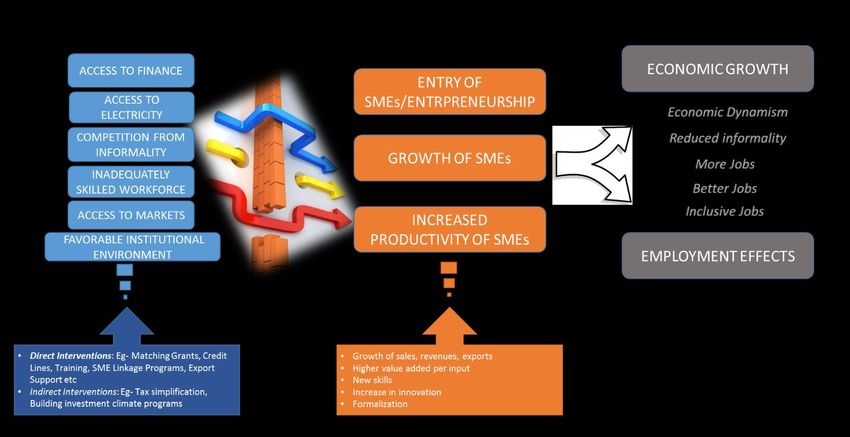
Addressing credit constraints either at a broad systemic level or at the firm level can lead to SME led
growth and employment. A simple theory of change is outlined in Figure 16. Economic growth is fostered
through the growth of entrepreneurship and start-ups, firm dynamism and innovation, achievement of
optimal and larger equilibrium sizes and firm ability to choose more efficient organizational forms. In most
cases, interventions aim to achieve this SME growth and it is through this channel of growth that the
objective of employment generation is also achieved. In other cases, targeted interventions are also
designed with the objective of helping firm creates more and better jobs explicitly. However, as will be
discussed later, evidence of the impact of these types of interventions are scarce.
FIGURE 16: THEORY OF CHANGE FROM INTERVENTIONS TO EASE FINANCE TO IMPACT
25The World Bank Group uses most of the above instruments in its TSME portfolio, details of which are given
in Box 2 below.
However, what evidence exists about the actual impact of these instruments when the objective of the
intervention is creation of more or better jobs? Findings from rigorous project evaluations are scarce.
BOX 2: World Bank Group Interventions for Targeted SME Support on Access to Finance
The snapshot below indicates the targeted SME portfolio for the World Bank Group. In IFC, the
largest portfolio is in the Financial Institutions Group (FIG), while in the World Bank this rests in the
Finance & Markets (F&M) Global Practice.
IFC SME Portfolio (Current O/S Balance/Net Funds World Bank SME Portfolio (Current Active Portfolio) (USD
Commitments (USD Million) Million)
7000 6,623 2500
2,196
6000
2000
5000
1500
4000
3000 1000
2000 500 405.1
114.4 186.7
1000 671 54.5
352
0
0 MFM Agriculture Energy & T&C F&M
MAS SME SME Funds FIG SME Extractives
• 80 percent of FIG portfolio is lending to •
Targeted SME financing interventions from
financial institutions for on lending to F&M comprise government led schemes
SMEs, reaching USD 4.8 million SMEs such as Partial Credit Guarantees (PCG),
annually, creating or maintaining 140 to state owned financial institutional lending
365 million jobs. and direct lending. PCG schemes are
• SME Funds invest in emerging market currently active in 9 countries, managing a
private equity funds, taking equity in total of USD 422 million. F&M also extends
mostly high growth SMEs. SME Ventures lines of credit to governments through
resides here, specifically focused in fragile APEX wholesale funding facilities. The
environments. It has 4 funds covering 6 Practice also assists in the creation of
countries and 61 companies. public- private seed and VC funds,
• MAS (Manufacturing, Agribusiness & strengthening of nascent angel investors
Services) SME lending is through supplier and matching with entrepreneurs.
finance products directly to SMEs or • T&C assists government clients in creation
through anchor firms. of public-private seed and venture capital
• IFC Advisory Services span several activities funds. It also builds capacity of nascent
including linkages, training, development angel investors and match them with
services startups & entrepreneurs.
• World Bank AAA span several activities
Source: WBG Support to SMEs: Snapshot of our Product Offer and Cross Cutting Areas for Further Exploration, World Bank
Group, 2015 including sector work on impact analysis of
SME lending, capacity building, training etc
The next section draws evidence from existing literature that sheds light on these causal links.
26C. EVIDENCE OF EMPLOYMENT EFFECTS OF REMOVING ACCESS TO FINANCE
CONSTRAINTS
While there is empirical evidence from analysis of datasets of SMEs on employment effects, findings
from rigorous evaluations of targeted interventions designed to address finance constraints among
SMEs is scarce. An Independent Evaluation Group (IEG) report on the evaluation of the World Bank Group
TSME portfolio in 2013 highlighted the lack of this rigorous evidence in literature and among WBG projects
as one of the main findings. Several comprehensive meta evaluations find a small share of evaluations of
the universe that have a specific objective of employment generation.11
At the economy wide level, data indicates that increasing the ratio of private credit to GDP, or access
to finance, increases firm entry rate, which is important for a dynamic and productive private sector
that can create more and better jobs. Aghion, Fally and Scarpetta (2007) find for a sample of European
countries that financial development enhances new firm entry in sectors that depend more heavily on
external finance and that the smallest size firms benefit the most in terms of higher entry from higher
financial development. On the other hand, access to financial services can help new entrepreneurs survive
beyond the first year and can help enterprises innovate at a faster rate (Ayyagari 2011)
FIGURE 17: IMPACT OF INCREASING CREDIT ON FIRM ENTRY
Source: IFC Jobs Study, 2013
At the sector level, empirical analysis of WBES data and review of literature also finds that a low level
of financial sector development in general, and low capital market development in specific adversely
11
An ILO study found only 7 evaluations over a 5-year period which aimed to study employment impacts. However,
these were not rigorous enough. Of these, there were none that looked specifically at impact of interventions for
easing access to finance. Two exhaustive meta evaluations of SME programs base their findings on 40-50 evaluations
from the universe of programs that have a specific objective of employment generation. A large number of these
were found to be focused in the Latin American region.
27affects firm growth and hence has an adverse impact on jobs.12 Data shows that weak financial sectors
affect firm size distribution, skewing them towards small and medium sizes, thereby contributing to the
‘missing middle’ phenomenon, which has been mentioned previously. This is even more pronounced in
Africa among firms that are credit constrained or perceive credit as a constraint to business. The literature
also shows that capital constrained firms grow slower than their counterparts, and that access to finance
(along with informal sector competition) are the two most important obstacles for firms across all sectors.
This will be discussed in detail later.
At the firm level, empirical evidence indicates that increasing access to finance leads to job growth.13
Further, the strength of this association changes with firm size, with the effect being stronger among
MSMEs than larger firms. MSME firms with access to a loan exhibit between a 1-4 percent larger
employment growth effect than those without access. This employment effect is also seen to be larger
for firms in industries that are more dependent on external finance. Another empirical study indicates
that access to sales credit, as a form of finance, increases firm employment growth by 2.6 percent, while
access to external investment funds in general increases employment growth by 4.2 percent. Similarly,
the effect of easing access to finance is different depending on age of firm, with younger firms expanding
more than older firms with access to same form of financing. The effect of easing finance on employment
is also higher among manufacturing firms as compared to other sectors such as services or sales. These
effects are summarized in the figure below.
FIGURE 18: EMPLOYMENT GROWTH EFFECTS OF EASING FINANCIAL CONSTRAINTS
Source: Derived from Ayaggari, 2016, Dinh, 2010
EVIDENCE OF FINANCING INSTRUMENTS
Coming specifically to evidence from projects, we first look at findings for specific financing instruments
that are targeted at SMEs.
12
Dinh, 2010
13
Ayaggari et al, 2016
28Several comprehensive meta evaluations of SME financing programs find overall weak employment
effects.14 First of all, there are very few evaluated programs with a stated targeted objective of
employment creation. A majority focus on income stabilization. Further, nothing is known from project
evaluations regarding long term effects or cost effectiveness of the programs (jobs per dollar invested).
At one extreme, evidence of impact of micro credit schemes indicates marginal employment effects.
This is because these schemes are targeted at micro enterprises with the objective being income
stabilization rather than employment generation. They provide small loans of USD100 to USD 2000 which
cannot be ploughed back for investment that might lead to employment growth. It is rather used as
working capital.
Other projects that focus on SMEs with the purpose of employment generation exhibit weak effects,
but impact depends on country context and the targeted SME sector. A meta evaluation of 40 rigorous
studies (Piza et al)15 that focused on employment effects of SME interventions indicates that matching
grants have a positive effect on both SME growth (sales, profits) and employment depending on the
nature of SME. For example, matching grants were found to have a more positive effect on employment
in Africa than in similar firms in Latin America & Caribbean (LAC) because of the greater labor intensity of
firms in the former. Hence, for firms operating below capacity, credit that allows them to grow has a
positive labor effect. Therefore, the same instrument could have different effects depending on the country
of intervention, depending on the existing stage of development of the targeted SMEs. On the other hand,
an IEG evaluation of WBG TSME portfolio found little evidence of jobs impact of matching grants, driven
primarily on account of a weak theory of change and unclear targeting of job creating SMEs. This is further
highlighted below.
There is mixed evidence of effects of Partial Credit Guarantees (PCG) on employment. While panel data
for PCG schemes for SMEs in a group of European countries finds a positive effect on employment
generation (Asdrubali & Signore 2015), another literature review on PCGs across countries finds little
evidence on social benefits of these schemes (Honohan 2008). The IEG Report on analysis of WBG
instruments also found little evidence of employment effects of PCGs, though creation of more and better
jobs was not the development objective of these interventions to start with.
Literature suggests that PCG interventions would be more successful if they were designed with a good
understanding of the expected theory of change (expected outputs, outcomes and final impact) which
could be monitored with a built in system for data collection and/or evaluation. FOGAPE- a Chilean PCG
is an example of an innovative PCG which guarantees loans to small firms, using innovative design
elements such as targeting small firms, instituting variable coverage ratio, unique bidding procedure
allowing banks to bid for guarantees according to the risk profiles of underlying SMEs and using a risk-
based approach with fees. It has an annual reach of 30,000 guarantees but there is no information
regarding the employment that this scheme is generating.
The evidence of impact of Equity finance/VC funds on employment is also mixed, with some studies
showing positive effects specifically for skilled workers, and others showing negative short term
employment effects. Some studies have shown that venture capital can reduce unemployment rates but
14
Piza et al, Grimm & Paffhausen
15
This meta-analysis studies 40 rigorous studies with the objective of looking at employment effects of interventions
on SMEs (less than 250 employees). A majority of these are in LAC.
29mainly for skilled workers. This may be due to a bias towards directing this financing towards the more
productive and high potential SMEs, which would have a higher probability of hiring more skilled workers.
Some studies have shown that private equity backed businesses have superior management practices
than firms with government/family backed ownership. One could argue that to the extent that these
practices result in growth of firms, there might be creation of more or better jobs if the recipients are high
growth SMEs or medium sized SMEs. Other studies on effect of equity funds did not find any significant
effect. Studies show short-term negative employment effect with long-term employment growth
between private equity investments and job growth.
The IEG evaluation (2013) of WBG SME financing portfolio that studied a sample of IFC SME funds found
marginal employment effects.16 However, the defined objective of the fund was expanding reach to SMEs
and SME financial viability rather than employment generation. The evaluation did find that the success
of the fund was contingent on successful transfer of management and corporate governance practices to
investee companies. One could argue that while access to finance was the primary objective, the growth
of the firm was contingent on other inputs such as good management practices that came along with the
package.
This same report also found no evidence of the economic impact of lines of credit, mixed evidence on
private equity schemes in developing country contexts, limited evidence of benefits of matching grants
and advisory services. The primary reason for these findings rested on an ex-ante lack of evidence-based
understanding for the targeted support which resulted in a weak theory of change to begin with, unclear
targeting of SMEs that really needed the support and therefore misaligned expected results which did not
monitor job effects. For example, an IEG evaluation of eight closed TSME lines of credit found that while
the financing was targeted at SMEs, the justification and theory of change was not clear. The project
documents also did not always suggest long term benefits of the interventions, specifically on number or
quality of jobs created. This points to the need for a deeper understanding of the SME sector where
interventions are being designed ex ante, specifically the potential to identify the high growth SMEs, or
young and smaller SMEs, which have the potential for job creation among SMEs. 17
However, micro and macro case studies undertaken by IFC to analyze effects of their banking client
lending to SMEs finds evidence of direct and indirect employment generation. For example, a micro case
study conducted by IFC in Sri Lanka to estimate job growth through SME lending from IFC client,
Commercial Bank of Ceylon (CBC) showed job creation at double the national rate between 2009 and
2012, due to the SME client ability to invest and expand their operations.18 Two macro case studies of
expanding access to banking through IFC operations in Indonesia and Ghana estimated direct, indirect and
induced job creation effects of 67,000 jobs (1 percent of total employment) and 15,400 jobs (1.5 percent
16
IFC invested USD 1.4 billion in 70 TSME funds from 2006-2012, with the objective of further investing in small
businesses. They were predominantly concentrated in South Asia and Sub Saharan Africa. IEG’s evaluation of 15 of
these (more than 1 billion in 196 companies with investments ranging from USD 100,000 to USD 2.2 million per loan)
17
Identification of high growth SMEs and start-ups is a challenging task. There is a significant amount of literature
that deals with definitions and characteristics of this class of SMEs. (Coad et al). There is also innovative work being
done through psychometric credit scoring, business expert panels etc that aim to identify ex ante SMEs and startups
that have a high probability of growth and innovation. (eg- Bruhn, Ruiz, Stucchi)
18
There are several caveats to this data and study including lack of attribution solely to IFC financing or just financing
as an intervention, lack of analysis of job destruction during this period, and potential selection bias by the client
bank.
30You can also read