Tauranga Airport June 2009
←
→
Page content transcription
If your browser does not render page correctly, please read the page content below
Tauranga   MASTER PLAN 2030
Airport    June 2009
Contents                       1
                                       2
                                       3
                                           INTRODUCTION
                                           AIRPORT DESCRIPTION
                                           FORECASTS AND DEMAND
                                                                  1
                                                                  3
                                                                  8
                                       4   PLANNING PARAMETERS    16
                                       5   INFRASTRUCTURE         22
                                       6   MASTER PLAN            27

TAURANGA AIRPORT
MASTER PLAN UPDATE
10423R01G_MP UPDATE.DOC KL 9/09/2010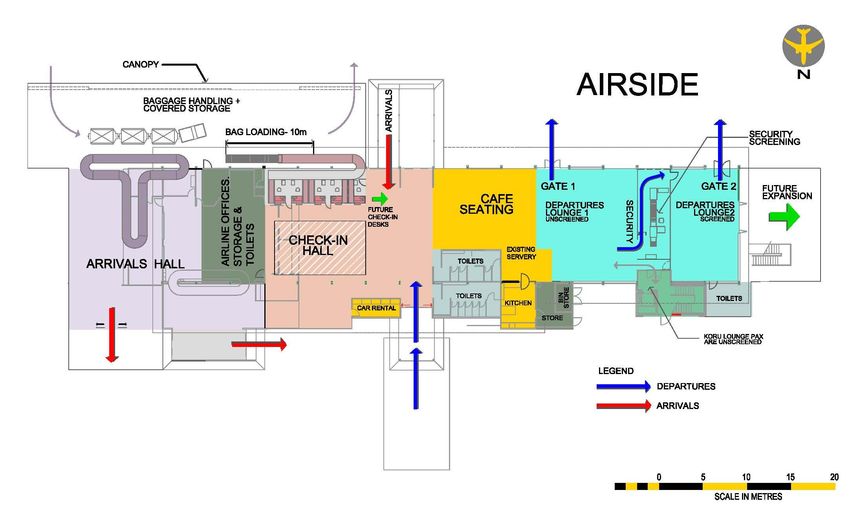
1.1. Background
1 Introduction Tauranga City Airport is a significant strategic asset for the City of
Tauranga and the Western Bay of Plenty region. The Airport is centrally
located in the city area and has a sizeable land holding of 225 hectares, of
which some is leased for non-aeronautical commercial and industrial uses.
Subheadingt The Airport is the third-busiest general aviation (GA) centre in New
Zealand (after Ardmore and Hamilton) and there have been significant
investments made in GA facilities.
The Airport has one main sealed runway and three grass runways, as well
as a link taxiway and apron servicing a moderate sized terminal area.
The Port of Tauranga (seaport) is an immediate neighbour to the west of
the Airport and is also undoubtedly a crucial strategic asset for the city,
community and wider hinterland. Development plans for the port have the
potential to be in conflict with the Airport’s operations and longer term
development, principally through the possible need for port cranes to
operate in areas where they would protrude through the Airport’s obstacle
limitation surfaces, close to the Runway 07 approach surface. A pragmatic
solution is desirable which would allow both ports to operate in harmonious
co-existence.
There have been recent studies investigating whether Tauranga Airport
should be relocated to a new site, possibly serving as a joint regional
airport with Rotorua and Whakatane. However, the studies have not
demonstrated the financial feasibility of a joint regional airport and
Tauranga Airport therefore recognises that it must continue to plan for its
future, to cater for the needs of the users and the community.
Tauranga Airport Authority (TAA) prepared its first Master Plan in 2005 to
guide its development over a planning horizon of some twenty years.
1.2. Objective
The broad objective of this study is to assist TAA with strategic master
planning by updating the Airport’s 2005 Master Plan to a new planning
horizon of 2030
The need for the Master Plan update is driven by a number of factors
which include:
The desire on the part of the TAA to have a clear and logical road
map for the long-term development and management of the Airport
TAURANGA AIRPORT 1
MASTER PLAN UPDATE
10423R01G_MP UPDATE.DOC KL 9/09/2010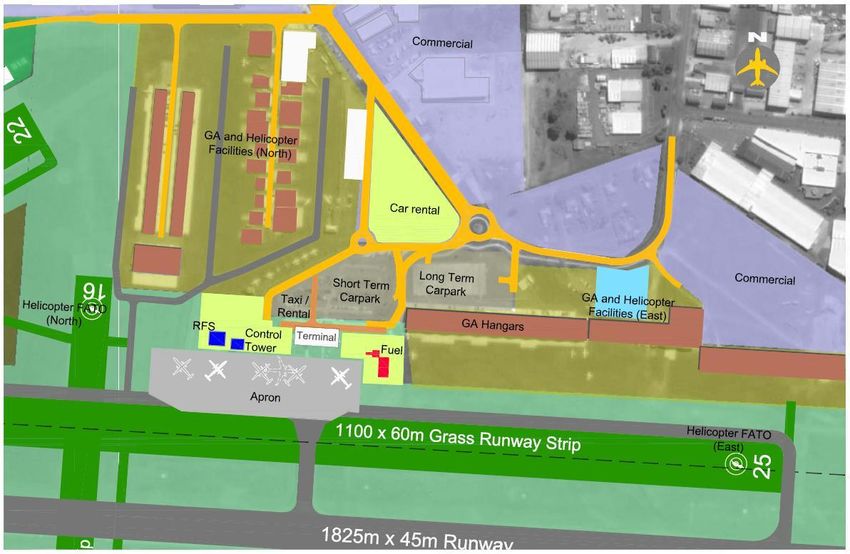
The need to bring together recent planning work for the terminal
building, landside, access roads and commercial areas into an
integrated plan
Growth in passenger traffic
Growth in general aviation activity
Changing aviation regulatory and operational environments
The need to review the status of current and projected aircraft noise
exposure compared with District Plan provisions
The need to anticipate future investment requirements at the Airport,
as the infrastructure ages.
1.3. Consultation
A workshop was held on 3 September 2008 with the Airport Board. The
workshop session provided an opportunity for reviewing key aspects of the
2005 Tauranga Master Plan and consideration of most aspects of the
Master Plan updating process, including reviewing of:
Previous demand projections
Previous forecasts
Constraints and issues
Traffic mix
Steps to manage general aviation (GA) growth and noise
Noise contours
A further briefing on the draft Master Plan was given to the TAA Board on
16 March 2009.
TAURANGA AIRPORT 2
MASTER PLAN UPDATE
10423R01G_MP UPDATE.DOC KL 9/09/2010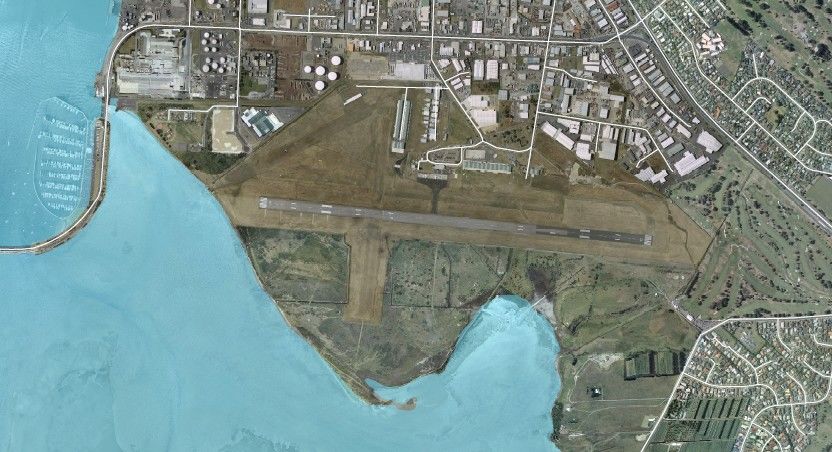
2.1. Introduction
2 Airport Tauranga Airport is located approximately 4 kilometres east of the
Tauranga City centre on coastal land adjoining Tauranga Harbour.
The Airport was opened in 1936 with scheduled passenger services
commencing in 1946. The present main runway was constructed in 1967
Description and extended to its current length in 1998. Air traffic movements totalled
approximately 106,000 movements for 2008.
Subheadingt N Mount Maunganui
Tauranga Harbour
Seaport
Tauranga Airport
City Centre
FIGURE 2-1 AIRPORT LOCATION
2.2. Airport Vision
TAA’s vision as stated in the Tauranga Airport Strategic Plan (2003-2006)
is:
―To successfully operate a commercially viable Airport which is
recognised as a centre for excellent airport transport services, related
facilities and other services‖
The Airport sees its key areas of impact as:
Tourism
TAURANGA AIRPORT 3
MASTER PLAN UPDATE
10423R01G_MP UPDATE.DOC KL 9/09/2010
Environment Auckland, Wellington and Christchurch through its subsidiaries Eagle
Business (aviation and commercial) Airways and Air Nelson.
Transport Tauranga Airport is also the base for Sunair which operates scheduled
services in the north and east of the North Island and has plans to open
Employment new routes. Sunair also has charter and pilot training operations.
Education The Airport is also used periodically by the New Zealand military for IFR
Recreation. training.
Within Tauranga and the greater Western Bay of Plenty region, TAA is A number of small charter and flying training operations are also based at
expected to play an increasingly important role in supporting growth and the Airport along with maintenance providers and the Tauranga Aero Club.
development in the key areas of: Within the Western Bay of Plenty region, the Airport can be seen as an
Adding value to the economy important link between Tauranga City and the wider region, to national
Being commercially successful and, through New Zealand’s international airports, international business
interests. The Airport plays a significant role as an arrival or departure
Providing for needs of travellers point for tourism to the region, as well as being home to flightseeing
Being a centre for aeronautical business. companies.
2.3. Airport Ownership As home to a large number of GA aircraft, Tauranga Airport is the third
The business of TAA is wholly owned by the Tauranga City Council (TCC). busiest GA Airport in New Zealand. The Airport is vital to the fulfilment of
The Airport operates as a business unit within the Council, governed by a the Tauranga City Council’s “Live, Work and Play” vision, providing a
Board consisting of two councillor and three non-councillor members. recreational outlet for many aviation enthusiasts.
Airport land ownership, however, is shared between the Western Bay of A significant current activity at the Airport includes recreational flying
Plenty District Council, Tauranga City Council (TCC) (formerly the operations in microlight aircraft and gliders. Due to their dependency on
Tauranga District Council – TDC) and the Crown. prevailing winds, movements by these types are generally restricted to
periods when there are a low number of powered aircraft movements.
Crown land and jointly acquired land is vested in Trust in the Tauranga City
However, powered aircraft are sometimes restricted when gliders and
Council as a local purpose reserve for ―Airport or associated aviation
microlights need to land. In the future, as traffic at the Airport grows there
purposes‖.
may, as a consequence, need to be limitations placed on glider and
The majority of the Airport land is subject to a claim or various claims microlight operations at the Airport.
before the Waitangi Tribunal.
The Airport also accommodates helicopter activity. Some 10 helicopters
2.4. Airport Role are based at the Airport (including Squirrel and Robinson R22 types) used
2.4.1. Aircraft Operations for fire fighting, training and recreation.
Tauranga Airport fulfils various roles within the overall New Zealand 2.5. Commercial Activities
aviation system as well as within the Tauranga City, Western Bay of Plenty Due to its adjacency to the important Mount Maunganui industrial area to
(BoP) and the local Tauranga communities. The Airport’s role is, in part, the north of the Airport and availability of Airport land to the north of the
defined by the customers/activities that use the airport. main runway and passenger terminal area, TAA has been successful in
On a national scale, Tauranga Airport is part of Air New Zealand Link’s diversifying and growing its revenues to partially off-set costs for aviation
domestic network. Air New Zealand operates scheduled services to users through non-aeronautical commercial property operations.
TAURANGA AIRPORT 4
MASTER PLAN UPDATE
10423R01G_MP UPDATE.DOC KL 9/09/2010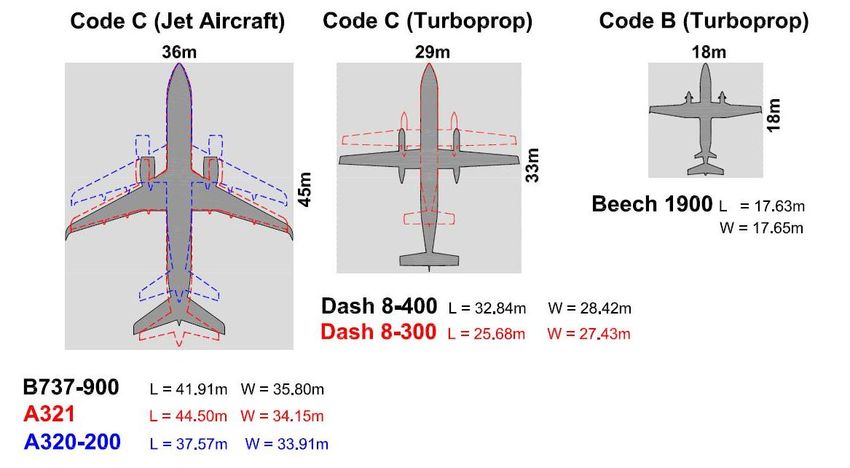
The majority of these involve the provision of land space (via ground of the Airport is defined as accommodating domestic services only, along
leases) to commercial businesses which have developed their own with general aviation (fixed wing and helicopter) operations.
premises and facilities. 2.6. Runways
The current commercially leased areas on Tauranga Airport are illustrated Tauranga Airport has four runways, one main sealed runway and three
on Figure 2-2 and are categorised in the following zones, based on the $ grass runways, a link taxiway and apron serving the passenger terminal.
per square metre lease rate. Zone 1, with Hewletts Road frontage The main runway is a non-instrument Code 4 runway, by virtue of its length
commands the highest lease rate, while Zones 2 and 3 command lower exceeding 1800m.
rates, primarily due to the lack of main road frontage. Key features of Tauranga Airport’s runways are summarised in Table 2-1.
Current occupants include the following:
Zone 1 – car dealers, petrol station, Turners Auctions, caravan sales,
carpet retailer, hire company, boat sales, construction company. Take-off distance (m)
Zones 2 and 3 – Bunnings, Amcor Packaging, Asado Food Runway Surface Width ASDA LDA (m)
Manufacturing, self storage, Firestone, indoor go-carts. 1:20 1:50 1:62.5
07/25 Bitumen 45 1,825 1,885 1,885 1,825
07/25 Grass 60 775 775 775
04/22 Grass 60 640 640 640
16/34 Grass 45 700 700 700
TABLE 2-1 RUNWAY SUMMARY
Source: AIP NZ December 2007
Glossary: ASDA = Accelerate Stop Distance Available
LDA = Landing Distance Available
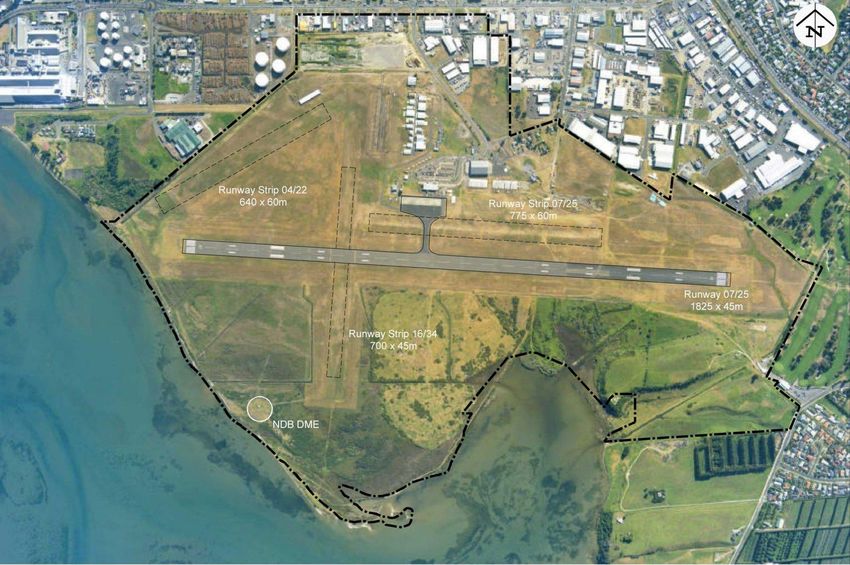
Figure 2-3 shows the key facilities on the existing Airport layout including
the four runways and the location of the installed navigational aids – Non-
Directional Beacon (NDB) and Distance Measuring Equipment (DME).
FIGURE 2-2 COMMERCIAL DEVELOPMENT ZONES
2.6.1. Facilities and Infrastructure
As well as a passenger terminal, Tauranga Airport provides a wide range
2.5.1. Future Role
of other facilities. These include approximately 40 aircraft hangars,
It is reasonable to assume that TAA’s role would not change significantly
servicing about 80 based general aviation aircraft. Tauranga also leases
from the present within the 20 year planning horizon although there will
an area of Airport-owned land for commercial business, while also
likely need to be restraints on rates of growth of general aviation activity to
providing areas for short-term and long-term car parking and the vital
2030.
aviation support, rescue and fire fighting and control tower facilities. Over
There is currently no strong desire on the part of the Airport or its owners and above the facilities described below, Tauranga Airport is also home to
to provide for Tasman or other international services. Thus, the future role an historic aircraft museum.
TAURANGA AIRPORT 5
MASTER PLAN UPDATE
10423R01G_MP UPDATE.DOC KL 9/09/2010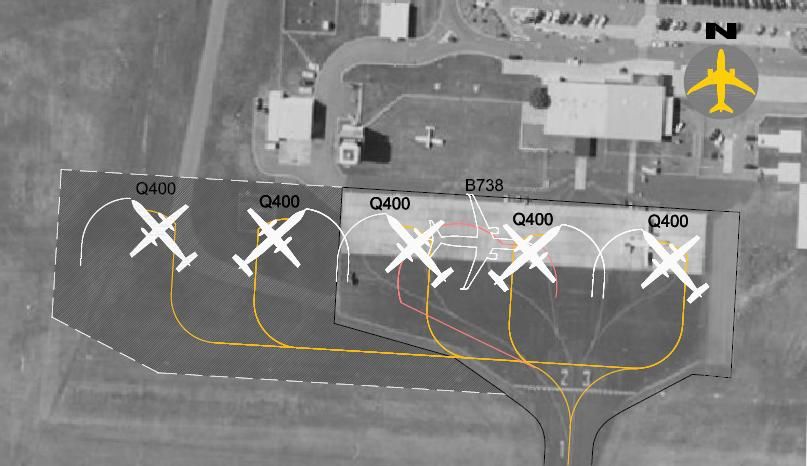
TAURANGA AIRPORT                       6
MASTER PLAN UPDATE
10423R01G_MP UPDATE.DOC KL 9/09/2010
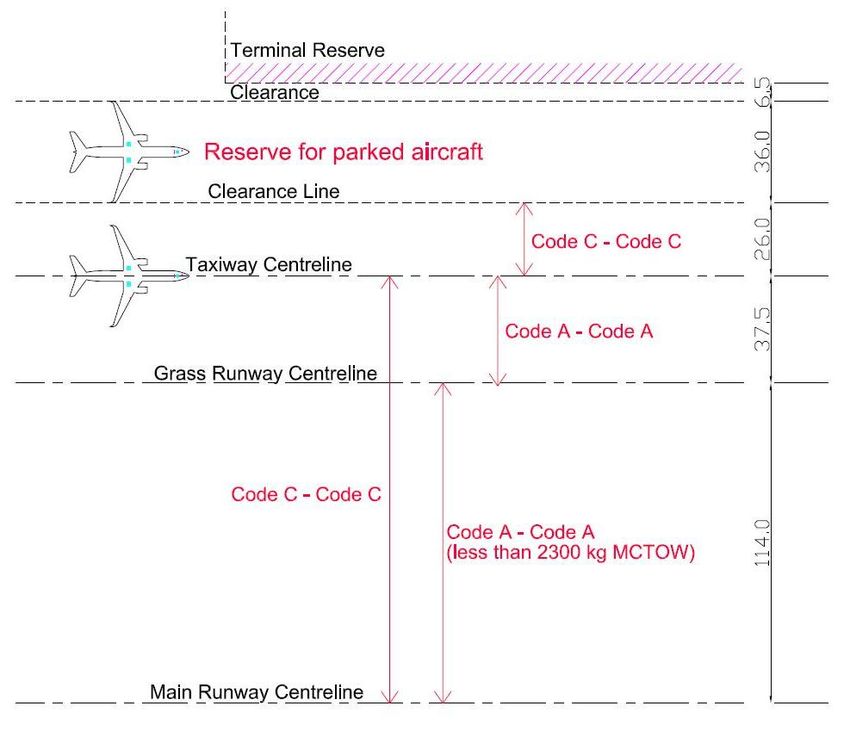
FIGURE 2-3 TAURANGA AIRPORT – EXISTING AIRFIELD LAYOUT TAURANGA AIRPORT 7 MASTER PLAN UPDATE 10423R01G_MP UPDATE.DOC KL 9/09/2010
3.1. Historical Activity
3 Forecasts and 3.1.1. Passenger Movements
Passenger movement data from 2002 to 2008 has been provided by TAA
and has reached 200,000 in 2008. There is no available passenger
movement data for Tauranga Airport prior to 2002.
Demand The total number of passenger movements from 2002 – 2008 has been
increasing at a very strong Average Annual Growth Rate (AAGR) of
12.5%. See Figure 3-1.
Subheadingt 250,000
200,000
Passenger Movements
150,000
100,000
50,000
0
2002 2003 2004 2005 2006 2007 2008
Historical Pax 98,785 122,235 141,924 153,359 171,665 185,745 200,000
FIGURE 3-1 HISTORICAL PASSENGER MOVEMENTS1
Source: TAA
3.1.2. Aircraft Movements
Historical recording of actual aircraft movements has been carried out by
the Tauranga Control Tower operated by Airways Corporation. These
movements are categorised into Visual Flight Rules (VFR) and Instrument
Flight Rules (IFR). See Figure 3-2 and Table 3-1.
1
Either a departure or an arrival or a transit event by a passenger. For airport traffic purposes
one arrival and one departure of a passenger or passengers counts as two movements
TAURANGA AIRPORT 8
MASTER PLAN UPDATE
10423R01G_MP UPDATE.DOC KL 9/09/2010Historical Aircraft Movements (p.a.) 120,000
IFR
VFR
100,000
Year VFR IFR TOTAL
1991 33,119 6,132 39,251
Aircraft Movements
80,000
1992 44,568 5,919 50,487
1993 42,805 6,481 49,286 60,000
1994 42,913 6,601 49,514
1995 45,443 7,323 52,766 40,000
1996 42,173 8,249 50,422
1997 54,880 8,634 63,514 20,000
1998 61,564 8,625 70,189
1999 69,135 8,671 77,806 -
1991
1992
1993
1994
1995
1996
1997
1998
1999
2000
2001
2002
2003
2004
2005
2006
2007
2008
2000 68,057 9,778 77,835
2001 63,827 10,215 74,042
2002 62,917 9,247 72,164 FIGURE 3-2 HISTORICAL AIRCRAFT MOVEMENTS
2003 67,977 9,809 77,786
2004 68,163 11,059 79,222 It is recommended that TAA makes arrangements for the future recording
2005 73,758 11,988 85,746 of aircraft movements in a manner that separately identifies scheduled
2006 82,519 12,103 94,622 passenger aircraft movements and various GA movements (such as fixed
2007 86,256 11,679 97,935 wing, helicopter, gliders and circuits etc.).
2008 94,575 11,472 106,047
However, for the purposes of this Master Plan a separate analysis has
TABLE 3-1 HISTORICAL AIRCRAFT MOVEMENTS been made from a sample of operational data for the month of May 2008,
which was provided by TAA but was recorded by the Control Tower.
The classification of aircraft movements into VFR and IFR is appropriate This sample data was analysed to estimate the percentage split between
for flight operations. However, this classification is less relevant for airport scheduled and GA activities. These splits of aircraft movements were then
master planning purposes as this does not closely mirror two of the scaled up to provide an estimated number of movements for the whole
airport’s primary activities, scheduled passenger aircraft movements and year 2008. This estimate was then used for the “base-line” purposes for
non-scheduled general aviation (GA) aircraft movements. the forecasts. See Table 3-2.
It is reasonable to assume that VFR movements, comprising mainly small
light single and twin engine aircraft, as well as microlights and gliders,
represent solely GA aircraft movements. However, IFR movements are
made up of the following two:
Scheduled passenger aircraft movements, and
GA movements conducted under IFR.
TAURANGA AIRPORT 9
MASTER PLAN UPDATE
10423R01G_MP UPDATE.DOC KL 9/09/2010On the basis of this, it is estimated that the historical average annual
Estimated Aircraft growth rate for GA, including VFR and IFR, has been between 6.0% and
Flight Type Percentage Split
Movements 2008 6.4%.
Scheduled
1991 – 2008 2002 – 2008
Jet - -
Turboprop 8% 8,700 Passengers - 12.5%
General Aviation Total Aircraft Movements 6.0%
83% 88,100 VFR Movements 6.4%
Fixed Wing
Helicopters 9% 9,200 TABLE 3-4 AAGR – PASSENGER AND AIRCRAFT MOVEMENTS
Total 100% 106,000
3.2. Growth Drivers
TABLE 3-2 ESTIMATED AIRCRAFT MOVEMENTS 2008 The underlying growth drivers of aviation activity at airports include:
Source: May 2008 operational sample, Tauranga Airport Authority. Population growth
Tourism (regional, national, world)
3.1.3. Historical Average Aircraft Seating Capacity
An average aircraft seating capacity for scheduled aircraft was determined Growth in local industry, business
using the May 2008 operational sample as this data provided aircraft types Regional and national GDP
for each movement, to which seat capacities were ascribed. The total
Regional tourism marketing
numbers of seats for the year were then estimated using the estimated
average aircraft size. This total number of seats and total passenger Local Council planning initiatives
movements for 2008 indicated a base load factor of 67%. See Table 3-3. Airline marketing
Airline competition
2008 Airline choices of fleet, aircraft size, schedule and frequency
Total Annual Scheduled Movements (est.) 8,700 Mode of transport choices (air versus surface) and relative
convenience and cost.
Total Annual Seats (est.) 300,000
From these, the most relevant to air traffic at Tauranga Airport are
Total Passengers 200,000
considered to be:
Estimated Load Factor 67%
Historical passenger growth rate (2002 – 2008) – 12.5%
Average Aircraft Seat Capacity 34
Statistics New Zealand – Population Growth Forecast for Tauranga –
TABLE 3-3 2008 AVERAGE AIRCRAFT SEATS AND LOAD FACTOR
approximately 1.5% AAGR.
NZ GDP growth forecasts (NZ Treasury) forecast – long term 2.9%,
3.1.4. Growth Rate Trends despite short term recessionary effects in 2009/10.
The historical AAGR for total aircraft movements and VFR movements Figure 3-3 illustrates the historical passenger movements growth rate,
derived from the data in Figure 3-2 and Table 3-1 are shown in Table 3-4. previous Master Plan’s passenger growth rate forecast (High and
TAURANGA AIRPORT 10
MASTER PLAN UPDATE
10423R01G_MP UPDATE.DOC KL 9/09/2010Medium), and also shows growth rates for various indices described above 3.3.2. Passenger Demand Projections
(population growth and GDP growth). The adopted growth rates for master planning have been applied to current
activity levels (2008 domestic) to generate demand projections for
30.0% Passenger year on year grow th
passenger movements, shown in Figure 3-4 and Table 3-6.
Historical Pax - AAGR
25.0%
2004 MP Pax Forecast - High
20.0% 2004 MP Pax Forecast - Medium 600,000
MP 2008 - High
15.0% Tauranga Population Forecast - AAGR
MP 2008 - Median
Growth %
Treasury GDP Forecast
10.0% 500,000 MP 2008 - Low
5.0% Historical Passengers
Passenger Movements
400,000
0.0%
2002
2004
2006
2008
2010
2012
2014
2016
2018
2020
2022
2024
2026
2028
2030
-5.0%
300,000
-10.0%
-15.0%
200,000
Year
FIGURE 3-3 GROWTH RATES 100,000
3.3. Forecast Growth Rates and Projections 0
2002
2004
2006
2008
2010
2012
2014
2016
2018
2020
2022
2024
2026
2028
2030
3.3.1. Passenger Movements
From Figure 3-3 it can be seen that most indicators of growth for the region
(GDP and population) are below 3%, while historical passenger growth
rate has been higher than 10%.
FIGURE 3-4 PASSENGER MOVEMENTS FORECAST
The growth rates adopted for the Master Plan are shown in Table 3-5. High
and Low rates have been adopted to indicate realistic upper and lower
bound forecasts and growth rates have been further moderated from 2014 Domestic Passengers (p.a.)
onwards over the 17 year period to 2030 to avoid unrealistic compounding
growth effects. 2010 2015 2020 2025 2030
High 227,000 306,000 401,000 477,000 567,000
2009– 2013 2014 – 2020 2021 – 2030
Median 223,000 286,000 356,000 409,000 469,000
Domestic passengers – High 6.5% 5.5% 3.5% Low 218,000 267,000 317,000 347,000 379,000
Domestic passengers – Median 5.5% 4.5% 2.8%
TABLE 3-6 PASSENGER MOVEMENTS FORECAST
Domestic Passengers – Low 4.5% 3.5% 1.8%
TABLE 3-5 ADOPTED GROWTH RATES – PASSENGERS
3.3.3. Aircraft Movements – Scheduled
Scheduled aircraft movements have been forecast by estimating the future
average aircraft seating capacities for domestic aircraft types expected to
TAURANGA AIRPORT 11
MASTER PLAN UPDATE
10423R01G_MP UPDATE.DOC KL 9/09/2010operate at Tauranga to/from three key destinations (i.e. Wellington, 16,000
Christchurch and Auckland). In similar way, a view of future load factors Scheduled - High
14,000
has been taken based on historical load factors. Scheduled - Median
Scheduled Aircraft Movements
Scheduled - Low
The results are shown in Table 3-7. 12,000
Scheduled - Historical
10,000
2010 2015 2020 2025 2030 8,000
Average seat capacity 37 41 47 53 57 6,000
Load Factor1 67% 75% 75% 75% 75% 4,000
Average passengers 25 30 36 40 42
2,000
TABLE 3-7 AVERAGE AIRCRAFT SIZE FORECAST 0
1991
1993
1995
1997
1999
2001
2003
2005
2007
2009
2011
2013
2015
2017
2019
2021
2023
2025
2027
2029
Note:
1. Numbers may not compute exactly due to rounding.
FIGURE 3-5 SHEDULED AIRCRAFT MOVEMENTS FORECAST
Applying these aircraft size/passenger forecasts to the annual passenger
projections then generated future scheduled domestic aircraft movement 3.3.4. Aircraft Movements – General Aviation
forecasts. These are shown in Figure 3-5 and Table 3-8. Growth rates for GA were discussed and agreed with TAA during the
consultation process. Despite recent strong GA growth, growth rates from
2008 to 2030 have been set at practical moderated levels to account for
Scheduled Aircraft Movements (p.a.) current efforts by TAA to show the rate of growth and to manage potential
detrimental noise exposure to the community.
2010 2015 2020 2025 2030 However, while these growth rates are projected to taper off over the next
High 9,100 10,050 11,180 11,970 13,350 10 years, they are still reasonably strong growth rates when compared with
normal recreational GA growth experienced in New Zealand which is at a
Median 8,940 9,390 9,920 10,270 11,050 rate of 1-2% per annum. See Table 3-9.
Low 8,740 8,770 8,840 8,710 8,930
TABLE 3-8 SCHEDULED AIRCRAFT MOVEMENTS FORECAST 2009 - 2020 2021 - 2030
GA – High 4.0% 3.0%
GA – Median 3.0% 2.0%
GA – Low 2.0% 1.0%
TABLE 3-9 ADOPTED GROWTH RATES – GA MOVEMENTS
TAURANGA AIRPORT 12
MASTER PLAN UPDATE
10423R01G_MP UPDATE.DOC KL 9/09/2010These growth rates were then applied to the 2008 base of GA movements 3.3.5. Total Aircraft Movements
derived from the May 2008 sample operational sample. These are shown Forecasts for scheduled and GA aircraft movements have been
in Figure 3-6 and Table 3-10. aggregated into total aircraft movements as shown in Figure 3-7 and Table
3-11.
GA Aircraft Movement Forecast (p.a.)
Total Aircraft Movement Forecast (p.a.)
2010 2015 2020 2025 2030
High 105,000 128,000 156,000 181,000 210,000 2010 2015 2020 2025 2030
Median 103,000 118,000 138,000 153,000 168,000 High
Low 101,000 111,000 121,000 126,000 131,000 Scheduled 9,100 10,050 11,180 11,970 13,350
TABLE 3-10 GA AIRCRAFT MOVEMENTS FORECAST GA 105,000 128,000 156,000 181,000 210,000
Total1 114,000 138,000 167,000 193,000 223,000
250,000
Median
GA - High
GA - Median Scheduled 8,940 9,390 9,920 10,270 11,050
200,000
GA - Low GA 103,000 118,000 138,000 153,000 168,000
GA Aircraft Movements
GA - Historical
Total1 112,000 127,000 148,000 163,000 179,000
150,000
Low
100,000
Scheduled 8,740 8,770 8,840 8,710 8,930
GA 101,000 111,000 121,000 126,000 131,000
50,000 Total1 110,000 120,000 130,000 135,000 140,000
TABLE 3-11 TOTAL AIRCRAFT MOVEMENTS FORECAST
0
Note:
1991
1993
1995
1997
1999
2001
2003
2005
2007
2009
2011
2013
2015
2017
2019
2021
2023
2025
2027
2029
1. Numbers may not add due to rounding
FIGURE 3-6 GA AIRCRAFT MOVEMENTS FORECAST
TAURANGA AIRPORT 13
MASTER PLAN UPDATE
10423R01G_MP UPDATE.DOC KL 9/09/2010 Whether the surrounding airspace is capable of safely handling that
250,000
Total - High
level of future traffic, particularly considering the diverse mix of
Total - Median
large/fast and small/slow aircraft.
Total Aircraft Movements
200,000
Total - Low Whether users of the airport themselves want that level of activity and
Total - Historical
150,000
whether the major contributors to that level (GA) would be capable of
meeting the costs of the necessary infrastructure.
100,000 A possible outcome of such further study by TAA might be a decision to
progressively impose further restraints on growth on some components of
50,000
airport activity, targeting an acceptable long-term threshold and mix of
traffic.
0 This Master Plan does not yet include any outcomes of an assessment of
1991
1993
1995
1997
1999
2001
2003
2005
2007
2009
2011
2013
2015
2017
2019
2021
2023
2025
2027
2029
desirable long term traffic levels or the application of possible future
restraints on growth.
FIGURE 3-7 TOTAL AIRCRAFT MOVEMENTS FORECAST 3.5. Busy Hour Aircraft Stand Demand
Tauranga Airport does not formally hold or record information on busy day
3.4. Potential Restraints on Growth and busy hour movements and this information is not recorded in a
The AAGR for GA aircraft movements from 1991 – 2008 has been just comprehensive way by Airways in the Control Tower.
over 6%. The forecast level of total aircraft movements shown in Table However, sample information on Tauranga’s daily scheduled passenger
3-11 is still very high in the mid to later stages of the master planning movements (arrivals and departures) for a weekday was provided by
horizon. By comparison, the busiest airport is currently Ardmore Airport Tauranga Airport. This data was analysed to determine the busy hour
with approximately 200,000 annual movements. stand demand for that sample day which was shown to currently be a
This high level of forecast movements is driven primarily by the GA maximum of two passenger aircraft. However, there are reported times
component of traffic, projected at what are essentially unconstrained when a third stand is occupied due to maintenance or later-running
growth rates, albeit at moderate rates. requirements.
The implications of this possible level of growth are being studied by TAA Based on this analysis, the aircraft stand demand for 2030 was determined
to assess: to be 5 Code C capable stands, based on the following long-term
assumptions for morning peak departures:
Whether TAA wishes to eventually be operating such a major GA
facility. 2 Code C jets – Wellington and Christchurch
Whether the aircraft noise exposure arising from that level of activity 1 Code C turboprop – Auckland
would be acceptable to the community, noting that current levels of 1 Code B/C turboprop – another destination
noise exposure are very close to existing District Plan noise control Possible 5th contingency stand.
boundaries and higher traffic levels would likely require changes to
District Plan controls. 3.6. Busy Hour Passenger Demand
Based on the busy hour stand demand forecast assumptions above, a
Whether the capacity of the system of runways and taxiways is
busy hour passenger projection for 2030 was developed, as shown in
capable of handling that level of future traffic. Table 3-12, based on the following key assumptions:
TAURANGA AIRPORT 14
MASTER PLAN UPDATE
10423R01G_MP UPDATE.DOC KL 9/09/2010 MTP = Medium Turboprop (e.g. Q300)
LTP = Large Turboprop (e.g. Q400X)
RJ = Regional Jet (e.g. E190)
Load Factor = 80%
Busy Hour Passenger Forecast 2030
Route Aircraft Seats Busy hour pax
TRG-AKL MTP 50 40
TRG-WLG RJ/LTP 100 80
TRG-CHC RJ/LTP 100 80
Other route MTP 50 40
Total 240
TABLE 3-12 BUSY HOUR PASSENGER FORECAST 2030
TAURANGA AIRPORT 15
MASTER PLAN UPDATE
10423R01G_MP UPDATE.DOC KL 9/09/20104.1. Design Aircraft
4 Planning The largest aircraft which currently operates at Tauranga Airport is the
B737-300 on charters a few times a year, while the largest scheduled
aircraft regularly operating is the Bombardier Dash 8-Q300 turboprop
aircraft.
Parameters The main type of larger aircraft within the Master Plan 2030 horizon is
expected to be Dash 8 sized (up to 74 seats) types. Nevertheless, as is the
case at present, irregular charters by jet aircraft of the B737 size are likely
to continue and within the 20 years period of this Master Plan, the aircraft
Subheadingt size used can be anticipated to grow to B737-800 or A320/321 types.
Therefore, flexibility should be preserved for limited operations by such
larger Code C size aircraft.
Key dimensions of the main aircraft types that could be expected to
operate on the main runway within the 20 year time horizon of this Master
Plan are illustrated on Figure 4-1.
FIGURE 4-1 AIRCRAFT DIMENSIONS
4.2. Airfield Planning Parameters
Planning parameters to be adopted for the airfield are based on
requirements in the CAANZ Advisory Circular AC139-6, (Aerodrome
Design – All Aeroplanes above 5700 kg MCTOW) and CAANZ Advisory
Circular AC139-7 (Aerodrome Design – All Aeroplanes at or below 5700 kg
TAURANGA AIRPORT 16
MASTER PLAN UPDATE
10423R01G_MP UPDATE.DOC KL 9/09/2010MCTOW - Non Air Transport Operations). (i) the aerodrome control provider and the aerodrome operator are
Key planning parameters for the main runway 07/25 and grass runways the same, or there is written agreement between them regarding
are provided in Table 4-1. the operation; and
(ii) the visibility is at least 5 km; and
Criteria Code B1 3 Code C1 2 (iii) neither runway is adversely affected by contaminants; and
Runway strip width 60.0m/45.0m4 150.0m (iv) both aircraft are in two-way communication with aerodrome
control; and
Runway centreline – taxiway centreline 52.0m1 93.0m1 (v) pertinent traffic information is issued; and
Runway width 45.0m (vi) the adjacent runway edges are clearly defined; and
Runway shoulder width (each side) - (vii) one of the following applies—
a. the adjacent edges of the two runways are not less than 165
Taxiway centreline – obstacle 21.5m 26.0m metres apart; or
Taxilane centreline – obstacle 16.5m 24.5m b. both aircraft have an MCTOW of 5700 kg or less, and the
Taxiway/Taxilane width 10.5m 15.0m/18.0m5 adjacent edges of the two runways are not less than 90 metres
apart; or
TABLE 4-1 PLANNING PARAMETERS FOR MAIN RUNWAY 07/25 c. both aircraft have an MCTOW of 2300 kg or less, and the
Notes:
adjacent edges of the two runways are not less than 60
1. CAANZ AC 139-6, CAANZ AC 139-7 Based on the rules above, in Tauranga Airport’s case, subject to these
2. Non-precision approach runway Code 4 for domestic operations other conditions being met, the provisions allow for simultaneous
3. Non-instrument runway day only, Code 2 for domestic operations
4. 60m strip width if used by aeroplanes with a wingspan 24m or less and 45m width if the
operations by two small aircraft that could normally use a Code 1 runway
wheelbase is 18m or less on parallel runways at a centreline to centreline separation distance less
5. 15m taxiway width if used by aeroplanes with a wheelbase less than 18m and 18m width if than 120.0m, and as close as 112.5m (for condition C above).
the wheel base is 18m or more
4.4. Runway End Safety Area (RESA)
Runway End Safety Areas (RESA) are cleared and graded areas
4.3. Parallel Runway Separation extending from the end of a runway strip to reduce the risk of damage to
The current centreline to centreline separation distance between the main an aeroplane in the event of a runway undershoot or overrun.
runway and the parallel grass runway is 111.5m. NZCAA Rule 139.51 requires airports operating runways for regular air
According to the CAA rules in AC139-6 (and similar in AC139-7), a transport services to or from New Zealand to provide a RESA at the end of
separation of 120.0m should be provided between parallel runways for the runway strip.
simultaneous operations under Visual Meteorological Conditions (VMC) As Tauranga Airport is not operating international services this requirement
when the larger runway Code number is Code 1. This can be interpreted is not mandatory. However, the RESA requirements would become
as providing for simultaneous operations by small aircraft that could applicable if the main runway were to be extended (by 15m or more) or if
normally use a Code 1 runway (i.e. less than 800m in length). the runway were to be upgraded to be an instrument runway.
However, the provisions of Rule 172 state: The Master Plan identifies areas that there are land spaces potentially
172.281 Operations on parallel runway available for RESAs at the ends of the main Runway 07/25.
Same direction parallel runway operations may be permitted by There are no requirements for RESAs on the grass runways.
day when —
TAURANGA AIRPORT 17
MASTER PLAN UPDATE
10423R01G_MP UPDATE.DOC KL 9/09/20104.5. Helicopter Operations
Figure 4-2 depicts planning parameters for Touchdown and Lift-off Area
(TALO), and Final Approach and Take-off area (FATO) and
approach/departure paths for a Bell B212 design helicopter in accordance
with AC139-8A (Aerodrome Design: Heliports).
FIGURE 4-3 FUTURE WHARF EXTENSIONS
Source: Impact of Tauranga Port Developments on Tauranga Airport Operations – Hoskin
Consulting Limited.
FIGURE 4-2 HELICOPTER PLANNING PARAMETERS
Source: CAA AC139-8A Aerodrome Design: Heliports The following are the study’s conclusions:
The proposed northern extension of the Sulphur Point Wharf by 170m
4.6. Constraints
will have no impact on the existing operations at Tauranga Airport.
Physical and operational constraints to be taken into account for planning
future development at Tauranga Airport are described below. The existing wharf can be extended to the south by up to 122m
without effecting existing approach and departure procedures,
4.6.1. Port of Tauranga provided that the NDB operation and associated signal in space is in
The possible expansion of the Port of Tauranga potentially creates a major accordance with the relevant parameters of ICAO Annex 10 Volume 1
operational constraint on Tauranga Airport, resulting from the cranes at the and navigation tolerances of ICAO PANS OPS Document 8168. An
seaport penetrating Obstacle Limitation Surfaces (OLS) associated with extension of greater than 122m will require the existing NDB/DME
the Airport. Runway 07 and RNAV (GNSS) Runway 07 Instrument Approaches to
An aeronautical study was carried out by Hoskin Consulting Limited (HCL), be withdrawn.
investigating the impact of Tauranga Port developments on Tauranga A proposed southern extension of greater than 286m would require
Airport operations. See Figure 4-3. the Runway 25 instrument departures to be withdrawn. This limit is
TAURANGA AIRPORT 18
MASTER PLAN UPDATE
10423R01G_MP UPDATE.DOC KL 9/09/2010effectively as far as the wharf’s southern extension can go without A Sulphur wharf extension of 170m to the north and up to 122m to the
placing at risk the Airport’s ability to accommodate IFR operations, south without the requirement for any change to the current operating
noting the need for upgrading the electronic and visual navigation procedures at Tauranga Airport.
aids. Further extension to the south of up to 286m, conditional upon the
The relocation of the electronic ground based navigation aids to the Airport’s navigation aids being upgraded to VOR/DME and relocated
northern side of the runway or on the extended centreline to the east to an on runway extended position or to the north side of the Airport.
plus upgrading the NDB to a VOR would enable revised instrument An unlimited number of cranes may operate within the
approaches to be developed for Runway 07 with the southern aforementioned extensions and existing wharf up to a maximum
extension. As the full southern extension of 385m would only provide height of 100m AMSL.
46m of lateral clearance from the revised approaches VSS and given
the size of the vertical penetration of the cranes through the Inner 4.6.2. Elevated Land
Horizontal OLS, along with the higher than normal approach MDA/H a High ground in the southeast of the Airport site would require extensive
safety case is likely to require additional lateral buffer to be achieved. earthworks to remove should this area be required for aviation purposes.
Any southern extension would likely require upgrading the visual 4.6.3. Maori Burial Ground (Urupa)
navigation aids, by supplementing the simple approach lighting A Maori burial ground (Urupa) is located adjacent to (and outside) the
system and single side Precision Approach Path Indicator (PAPI), with Airport boundary in the southeast sector. No encroachment onto this area
Runway Threshold Identification Lights (flashing strobes) and dual would be possible.
side PAPI. 4.6.4. Marae
If an ILS was to be implemented for Runway 07 the wharf’s southern A Marae is situated to the west of the main runway 07/25. Although
extension would be limited to 319m or the southernmost crane would buildings on the marae do not infringe the OLS, some of the marae land
be limited to an elevation not above 89.3 AMSL. Although an ILS lies close to the end of the runway strip end and ongoing dialogue with iwi
would enable lower approach minima to achieved for Runway 07 it should ensure that this part of the land does not get developed in a way
may not in effect enable any additional wharf extension over that of a that would induce gathering of people at the end of the runway. In addition,
VOR given that the Runway 25 instrument departure requirement the marae and its premises and activities may be a future source of
detailed in 3 above places a greater constraint on the wharf’s potential sensitivity to aircraft noise from airport operations.
development. 4.6.5. Low Lying Land
The development of a new instrument departure for Runway 25 for The southern portion of the Airport land holding is generally low lying. As a
the full proposed southern extension of 385m would require higher consequence, the southern end of runway 16/34 becomes waterlogged
take-off meteorological minima, maximum permitted turn to the south during wet water, particularly during the winter months, which results in
on crossing runway end, enhance VOR navigation and extended flight periodic closure of the runway.
by visual reference until passing the wharf. This would require
Much of the area is understood to be the site of a former tip. As a
completion of a full safety case and a successful outcome can not be
consequence, there are potential contaminated soil issues that would need
assured at this initial stage.
to be addressed should any development of the area be proposed.
The study also recommends that the Port of Tauranga and TAA Authority
4.7. Airport Noise
agree that the next 10 year Tauranga District Plan permits:
Use and development associated with Airport operations is required under
the Tauranga District Plan to adopt the best practicable option to ensure
TAURANGA AIRPORT 19
MASTER PLAN UPDATE
10423R01G_MP UPDATE.DOC KL 9/09/2010noise levels do not exceed standards set at their innermost control
boundaries.
Noise emission levels resulting from aircraft operations have been
predicted up to 2006 using methods recommended by NZS6805:1992
Airport Noise Management and Land-Use Planning. A combination of the
airport boundary and the noise contours for 2006 have been used as a
basis for the noise control provisions.
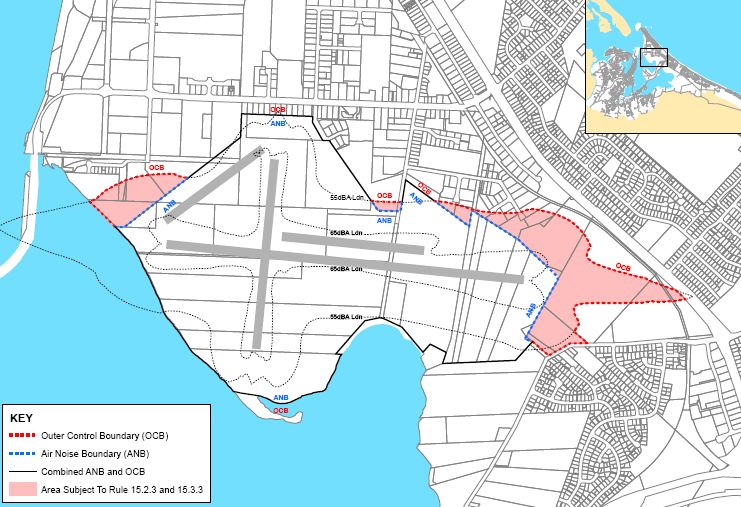
The important controls for land use planning are the Air Noise Boundary
(ANB) and Outer Control Boundary (OCB). The ANB lies virtually entirely
within the property boundary of the Airport so the probability of noise
sensitive land uses locating within this operational area is considered very
low.
For the most part, the OCB lies within the Airport property or over water. A
small area intrudes into a corner of the Whareroa Marae Community Zone.
See Figure 4-4.
New noise-sensitive land uses are prohibited inside the ANB. However,
between the ANB and the OCB noise-sensitive activities are required to be
provided with appropriate noise insulation. There are no mandatory
controls for activities outside the OCB.
It is likely that redevelopment of the Airport may see support activities,
such as visitor accommodation, wishing to locate nearby, in which case the
insulation rules would apply.
4.8. Height Limitations
The approach and departure surfaces as well as circling areas surrounding
an Airport are defined by Obstacle Limitation Surfaces (OLS). OLS are
conceptual (imaginary) surfaces associated with a runway system which
identify the lower limits of the airspace surrounding an aerodrome above
which objects become obstacles to aircraft operations.
Activities and structures must not exceed a height indicated by the Airport
Height Areas and Approach Surfaces, which are set out in the District
Plan, unless an aeronautical study (in accordance with Civil Aviation
guidelines) determines the proposal would not adversely affect the safety
or significantly affect the regularity of aviation operations.
TAURANGA AIRPORT 20
MASTER PLAN UPDATE
10423R01G_MP UPDATE.DOC KL 9/09/2010FIGURE 4-4 CURRENT AIRPORT NOISE CONTROL BOUNDARIES
Source : Tauranga District Plan
TAURANGA AIRPORT 21
MASTER PLAN UPDATE
10423R01G_MP UPDATE.DOC KL 9/09/2010In the development of an airport, the airport owner and stakeholders have
5 Infrastructure made significant investments in the facilities that make up the
infrastructure. As a consequence, an airport Master Plan should retain as
much as possible of existing facilities and infrastructure, where this is
economically and operationally feasible. Also, the airport owner, in order
Subheadingt to maximise returns from the overall airport asset, may choose to develop
areas that are identified as not being required to accommodate aviation
activities in the long-term.
In the case of Tauranga Airport, all existing facilities are functioning
satisfactorily and, assuming that they are well maintained, could be
expected to do so throughout the 20 year planning horizon.
5.1. Runways
An assessment was carried out to investigate the need for a potential
future runway extension of the main Runway 07/25. This assessment took
into consideration the domestic routes (especially the longest route) that
would service to/from Tauranga within the master planning horizon, and
the design aircraft flown on such routes.
This assessment produced runway lengths required for the various aircraft
types that would service on the longest domestic route (i.e. Christchurch –
Tauranga and vice-versa). See Table 5-1.
Aircraft Type Runway Length Required1
B737-800/900 1800m
Jet A320/321 1700m
E190 1450m
Q400X 1600m
Turboprop
Q300 1100m
TABLE 5-1 RUNWAY LENGTH ASSESSMENT
Notes:
1. Assessment based on TRG-CHC (longest route from/to TRG)
This assessment concluded that the main Runway 07/25, with its current
length of 1825m would satisfactorily be able to service all domestic routes
TAURANGA AIRPORT 22
MASTER PLAN UPDATE
10423R01G_MP UPDATE.DOC KL 9/09/2010using the largest Code C passenger aircraft type (B737-900) and that there expected that this will likely suffice for the planning period of this Master
is no current need for an extension. Plan.
As discussed in previous Section 4.4, there is no mandatory requirement However, as discussed in Section 4.6.1, an extension of the Port of
for this runway to accommodate RESAs as the Airport serves only Tauranga wharf by more than 122m to the south would likely require a
domestic routes, unless the runway is extended by a further 15m or if it is significant change to the current operating procedures and possibly require
upgraded to an instrument runway. However, the Master Plan protects the installation of an ILS for Runway 07 approaches. The upgrading of the
blocks of areas on both ends of the runway to show indicative (not runway to be a precision approach runway would require the runway strip
imperative) RESA lengths for this runway. to be widened to 220m (for a domestic aerodrome under CAA AC139-6) or
The two grass cross Runways 04/22 and 07/25 are retained in their to 300m (under ICAO Annex 14, Vol 1).
existing configurations. With the centreline of the main runway being just 220m from the southern
TAA advised that the current centreline to centreline separation distance building line of the terminal, there would be insufficient lateral clearance to
between the parallel grass Runway 07/25 and main Runway is 111.5m. As position parked aircraft on the apron and accommodate a taxilane, if the
mentioned previously in Section 4.3, according to the provision of Rule 172 300m runway strip width were to be adopted.
the required minimum runway separation for parallel, simultaneous Code 1 However, there would be sufficient lateral clearance to allow for a 220m
operations should be between 112.5m and 120.0m. wide strip. Therefore, it is recommended that long-term protection for a
As is explained in Section 5.4 following, it is recommended that grass future 220m wide runway strip to be adopted for the main runway in this
Runway 07/25 be slightly re-adjusted from its current centreline separation Master Plan.
distance of 111.5m from the main runway to 114.0m. 5.3. Apron
A location is also shown for a possible third parallel grass runway to the The Master Plan provides parking positions for 5 turboprop aircraft up to
south of the main runway, at a separation of 210m, which would allow Q400 size on the passenger terminal apron. Alternatively, the apron
simultaneous operations of Code C on the main runway and Code B on accommodation would be one B737-800 and three Q400s, all free-moving,
that grass runway. See Figure 5-1.
It is unlikely that this runway would be required for capacity reasons within The apron provides for a minimum of 6.5m clearance to the southern
the Master Plan horizon, particularly given TAA efforts to restrain growth of building line of the terminal, 36.0m for parking a B737-800 (and for
GA activity. manoeuvring turboprops), and 26.0m clearance to the taxilane. At that
position, the taxilane is at a separation of 37.5m from the centreline of the
The most likely reason for implementing such a runway in the future would grass runway and is able to accommodate:
be if demand for GA hangar facilities required the development of a new
precinct on the southern side of the Airport, in which case there would be Code C aircraft on the taxilane, Code C aircraft on the main runway,
operational benefits from having a GA runway in close proximity, avoiding but no aircraft on the grass runway; or
the need for crossing the main runway. Code A aircraft simultaneously on the taxilane, grass runway and
Although it is quite unlikely that this third parallel runway will be needed, it main runway (with limitations of less than 2300kg MTOW for
is recommended that the optimum alignment be identified and protected in simultaneous runway operations).
the Master Plan.
5.2. Runway Strip
The main Runway 07/25 is currently surrounded by a 150m wide runway
strip, appropriate for a non-instrument domestic Code 4 runway. It is
TAURANGA AIRPORT 23
MASTER PLAN UPDATE
10423R01G_MP UPDATE.DOC KL 9/09/2010FIGURE 5-1 TAURANGA AIRPORT – 2030 APRON LAYOUT TAURANGA AIRPORT 24 MASTER PLAN UPDATE 10423R01G_MP UPDATE.DOC KL 9/09/2010
5.4. Taxiways
The Master Plan provides for the apron taxilane to be multi-purpose, being:
A Code C taxilane servicing the apron
A Code A taxiway, allowing simultaneous Code A operations on the
grass runway, and
A future Code C taxiway alignment, allowing simultaneous Code C
operations on the main runway.
It is envisaged that a future Code C taxiway would not need to extend the
full length of the main runway because of the low frequency of operations
by jet aircraft that would need to use the full length of the runway. Instead,
the future Code C taxiway is indicated to extend east and west to the
thresholds of the grass 07/25 runway, providing access to that runway but
also to the main runway at positions allowing for sufficient distances for
take-off and landing for aircraft up to Q400 size, being:
1450m from Runway 07 threshold to eastern taxiway link
1600m from Runway 25 threshold to the western taxiway link
Additional taxiway enhancements shown in the Master Plan include:
Recommended sealing of three taxilanes servicing the GA facilities in
the north of the Airport
FIGURE 5-2 RUNWAY SEPARATION DISTANCES
Relocation to the west of a short section of the link taxiway from the
northern GA facilities area, needed in the long term to accommodate
the westerly extension of the passenger terminal apron
5.5. Terminal
In 2008, a terminal concept was developed that catered for a possible
Extension of link taxiways southwards to service a third parallel second airline operation at the Airport. This concept’s strategies are as
runway, should that ever be built. follows:
The Master Plan separation dimensions are summarised in the following Pedestrian plaza along the terminal front and a pedestrian
Table 5-2 and Figure 5-2. environment along the landside face of the terminal.
Allocating sufficient car rental and taxi parking spaces into the
Master Plan Separation Distances (m) northwest of the passenger building.
Expansion of short term and long term carpark.
Main Runway 07/25 centreline – Grass cross Runway 07/25 centreline 114.0
Future roundabout proposed to aid traffic near the short term carpark
Main Runway 07/25 centreline – Centreline of Code C taxiway 151.5 egress and access to GA hangars
Centreline of Code C taxiway – Apron (aircraft parking) 26.0 Strategies for the proposed developments inside the passenger terminal
TABLE 5-2 RUNWAY AND TAXIWAY SEPARATION GUIDE
building are as follows:
TAURANGA AIRPORT 25
MASTER PLAN UPDATE
10423R01G_MP UPDATE.DOC KL 9/09/2010 Providing new security screening for secured departures lounge. 5.7. Commercial
Extending inbound reclaim conveyor Sites to the north and northeast of the Airport boundary are virtually fully
occupied with leased commercial businesses.
Providing an expanded, secure departures lounge with two common
user departure gates TAA has advised that it does not intend to extend areas of commercial
activities beyond the current areas, within the Master Plan horizon.
Separating arriving and departing passenger flows and eliminating
flow of arrivals passengers through check-in
Providing café seating landside and airside
Existing kitchen area to serve both cafes
Providing new common user check-in desks and improved outbound
BHS
Extending the inbound reclaim conveyor to 20m presentation length
Expanding the arrivals hall / baggage reclaim and provide a new
forecourt canopy
The primary reason for the expansion of the arrivals hall to the eastern
side is for the requirement to extend inbound reclaim. While in the
departure hall, the primary reason for the reconfiguration of the departure
layout area is to cater the extension of check-in facilities and the allocated
new security screening.
The Terminal Master Plan is shown in Figure 6-2 and the Terminal Building
Master Plan is at Figure 6-3.
5.6. Navigation and Landing Aids
Currently, the installed navigation aids at the Airport (NDB and DME) are
located at the southwest of the Airport site. This location is appropriate and
is retained in the Master Plan.
The recent study from Hoskin Consulting Limited noted that the current
aircraft landing/taking-off procedures would not require any changes as
long as southerly extensions to the Sulphur Point wharf and extent of port
crane operations was limited to no more than 122m.
However, an extension of the wharf and crane operations further than
122m to the south would require changes to airport procedures and would
likely require upgrading of visual navigation aids (possible approach
lighting system) and a possible instrument landing system, as discussed in
Section 4.6.1.
TAURANGA AIRPORT 26
MASTER PLAN UPDATE
10423R01G_MP UPDATE.DOC KL 9/09/20106.1. Airport Master Plan
6 Master Plan The Tauranga Airport Master Plan 2030 is shown in Figure 6-1. It
addresses all the issues and facilities discussed in this report.
Key features of the Master Plan are as follows:
Retention of the existing main Runway 07/25 without need for an
extension.
Protection of a 220m wide runway strip around the main runway
Identification and protection of areas for possible future RESAs at
each end of the main runway (not a mandatory requirement at this
stage).
Identification of the alignment of a taxiway that would serve as a
partial length Code C parallel taxiway to the main runway, a full length
Code A taxiway to the grass runway and a Code C taxilane to the
apron.
The existing grass crosswind Runway 16/34 is retained.
The existing grass Runway 04/22 is retained primarily for glider and
microlight operations.
Identification and protection of the alignment for a possible third
parallel grass runway to the south of the main runway, with link
taxiways to the northern GA facilities area.
The existing passenger terminal is retained with provision for future
expansion.
Apron expansion catering for 5 Code C turboprop aircraft (Q400) or 1
B737-800 and 3 Q400’s.
Provision for future car parking capacity to the east of the passenger
terminal
The existing installed NDB/DME is retained.
The existing control tower and rescue and fire fighting facility are
retained.
A gliding and microlight aircraft operations zone is indicated on the
southwest side of grass Runway 04/22.
Commercial zones are provided around the northern perimeter of the
northern sector.
TAURANGA AIRPORT 27
MASTER PLAN UPDATE
10423R01G_MP UPDATE.DOC KL 9/09/2010 Two main GA and helicopter facilities are provided in the northern
sector and northeast sectors along with FATOs.
Land allocated for expansion of the Urupa (burial ground) in the
southeast sector.
Provision of green space (undeveloped land) in the southern sector.
6.2. Terminal Master Plan
Key features of the Terminal Master Plan are illustrated in Figure 6-2 and
include:
Separation between arriving and departing passenger flows.
Expansion of the arrival hall to the east site to provide baggage
reclaim facilities extension.
Expansion of secured departure lounge with the new security
screening and the possible expansion departure terminal to west site.
TAURANGA AIRPORT 28
MASTER PLAN UPDATE
10423R01G_MP UPDATE.DOC KL 9/09/2010FIGURE 6-1 TAURANGA AIRPORT – 2030 AIRPORT MASTER PLAN TAURANGA AIRPORT 29 MASTER PLAN UPDATE 10423R01G_MP UPDATE.DOC KL 9/09/2010
FIGURE 6-2 TAURANGA AIRPORT – 2030 TERMINAL MASTER PLAN TAURANGA AIRPORT 30 MASTER PLAN UPDATE 10423R01G_MP UPDATE.DOC KL 9/09/2010
FIGURE 6-3 TERMINAL BUILDING MASTER PLAN TAURANGA AIRPORT 31 MASTER PLAN UPDATE 10423R01G_MP UPDATE.DOC KL 9/09/2010
TAURANGA AIRPORT                       32
MASTER PLAN UPDATE
10423R01G_MP UPDATE.DOC KL 9/09/2010
You can also read