Journal of Economic Psychology
←
→
Page content transcription
If your browser does not render page correctly, please read the page content below
Journal of Economic Psychology xxx (2013) xxx–xxx

                                               Contents lists available at SciVerse ScienceDirect

                                          Journal of Economic Psychology
                                       journal homepage: www.elsevier.com/locate/joep

Tax evasion and emotions: An empirical test of re-integrative
shaming theory
Giorgio Coricelli a,b,c,⇑, Elena Rusconi d,c, Marie Claire Villeval b
a
  Department of Economics, University of Southern California, 3620 South Vermont Avenue, Los Angeles, CA 90089-0253, USA
b
  University of Lyon, Lyon F-69007, France; CNRS, GATE, 93, Chemin de Mouilles Ecully, F-69130, France, IZA, Bonn D-53113, Germany
c
  University of Trento, Center for Mind/Brain Sciences (CIMeC), Via Delle Regole 101, 38100 Mattarello (TN), Italy
d
  University College London, Institute of Cognitive Neuroscience, 17 Queen Square, WC1N 3AR, London, UK

a r t i c l e        i n f o                        a b s t r a c t

Article history:                                    Shaming can be either of two types, shaming that becomes stigmatization of the offender
Available online xxxx                               and favors his exclusion from the community, or shaming that is followed by forgiveness
                                                    and reintegration of the deviant. Here we test experimentally these aspects of shaming the-
JEL classification:                                  ory with a repeated tax-payment game, in which the shaming ‘‘ritual’’ consisted of display-
H26                                                 ing the evader’s picture in addition to charging monetary sanctions. Results show that
C91                                                 when cheating is made public and the contravener is not successively reintegrated, the
PsycINFO classification:
                                                    total amount of cheating is significantly increased compared to when cheating is made
Motivation and emotion 2360                         public but publicity is immediately followed by reintegration. The former condition is asso-
                                                    ciated with more intense negative emotions related to cheating. This suggests that the
Keywords:                                           employment of a social shaming mechanism may be an effective, albeit very sensitive, tool
Tax evasion                                         in the hands of policy makers.
Moral emotions                                                                                         Ó 2012 Elsevier B.V. All rights reserved.
Shaming theory
Cheating behavior
Experiment

    ‘Cultural commitments to shaming are the key to controlling all types of crime. However, for all types of crime, shaming
    runs the risk of counterproductivity when it shades into stigmatization.’
    J. Braithwaite – Crime, Shame and Reintegration (1989)

1. Introduction

   Shame is a self-conscious emotion that can act as a force for social conformity and social cohesion (Lewis, 1992). The
anticipation of shame, or shame avoidance, is thought to motivate the individual to accept his/her responsibility for the
welfare of the group (de Hooge, Breugelmans, & Zeelenberg, 2008; Lewis, 1971; Tomkins, 1962). In criminological litera-
ture, shaming refers to ‘all social means of expressing disapproval with the intention of invoking remorse in the person
being shamed and/or condemnation by others who become aware of shaming’ (Braithwaite, 1989). Shaming can be either
of two types: shaming that becomes stigmatization of the offender and his exclusion from the society of law-abiding

 ⇑ Corresponding author at: Department of Economics, University of Southern California, 3620 South Vermont Avenue, Los Angeles, CA 90089-0253, USA.
Tel.: +1 (213) 740 2432; fax: +1 (213) 740 8543.
     E-mail addresses: giorgio.coricelli@usc.edu (G. Coricelli), e.rusconi@ucl.ac.uk (E. Rusconi), villeval@gate.cnrs.fr (M.C. Villeval).

0167-4870/$ - see front matter Ó 2012 Elsevier B.V. All rights reserved.
http://dx.doi.org/10.1016/j.joep.2012.12.002

Please cite this article in press as: Coricelli, G., et al. Tax evasion and emotions: An empirical test of re-integrative shaming theory. Journal
of Economic Psychology (2013), http://dx.doi.org/10.1016/j.joep.2012.12.002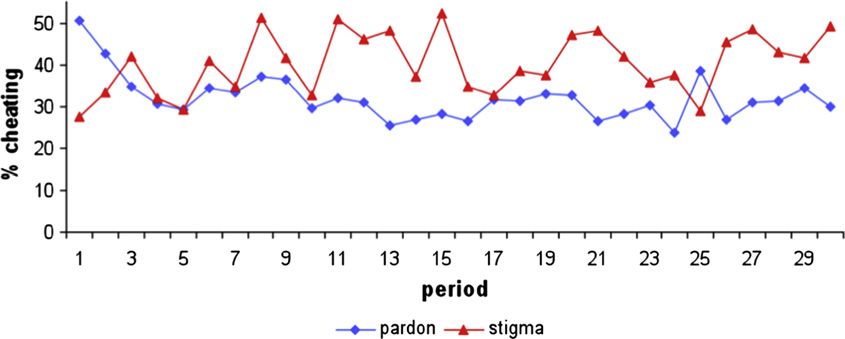
2                                       G. Coricelli et al. / Journal of Economic Psychology xxx (2013) xxx–xxx

citizens, and shaming that is followed by forgiveness and reintegration of the offender. According to Braithwaite (1989),
the most effective form of shaming is not usually applied from the State but occurs in micro-groups of interdependent
people. Re-integrative shaming would lead to lower crime rates, with disapproval dispensed without eliciting rejection
by the disapprovers or dismantling potentialities for future disapproval. Stigmatization, instead, would make criminal sub-
cultures, that reject the rejectors, more attractive. One powerful means of stigmatization, is labeling (Becker, 1963). When
a negative label gets applied to an individual who has supposedly broken any socially accepted rule, it becomes part of the
individual’s identity, and from then on he/she is ‘apt to employ his/her deviant behavior or a role based upon it as a means
of defense, attack, or adjustment to the problem created by the societal reaction’ (see Lemert, 2002). A label applied after
‘primarily deviant’ behavior may thus become a key aspect of the individual’s identity, and prompt ‘secondarily deviant’
behavior.
    In tax law enforcement, for example, it is well known that deterrence-based enforcement strategies, especially when per-
ceived as unfair according to self-reports, can cause a paradoxical reaction or intention of future resistance to compliance
and disrespect for the law (e.g. Murphy, 2008; Murphy & Harris, 2007). Here, we aimed to test the predictions of shaming
theory in a controlled white-collar crime context with an experimental tax-payment game.
    The importance of shame and more generally of emotions in tax compliance has been almost unexplored. The standard
economics-of-crime model formulated by Allingham and Sandmo (1972) and Yitzhaki (1974) has inspired many empirical
tests (see Alm, 1991; Cowell, 1990; Andreoni et al., 1998; Elffers, 1991; Slemrod, 2007 for surveys). If these tests confirm
the basic mechanisms of the deterrence models, they however reveal much more compliance than predicted. Relaxing the
hypothesis of risk neutrality and assuming risk aversion is not sufficient to explain the level of compliance observed in
empirical settings (Bayer & Sutter, 2009). This has motivated the exploration of other dimensions of tax compliance, such
as the heuristics and biases that lead individuals to overweight small audit probabilities (Alm, McClelland, & Schulze,
1992), or the importance of equity and the role of voting on the use of taxes (Pommerehne et al., 1994). The role of
tax morale (Cummings, Martinez-Vazquez, McKee, & Torgler, 2009; Kirchler, 2007; Torgler, 2002), ethics, social norms
and social interactions has been investigated more recently (Fortin, Lacroix, & Villeval, 2007; Lefebvre, Pestieau, Riedl,
& Villeval, 2011; Myles & Naylor, 1996). Civic norms (Slemrod, 1998), moral appeals (Blumenthal, Christian, & Slemrod,
2001; Schwartz & Orleans, 1967), or expectation of collective blame (Bosco & Mittone, 1997) have been shown to exert
contrasted influence on tax compliance without, however, fully explaining it. In this paper, we investigate a new hypoth-
esis by considering that our understanding of tax compliance can be improved by analyzing the role of emotions in
dynamic settings.
    Our expectation is that both income reporting and audit, possibly followed by sanctions, elicit emotions in individuals.
We assume that emotions do not simply proxy the psychic cost of evading taxes; they also constitute a driving force of
behavior (Zeelenberg, 2007). In other words, the emotions associated with income reporting, audit, and sanctions can
influence further compliance. Various emotions might be related with the act of evading taxes and its consequences.
Indeed, moral emotions might signal violations of social norms (Thøgersen, 2006; Zeelenberg, Nelissen, Breugelmans, &
Pieters, 2008; de Hooge et al., 2008). For instance, the evader might feel guilty (Fessler & Haley, 2003; Tangney, 1991)
for not helping needy people in the community, or feel ashamed (Keltner & Buswell, 1996) if caught evading taxes and
publicly denounced (Haidt, 2003; Tangney & Dearing, 2002). The experience of guilt is commonly associated to pro-social
behavior motivated by reparatory acts (Roseman, Wiest, & Swartz, 1994; Tangney, Miller, Flicker, & Barlow, 1996). For its
part, shame may motivate withdrawal and avoidance of social interactions (Tangney et al., 1996). Moreover, underreport-
ing income may generate anticipatory and anticipated emotions (Lowenstein, Hsee, Weber, & Welch, 2001). Indeed, evad-
ers may experience anticipatory emotions when taking the risk of reporting less than requested and these risk-related
anticipatory emotions are likely to increase with the level of tax evasion. Moreover, evaders may experience anticipated
emotions when thinking of how bad they will feel if audited and punished. We expect that the intensity of the emotions
related to the detection of cheating differs according to the publicity of this information, due to shaming. Indeed, shaming
could amplify moral emotions (Izard, 1977; Sabini & Silver, 1997) related to the violations of a norm (e.g., tax evasion),
and affect social behavior (e.g. tax compliance) (Ahmed & Braithwaite, 2004; Amodio, Devine, & Harmon-Jones, 2007;
Murphy & Harris, 2007).
    Two recent studies investigated directly the role of emotions on tax compliance (Coricelli, Joffily, Montmarquette, &
Villeval, 2010, and Maciejovsky, Schwarzenberger, & Kirchler, 2011). Coricelli et al. (2010) measured skin conductance
responses (SCRs) and self reported emotional arousal and valence in a tax evasion experimental task. They found higher
SCR when participants evaded, and higher arousal and negative affects associated with being audited. A treatment in
which the pictures of evaders were publicly displayed few seconds at the end of the period favored compliance. The
decision to evade and the proportion of evaded income were related to the anticipation and the experience of emotional
responses. Maciejovsky et al. (2011) investigated how the interplay between cognition and emotion affects tax ethics.
They found an interaction effect of cognitive and emotional priming to moral judgments related to tax evasion. This
study also shows how the effectiveness of economic variables, such as audit probabilities and the amount of the fines,
is influenced by affect.
    The originality of our experimental protocol consists of manipulating the risk of being publicly exposed for underreport-
ing. Our shaming ‘‘ritual’’ consists of showing the picture of the evader in addition to a monetary sanction (similarly to Cori-
celli et al. (2010)). In the so-called Pardon treatment, shaming was followed by reintegration: after having his picture
displayed, the evader was fully reintegrated in the group (i.e. his picture disappeared from the screens, like in Coricelli

Please cite this article in press as: Coricelli, G., et al. Tax evasion and emotions: An empirical test of re-integrative shaming theory. Journal
of Economic Psychology (2013), http://dx.doi.org/10.1016/j.joep.2012.12.002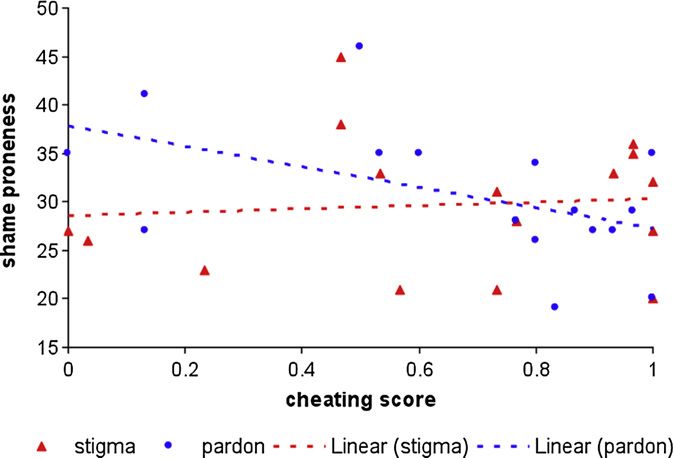
G. Coricelli et al. / Journal of Economic Psychology xxx (2013) xxx–xxx                                          3

et al., 2010).1 In contrast, in the so-called Stigma treatment, shaming was followed by stigmatization, where expiation never
ended. Indeed, the evader’s picture was publicly displayed for the rest of an ‘‘experimental life’’; as a consequence, the individ-
ual was permanently labeled a cheater for an entire sequence. Our laboratory experiment thus complements these previous
studies (Coricelli et al., 2010; and Maciejovsky et al., 2011). Indeed, Coricelli et al. (2010) found that there was a beneficial effect
of showing the picture of evaders but only one type of shaming was introduced; the current study aims to investigate the
dynamics of shaming and to better specify that previous result. Here, we investigate how the duration of public exposure in
case of detection affects the behavior and emotional responses related to tax evasion in a dynamic setting. In addition, in this
paper we introduce psychological measures of moral emotions.
    Reporting behavior should be similar in both treatments as the parameters of the game, such as audit probabilities, tax
rate and income levels, were the same. The reason why behavior was expected to differ between treatments is the prospect
and the experience of stigmatization. Indeed, lower levels of evasion were expected in the Pardon treatment, as a conse-
quence of reintegration in the group after being caught cheating. Higher levels of evasion were expected after the first eva-
sion in the Stigma treatment, since once the feeling of shame has been experienced, compliance would not change the
evader’s status. Such anticipated and experienced emotional consequences should be the main determinants of treatment
effects on decisions and affective self-reports.
    Our main findings show that, indeed, when cheating is made public but the contravener is successively reintegrated, the
total amount of cheating is significantly reduced compared to when cheating is made public and publicity is not immediately
followed by reintegration. The latter condition is associated with more intense negative emotions related to cheating. This
suggests that the employment of a social shaming mechanism may be an effective, albeit very sensitive, tool in the hands of
policy makers.
    The remainder of this paper is organized as follows. Section 2 presents the experimental materials and methods. Section 3
reports the experimental results. Section 4 discusses these results and concludes.

2. Materials and methods

2.1. Participants

    Our experiment was conducted at the Groupe d’Analyse et de Théorie Economique (GATE), CNRS, France. 32 participants
(mean age: 23; SD: 6.6), 16 for each session, were recruited from undergraduate courses in local Engineering and Business
schools, by means of the ORSEE software (Greiner, 2004). The experiment was computerized using the REGATE program (Zei-
liger, 2000).

2.2. Design

    The experiment consists of two treatments: the Sigma treatment and the Pardon treatment (see Fig. 1 and instructions in
Appendix A). The Pardon treatment is characterized as follows. The experimental game involves groups of eight players who
receive individual incomes, which can take one of the following values: I {50, 100, 150, 200}. Each income level is randomly
assigned to two players in each period but this is not common information. Players are requested to pay a uniform tax rate
on their income (55%) and they are asked to report their income. Income is reported by means of a scrollbar, whose maxi-
mum graduation corresponds to the player’s actual income (i.e., players cannot report more than their actual income), and
players are told that paybacks will go into scientific research funds. The scrollbar was implemented to allow comparability
with previous research in which the same method was adopted.
    Subjects know that their reported income can be audited according to a cut-off audit scheme, which will entail the pay-
ment of a fine if the reported income is less than actual income. As in Coricelli et al. (2010), players know that the probability
of an audit is endogenous and it depends on the group median report. If a player’s reported income is among the four highest
reported incomes, his audit probability is 35%. If his reported income is among the four lowest reported incomes, his audit
probability is 65%. If all players report the same amount, the audit probability is uniform and equal to 50%. The reason why
low-reported-income players have higher probability of being audited is because reporting low incomes signals to tax
authorities (who know the income distribution) that the individual might have underreported by a substantial amount.
    This endogenous audit mechanism could have potentially generated coordination among participants. However, coordi-
nation on the equilibrium –even when it is unique- is in general difficult (see, Alm & McKee, 2004), and particularly so in our
experimental setting due to (i) the size of the group (eight participants), (ii) the median income rule that we implemented,
and (iii) the limited feedback information provided at the end of each trial.

   1
     There are other differences with the design used in Coricelli et al. (2010). In particular, here we introduce sequences of various lengths in which players
remain in the same group; at the beginning of each sequence, groups are rematched, so that if somebody was publicly exposed in his previous group, his
‘‘reputation’’ is restored in his new group. Moreover, in this experiment we use a between-subject design. Coricelli et al. (2010) used a within-subject design
and players remained in the same groups for the 30 periods of the game. Therefore, the picture treatment of Coricelli et al. (2010) is relatively close to our
Pardon treatment, except that since players remained in the same group throughout the game they could remember that a detected cheater in a period already
evaded in the past. Our rematching procedure limits this effect.

Please cite this article in press as: Coricelli, G., et al. Tax evasion and emotions: An empirical test of re-integrative shaming theory. Journal
of Economic Psychology (2013), http://dx.doi.org/10.1016/j.joep.2012.12.002
4 G. Coricelli et al. / Journal of Economic Psychology xxx (2013) xxx–xxx
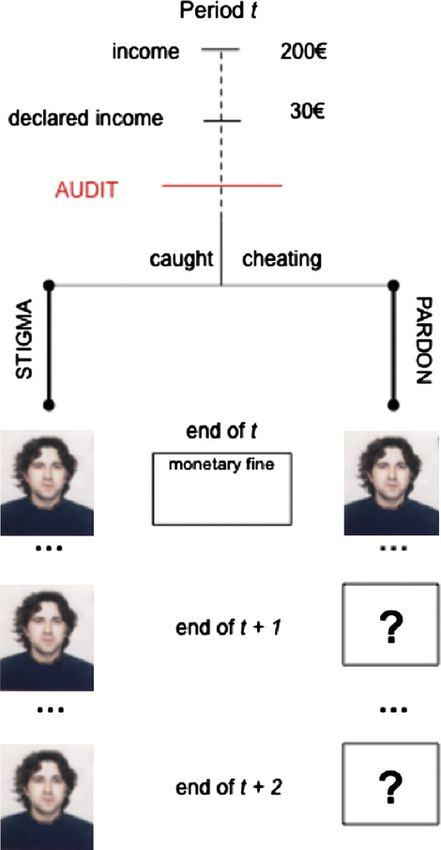
Fig. 1. Sequence of events in t and different consequences of cheating in the two treatments (Stigma vs. Pardon). Note: In the Stigma treatment, if an audit
reveals that a player has underreported his income, his picture is displayed on his own screen and on the screen of other taxpayers for the remainder of the
current sequence of periods. In the same situation in the Pardon treatment, the picture is displayed only in the current period.
Payoffs are determined as follows. If the player is not audited, his payoff consists of his net income (i.e. income minus the
tax on reported income). If the player is audited and he has underreported his income, he has to pay the tax on his actual
income and a fine is charged. As in Yitzhaki’s (1974) deterrence model, the fine is proportional to the unpaid taxes and it
is fixed at 20%. In addition, his picture is displayed on his own screen and on the screen of the other taxpayers for the specific
period in which he has been audited and caught cheating. In each period, only one picture can be displayed on the screen of
any subject; if more than one tax evader was audited, there is a random display of each picture on the screen of non-audited
players and honest taxpayers. Displaying only one picture at a time does not allow the players to identify precisely the num-
ber of evaders in the group. This also means that a player who is caught cheating does not know if there were other cheaters
and how many players can see his picture, but he is certain that his own picture is displayed. The extent of evasion is not
displayed since it could be an additional source of influence on individual decisions.
The Stigma treatment follows the same sequence as the Pardon treatment: players receive their income; they report an
income; and after the audit has been realized, they are informed on whether they have been audited; then, payoffs for the
period are computed. In contrast with the Pardon treatment, the pictures of the contraveners who have been caught are dis-
played on their own screen and on the screen of other taxpayers for the remainder of an entire sequence of periods. As in the
Pardon treatment, at the end of each period only one picture can be displayed on the screen of any subject; if more than one
tax evader has been audited, each picture is still displayed but on fewer screens.
To avoid possible carry-over effects, a between-subject design was used. An experimental session consisted of 30 periods,
divided into three blocks with a variable number of periods (6, 14 and 10 periods, respectively). The number of sequences
and the number of periods in the three blocks were held constant in both treatments and kept unknown. Two groups of eight
participants were formed in each session. At the beginning of each new sequence, the composition of groups was reshuffled,
such that reputation could be restored at the beginning of a new sequence.
Please cite this article in press as: Coricelli, G., et al. Tax evasion and emotions: An empirical test of re-integrative shaming theory. Journal
of Economic Psychology (2013), http://dx.doi.org/10.1016/j.joep.2012.12.002G. Coricelli et al. / Journal of Economic Psychology xxx (2013) xxx–xxx 5
2.3. Procedures
Upon arrival, subjects were asked whether a picture of their face could be taken (all accepted). It was made explicit that
this picture would be used during the experiment and that they could quit immediately against the payment of the show-up
fee (€3). Participants received also the guarantee that their picture would be immediately destroyed at the end of the session
and they could witness its destruction, if they wanted to. They were required to keep a neutral face while their picture was
taken. Next, each participant was allowed to sit in front of a computer. Instructions were distributed and read aloud and
understanding of the rules was checked. In a preliminary part, risk attitudes were probed; however, since they did not influ-
ence behavior in either treatment, these data are not reported.
Risk elicitation was elicited at the beginning of the session, following a procedure similar to Charness and Gneezy (2010).
Each subject received an endowment of 15 points and had to choose how much to invest in a risky asset and how much to
keep for himself. This amount was lost if the investment failed; in case of a success, the investment returned 2.5 times this
amount. It was common knowledge that the investment had a 50% chance to be a success. The subjects received no feedback
on the success or failure of their investment before the end of the session, in order not to influence their further decisions. In
addition, affective self-reports were collected at the end of each period to assess emotional arousal (low–high intensity, on a
Likert-type scale from 0 to 7) and hedonic valence (negative-positive, on a Likert-type scale from 0 to 7). The short version of
TOSCA-3 (Test of Self-Conscious Affect – Version 3; Tangney, Dearing, Wagner, & Gramzow, 2000) was administered at the
end of the sessions. TOSCA-3 yields indices of shame-proneness, guilt-proneness, externalization, and detachment that can
be related to cheating behavior. For each of its 11 scenarios, players had to indicate on a 1-to-5 scale how likely they would
be to react in each of four ways described to them. They were paid an additional €2 to answer these questions. On average,
participants earned €23.44. They were paid in private in a separate room.
2.4. Data analysis
Kruskal–Wallis equality of populations rank tests were performed to identify differences between treatments for each
variable of interest; two-sample Wilcoxon rank-sum tests (Mann–Whitney U-tests) were performed to identify specific
sources of difference; and Kolmogorov–Smirnov tests compared the distributions of decisions in the Pardon and the Stigma
treatments. An additional analysis was conducted considering a comparison between these two treatments described above
and a benchmark treatment with identical audit probabilities and tax rate but without the picture manipulation (data from
Coricelli et al., 2010).
Next, we estimated a random-effects Probit model to analyze the determinants of the probability to cheat. The use of ran-
dom effects is justified since the same players made repeated decisions in 30 periods. In Model (1) in Table 1, the dependent
binary variable is the decision to under-report income. The independent variable Stigma treatment takes value 1 if the data
are from the Stigma treatment and 0 if the data are from the Pardon treatment. We interacted this treatment variable with
the time taken by the subject to make his decision (Stigma decision time). The picture in t–1 variable is coded 1 if the player’s
picture has been displayed in the previous period and 0 otherwise. The stigma picture in t–1 variable interacts the previous
variable with the Stigma treatment to check whether the impact of picture dissemination differs in this treatment. Income
indicates the actual level of income. The independent variables also include a period variable that takes the value of each trial
number; this variable is also interacted with the Stigma treatment to test whether the time trend differs across treatments
(stigma period). Since we have included lagged variables, the first period of each sequence is dropped. The independent
variables also include the player’s gender (male) and four individual indices from the TOSCA-3: shame proneness, guilt-prone-
ness, detachment and externalization. In Table 1, we report the marginal effects of each of these independent variables.
We also estimated a random-effects Tobit model. In this model, the independent variable is the intensity of cheating, gi-
ven by the proportion of evaded income [(income – declared income)/income]. The Tobit model is justified because data are
censored at zero (full compliance). The parameters were estimated by maximum likelihood. Model (2) was estimated on the
subsample of players who evaded in the previous period and have been caught. Model (3) was estimated on the subsample of
players who evaded in the previous period but who have not been caught. The independent variables are the same as in
model (1), except that the picture variables have been excluded.2 Table 1 reports the value of the coefficients of these inde-
pendent variables.
Moreover, we estimated alternative Probit and Tobit models in which, instead of using random effects, we clusterized
robust standard errors at the individual level. Results were qualitatively similar to those reported in Table 1.
3. Results
Compared to the Stigma treatment, an environment where cheating is made public and publicity immediately followed
by reintegration (Pardon treatment) reduces evasion. The average proportion evaded is 40.32% in the Stigma treatment and
2
We also tested specifications in which the independent variables also included the amount invested in the risky investment at the beginning of the game,
the intensity of feelings and the hedonic valence of feelings self-reported in the previous period. Since none of these variables was ever significant, we do not
report these specifications.
Please cite this article in press as: Coricelli, G., et al. Tax evasion and emotions: An empirical test of re-integrative shaming theory. Journal
of Economic Psychology (2013), http://dx.doi.org/10.1016/j.joep.2012.12.0026 G. Coricelli et al. / Journal of Economic Psychology xxx (2013) xxx–xxx
Table 1
Determinants of the probability of evading taxes and of the intensity of evasion.
Dependent variables Probability of evading (1) Intensity of evasion in t when an evader in t-1 has been
Caught (2) Not caught (3)
Stigma 2.434*** 29.304** 1.018
(0.676) (13.863) (11.609)
Picture in t 1 0.494** – –
(0.227)
Stigma picture in t 1 1.229*** – –
(0.334)
Stigma decision time 0.071*** 1.453*** 0.014
(0.021) (0.565) (0.479)
Period 0.020** 0.340 0.514**
(0.010) (0.290) (0.242)
Stigma period 0.036** 0.292 0.101
(0.016) (0.419) (0.362)
Income 0.013*** 0.199*** 0.119***
(0.001) (0.032) (0.028)
Male 1.758** 10.430 14.564
(0.744) (11.612) (9.904)
Shame proneness 0.054 1.384* 1.473**
(0.048) (0.820) (0.716)
Guilt proneness 0.003 0.368 0.093
(0.062) (1.018) (0.873)
Detachment 0.092 1.901# 0.921
(0.062) (1.202) (1.036)
Externalization 0.061 0.309 0.648
(0.059) (0.978) (0.860)
Constant – 14.065 21.190
(63.029) (54.278)
Nb observations 864 292 277
Censored observations – 50 43
Log likelihood 285.025 1228.635 1137.248
Wald Chi2 119.70 58.97 38.79
p > Chi2G. Coricelli et al. / Journal of Economic Psychology xxx (2013) xxx–xxx 7
Fig. 2. Evolution of the mean percentage of evaded income by treatment over time.
Fig. 3. Correlation between scores on the TOSCA-3 shame proneness scale and the proportion of periods with evasion for each player.
Finally, emotional responses experienced in the Stigma treatment tend to become more intense than those experienced in
the Pardon treatment over time, despite initially similar levels between the two groups (Kolmogorov–Smirnov test for equal-
ity of distribution functions: D = 0.5333, p < 0.001). The average self-reported intensity of emotions is 3.96 in the Stigma
treatment and 3.55 in the Pardon treatment; for the sole evaders, the corresponding values are 4.48 and 4.06. Overall, feel-
ings are more intense in evaders (M–W, z = 12.781, p < 0.001). Evaders who were not caught in the current period (or be-
fore the Stigma), that is evaders who did not see their own picture on the screen, reported more positive feelings than those
who complied (non-caught evaders: 5.18 vs. honest: 4.11; M–W, z = 3.492, p < 0.001; evaluated on a scale where 1 is very
negative, 4 neutral, and 7 very positive). As expected, evaders who did see their own picture reported more negative feelings
(on average, a score of 3.40) than those who did not evade (4.11) or did not see their picture (5.18) (caught evaders vs. non-
evaders: M–W, z = 6.340, p < 0.0001; caught evaders vs. non-caught evaders: M–W, z = 2.334, p = 0.020).
Interesting interactions emerged between treatments and dispositions measured with TOSCA-3.4 Fig. 3 shows the signif-
icant interaction between treatments and shame-proneness on cheating behavior. Shame-proneness is related to law-abiding
behavior in the Pardon treatment (Spearman’s rank correlation coefficient, rho = 0.57, p = 0.020, which is consistent with
the idea that the Pardon treatment deters via induction of anticipated shame. On the contrary, shame-proneness is unrelated
to cheating behavior in the Stigma treatment (rho = 0.02, p = 0.940).
Finally, Mann–Whitney tests on the proportion of unreported income provide evidence that the two treatments elicit dif-
ferent reactions in those evaders who were caught in a preceding period. The average proportion of unreported income of the
subjects who were caught in the previous period, excluding the first period of each sequence, is 55.45% in the Stigma treat-
ment and 46.38% in the Pardon treatment (M–W = 2.890, p < 0.001).
4
The TOSCA-3 measures were collected at the end of the experimental sessions, to avoid priming participants on shame/guilt scenarios. Being dispositional
measures, TOSCA-3 scores should not be hugely affected by the preceding experience with the experimental game; however, we acknowledge that possible
carry-over effects cannot be discarded.
Please cite this article in press as: Coricelli, G., et al. Tax evasion and emotions: An empirical test of re-integrative shaming theory. Journal
of Economic Psychology (2013), http://dx.doi.org/10.1016/j.joep.2012.12.0028 G. Coricelli et al. / Journal of Economic Psychology xxx (2013) xxx–xxx
To complement these non-parametric statistics, we turn now to the econometric analysis. The regression analysis
reported in model (1) in Table 1 investigates the determinants of the probability to evade taxes. It shows that players
are initially less likely to evade in the Stigma treatment, possibly because they anticipate negative emotions related
with stigmatization. But if the display of their picture after an audit in the previous period reduces the players’
likelihood of evading taxes in the Pardon treatment, we observe the opposite effect in the Stigma treatment. This
may indicate that there is no repetition avoidance in this treatment possibly because reputation has been lost for
the rest of the sequence. In addition, in the Stigma treatment a higher time to make a decision is associated with
an increased probability to evade taxes, possibly because detection entails a higher anticipated moral cost in this treat-
ment. The regression also indicates that a higher income increases the probability to cheat and that males are more
prone to take the risk of evading taxes (like in Fallan, 1999; Kirchler, 2007; Spicer & Becker, 1980). Finally, those who
are more prone to shame or other feelings do not seem more likely to underreport their income. In fact, additional
regressions show that shame-proneness influences significantly evasion in the Pardon treatment but not in the Stigma
treatment.5
Turning to the intensity of evasion, model (2) in Table 1 shows that when evaders in the previous period have been
caught, the Stigma treatment produces a larger proportion of unreported income in the current period than the Pardon treat-
ment. This effect is less strong, however, for those who take more time to make their decision in the current period, possibly
because they are more hesitant. Shame-proneness reduces significantly the proportion of unreported income in the current
period, whereas a higher income increases it. Consistent with the previous analysis, additional regressions show that the im-
pact of shame-proneness is significant only for the evaders in the Pardon treatment, but not for the evaders in the Stigma
treatment.6 This suggests that when the moral sanction is lasting for the whole sequence, shame-proneness is no longer able
to discipline individuals.
On the other hand, for evaders who were not caught in the previous period (see model (3) in Table 1), the treatment has
no effect on the proportion of evaded income. Shame-proneness still has a negative influence. Separate regressions by treat-
ment show that this variable is only significant in the Pardon treatment (coeff. = 2.551, p = 0.005), not in the Stigma treat-
ment (coeff. = 0.716, p = 0.490).
4. Discussion and conclusion
Tax compliance may be guided by the willingness to avoid negative emotions raised by potential detection and public
denouncement, as shown before by Coricelli et al. (2010) and by our analysis of self-reports on the intensity and hedonic
valence of feelings. This suggests that there is a disutility in being labeled as a cheater in a group, although the maximization
of one’s monetary payoff may rationally motivate tax evasion and although participants can learn over time that there are
other evaders in the group. In this experiment, we showed, however, that if an evader is not reintegrated in the group after
being identified as a cheater and punished as such, he is more likely to switch to the deviant/utilitarian mode and evades
significantly more than when immediately reintegrated after being fined. This might indicate that when an individual is
not given the opportunity to restore his reputation, he slips out of the net of emotional social control. In agreement with
Braithwaite’s theory, our results point against a simplistic application of shaming in a public policy aimed at reducing tax
evasion, and suggest that shaming might even exert negative effects by desensitizing evaders and pushing them even further
into rule breaking (see also Murphy & Harris, 2007) or even by causing resentment feelings that may lead to actively chal-
lenging and game-playing with the law (Murphy, 2008).
The relationship between punishment and compliance also appears to be mediated by some personality traits. Indeed,
for a given level of income, a higher shame-proneness score (as measured by TOSCA-3) reduces the likelihood of cheat-
ing and the extent of underreporting. Indeed, shame is a negative emotion attacking the entire self; it has the capacity to
make us feel ‘naked, defeated, alienated, lacking in dignity or worth’ (e.g. Tomkins, 1963). In the context of a shaming
policy, the interaction between social situational forces and personal forces may therefore exert unpredictably negative
effects both for the internal experience of the person being shamed and for its behavioral outcome (Gadd & Jefferson,
2007).
There is wide consensus in the literature on the fact that shame differs from guilt (de Hooge, Zeelenberg, &
Breugelmans, 2007). Guilt is a negative emotion restricted to the specific behavior that has been enacted by the self.
That is, guilt is free from potentially destructive thinking against the self. That shame-proneness had a part in our par-
ticipants’ reaction during the tax game is shown by the interaction between shame-proneness and the type of decision
taken during each period; in contrast, guilt-proneness did not affect behavior. Interestingly, we found that shame-
proneness favors compliance but this is significant only in the Pardon treatment. When the detected cheating behavior
5
We also estimated model (1) for each treatment separately (regressions available upon request). Each point of shame-proneness score reduces by 17.96%
the probability of cheating (p = 0.078) in the Pardon treatment. Its impact is not significant in the Stigma treatment (p = 0.922). Note that the mean shame-
proneness score is 30.81 in the Pardon treatment (SD = 6.87; min = 19; max = 46) and 29.75 (SD = 6.72; min = 20; max = 45) in the Stigma treatment. The mean
shame-proneness is not significantly different in the two samples (M–W test, p = 0.663). Thus, the difference observed does not originate in different individual
characteristics of the two samples.
6
We estimated model (2) for each treatment separately (regressions available upon request). The coefficient of the shame-proneness score is -2.938
(p = 0.021) in the Pardon treatment. It is 0.316 (p = 0.743) in the Stigma treatment.
Please cite this article in press as: Coricelli, G., et al. Tax evasion and emotions: An empirical test of re-integrative shaming theory. Journal
of Economic Psychology (2013), http://dx.doi.org/10.1016/j.joep.2012.12.002G. Coricelli et al. / Journal of Economic Psychology xxx (2013) xxx–xxx 9
leads to stigmatization in the group, shame-proneness is no longer able to refrain individuals from evading taxes or to
limit the amount evaded. It can be inferred that even subtle variations in policy (and therefore in the social context)
can interact with individual variables. Gadd and Jefferson (2007) note that ‘one person’s mild embarrassment is an-
other painful mortification’ and highlight the danger of policies entailing the manipulation of social emotions.
Braithwaite himself wrote that ‘shaming is a dangerous game’ (1989). Our study shows that even in a laboratory
environment it is possible to alter participants’ behavior just by applying two slightly different policies based on
the concept of shaming the offender. When shaming turns into stigmatization, compliance is lower than when shaming
is followed by reintegration. In conclusion, shaming via public exposure may increase compliance only when carefully
administered.
Acknowledgments
This work was supported by a CIMeC Research Fellowship to ER, a grant from the CIBLE program of the Rhone-Alpes Re-
gion to Marie Claire Villeval, and ANR and PAT (Provincia Autonoma di Trento) grant to GC. We would like to thank Stephen
Parrott, Carol Wain and Michael Wright for stimulating discussions and for their constructive comments on a preliminary
version of this manuscript.
Appendix A. Instructions for the Stigma treatment (translated from French)
(Instructions for the Pardon treatment are available upon request)
We thank you for participating in this experiment on decision-making that consists of several parts. During these parts,
all transactions are expressed in points, with
100 points = 20 Euro
We will first distribute the rules for the preliminary part; the instructions for the next parts will be distributed later
Your earnings depend on your decisions and on the decisions of other participants. At the end of the session, we will add
up your earnings in points in the various parts and they will be converted into Euros
The amount of your earnings will remain confidential. You will be paid in private and in cash in a separate room by a
person who is not aware of the content of the experiment
Instructions for the preliminary part
Description of the task
You receive a show-up fee of €3, equivalent to 15 points. We ask you to choose the amount of points (between 0 and 15
points, included) that you are willing to invest on a risky asset. You keep the points that are not invested
The investment
There is a 50% chance that the investment is a success
If the investment is a success, you earn 2.5 times the amount that you have invested
If the investment is not a success, you lose the amount that you have invested
1st example: You invest 0 point. You earn: (15 0) = 15 points
2nd example: You invest 6 points. If the investment is a success, you earn: (15 6) + (2.5 6) = 24 points. If the
investment is not a success, you earn: (15 6) + 0 = 9 points
3rd example: You invest 15 points. I f the investment is a success, you earn: (15 15) + (2.5 15) = 37 points. If the
investment is not a success, you earn: (15 15) + 0 = 0
How is the success of the investment determined?
You are required to choose one color, either white or black. At the end of the session, you will have to press a button
‘‘random draw’’ that will appear on your computer screen. The computer program selects randomly one of the two
colors
If the randomly drawn color is the color you have chosen, your investment is a success
If the randomly drawn color is not the color you have chosen, your investment is not a success
To sum up: You choose now the amount you are willing to invest; then, you choose a color. At the end of the session,
after the other parts have been completed, you will press the random draw button. The computer program will
inform you whether the investment is a success and the amount of your earnings for this part. This earning will be
added to your earnings of the previous parts
If you have any question regarding these instructions, please raise your hand. Somebody will answer your questions in
private. You are not allowed to communicate with the other subjects throughout the session
Please cite this article in press as: Coricelli, G., et al. Tax evasion and emotions: An empirical test of re-integrative shaming theory. Journal
of Economic Psychology (2013), http://dx.doi.org/10.1016/j.joep.2012.12.00210 G. Coricelli et al. / Journal of Economic Psychology xxx (2013) xxx–xxx
Instructions for the following parts (Distributed after the preliminary stage has been completed)
Part 1
This part consists of several ‘‘sequences’’
During each sequence, you and seven other participants are randomly allocated to a group. The composition of the
group is modified at the beginning of each new sequence
Each ‘‘sequence’’ consists of several ‘‘periods’’. At the end of the session, we will randomly draw two periods in this part.
We will calculate the average of your earnings in these two periods and these earnings will be added to the earnings
of the other parts
Description of each period
In each period, you have to make one decision
h At the beginning of each period, you receive an income. Your income can take the value 50, 100, 150, or 200 points.
Your income is selected among these values by the computer program
h We ask you to pay a tax on your income. This tax rate is 55%. It is the same for all the participants in this session. The
product of the taxes will be used to fund participants to other experiments
To answer this demand, you must report an amount that lies between 0 and the income you have received. The 55% tax
rate is applied to the amount you have decided to report. After you have made your choice, you must click the OK
button on your screen to validate your decision
h The computer program can control your reported income according to a certain audit probability and this audit can
entail the payment of a fine.
Your probability of being audited is determined as follows:
If your reported income is among the 4 lowest reported incomes in the room in the current period, the audit
probability is 65%. Therefore, you have 65 chances out of 100 to have your report audited
If your reported income is among the 4 highest reported incomes in the room in the current period, the audit
probability is 35%. Therefore, you have 35 chances out of 100 to have your report audited
If all the participants report the same income, an average audit probability, equal to 50%, is applied to each participant
If an audit is conducted and if it reveals that you have reported an amount lower than your actual income, you have to
pay both:
(1) the tax on your actual income, i.e. 55% of your actual income
(2) and a fine, which is determined as explained below
Determination of your payoff in each period
At the end of each period, your net payoff is determined as follows. 3 cases may occur
h If your reported income is not audited, the tax rate is applied to the amount you have reported. Your net payoff is
determined according to the following formula:
h If your reported income is audited and if it is equal to your actual income, the tax rate is also applied to your
reported income. Your net payoff is determined according to the following formula:
h If your reported income is audited and if it is lower than your actual income, the tax rate is applied to your actual
income. One subtracts from your payoff a fine that is equal to 20% of the tax on the income that you did not report.
Your net payoff is determined according to the following formula:
Note that the computer program rounds up the decimals when appropriate.
Moreover, if your reported amount is audited and it is lower than your income, your picture will be displayed on the
screen of other participants in your group and on your own screen. Your picture is displayed during the current
period and until the end of the current sequence. It is displayed until the end of the sequence, whether you will be
audited or not in the following periods
Please cite this article in press as: Coricelli, G., et al. Tax evasion and emotions: An empirical test of re-integrative shaming theory. Journal
of Economic Psychology (2013), http://dx.doi.org/10.1016/j.joep.2012.12.002G. Coricelli et al. / Journal of Economic Psychology xxx (2013) xxx–xxx 11
Instructions for the Stigma treatment (translated from French) (continued)
Determination of your payoff in each period
Similarly, you can receive the picture of another group member who has been audited and who under-reported his
income, except if you have been yourself audited and fined during the current period or during the previous periods
of the same sequence. Indeed, at most a single picture is displayed on each participant’s screen. This does not mean
that only one participant has been audited and fined. But if you have been audited and fined, you are certain that your
picture is displayed in the room until the end of the current sequence. If no picture is displayed on your screen, it is
either because nobody has been audited, or because nobody has under-reported his income. If during one period or
one sequence several group members have been audited and fined, the computer program assigns their pictures to
other group members
At the end of each period, you are informed on the following elements:
– whether your report has been audited or not
– the total amount of your tax (including the fine if appropriate)
– your net payoff
You are not informed on the incomes, the reported amounts, and the payoffs of the other participants
Next, we ask you to express your sentiments regarding your audit during the current period. We first ask you to report
the intensity of your sentiments when you have been informed on whether you were audited or not, by means of a
scale graded from 1 (extremely weak sentiment) to 7 (extremely strong sentiment). Then, you will be requested to
report the nature of these sentiments, by means of a scale graded from 1 (extremely negative sentiment) to 7
(extremely positive sentiment)
Your answers to these questions are not paid. They have no influence on the rest of the session; in particular, they
influence neither the determination of your income in the next period, nor your audit probability. We thank you for
however paying attention to these questions and to answer them sincerely
Number of periods in one sequence
At the end of each period, a new period can start automatically. You receive a new income at random and you make a
new report. Each period is independent on the previous ones
The number of periods that compose one sequence varies across sequences and does not exceed 20. This number is
determined in advance and does not depend on your decisions
What does change across sequences?
The same rules apply in the following sequences
The only difference is that at the beginning of any new sequence, the composition of your group of 8 members is
randomly modified. During a new sequence, you interact with different participants. Some of them could belong to
your group in the previous sequence and others did not
In addition, at the beginning of a new sequence, the pictures that were displayed until the end of the previous sequence
are no longer displayed, except if these members are audited and they under-reported their income again
You are not informed on the total number of sequences in this part. This number does not depend on your decisions
To sum up:
– The part consists of several sequences and each sequence consists of several periods. During a sequence, you interact
with the same seven participants
– In each period, you receive an income
– You choose the amount that you are willing to report
– If you are audited and you have under-reported your income, you must pay a tax on your actual income and a fine. In
addition, your picture is disseminated in your group and on your screen during the current period and during all
periods until the end of the current sequence
– You answer the questions regarding your sentiments
– You are informed on whether a new period or a new sequence starts
––––
We invite you to read these instructions again with attention and to answer the questionnaire that has been distributed
to train yourself with the determination of payoffs. If you have questions regarding these instructions, please raise
your hand. We will answer your questions in private
Please cite this article in press as: Coricelli, G., et al. Tax evasion and emotions: An empirical test of re-integrative shaming theory. Journal
of Economic Psychology (2013), http://dx.doi.org/10.1016/j.joep.2012.12.00212 G. Coricelli et al. / Journal of Economic Psychology xxx (2013) xxx–xxx
Part 2 (distributed after completion of Part 1)
You will be presented on your screen with several situations that people are likely to encounter in day-to-day life,
followed by several common reactions to those situations
As you read each scenario, try to imagine yourself in that situation. Then indicate how likely you would be to react in
each of the ways described by clicking a value from 1 (not likely) to 5 (very likely)
For example,
1. You wake up early one Saturday morning. It is cold and rainy outside.
(a) You would telephone a friend to catch up on news 1 2 3 4 5
Not likely Very likely
(b) You would take the extra time to read the paper 1 2 3 4 5
Not likely Very likely
(c) You would feel disappointed that it’s raining 1 2 3 4 5
Not likely Very likely
(d) You would wonder why you woke up so early 1 2 3 4 5
Not likely Very likely
You will receive 2 Euros for answering these questions
Next, other questions will follow. Your answers are anonymous
End of the session
At the end of the session, we will randomly draw two periods in part 1 to determine your payoffs. Then, you will
randomly draw the color that will determine your earnings for the preliminary part. You will next leave the room to
get paid
References
Ahmed, E., & Braithwaite, V. (2004). When tax collectors become collectors for child support and student loans: Jeopardizing or protecting the revenue
base? Kyklos, 3, 303–326.
Allingham, M., & Sandmo, A. (1972). Income tax evasion: A theoretical analysis. Journal of Public Economics, 1, 323–338.
Alm, J. (1991). A perspective on the experimental analysis of taxpayer reporting. The Accounting Review, 66(3), 577–593.
Alm, J., & McKee, M. (2004). Tax compliance as a coordination game. Journal of Economic Behavior and Organization, 54(3), 297–312.
Alm, J., McClelland, G. H., & Schulze, W. D. (1992). Why do people pay taxes? Journal of Public Economics, 48, 21–48.
Amodio, D. M., Devine, P. G., & Harmon-Jones, E. (2007). A dynamic model of guilt: Implications for motivation and self-regulation in the context of
prejudice. Psychological Science, 18, 524–530.
Andreoni, J., Erard, B., & Feinstein, J. (1998). Tax compliance. Journal of Economic Literature, 36, 818–860.
Bayer, R. C., & Sutter, M. (2009). The excess burden of tax evasion – An experimental detection-concealment contest. European Economic Review, 53,
527–543.
Blumenthal, M., Christian, C., & Slemrod, J. (2001). Do normative appeals affect tax compliance? Evidence from a controlled experiment in Minnesota.
National Tax Journal, 54(1), 125–138.
Bosco, L., & Mittone, L. (1997). Tax evasion and moral constraints: Some experimental evidence. Kyklos, 50, 297–324.
Becker, H. (1963). Outsiders: Studies in the sociology of deviance. New York: The Free Press.
Braithwaite, J. (1989). Crime, shame and reintegration. New York: Cambridge University Press.
Charness, G., & Gneezy, U. (2010). Portfolio choice and risk attitudes: An experiment. Economic Inquiry, 48(1), 133–146.
Coricelli, G., Joffily, M., Montmarquette, C., & Villeval, M. C. (2010). Cheating, emotions, and rationality: An experiment on tax evasion. Journal of
Experimental Economics, 13, 226–247.
Cowell, F. (1990). Cheating the government: The economics of evasion. Cambridge, MA: MIT Press.
Cummings, R. G., Martinez-Vazquez, J., McKee, M., & Torgler, B. (2009). Tax morale affects tax compliance: Evidence from surveys and artefactual field
experiments. Journal of Economic Behavior and Organization, 70(3), 447–457.
Elffers, H. (1991). Income tax evasion: Theory and measurement. Deventer: Kluwer Academic Publishers.
Fallan, L. (1999). Gender, exposure to tax knowledge, and attitude towards taxation: An experimental approach. Journal of Business Ethics, 18, 173–184.
Fortin, B., Lacroix, G., & Villeval, M. C. (2007). Tax evasion and social interactions. Journal of Public Economics, 91, 2089–2112.
Fessler, D. M. T., & Haley, K. J. (2003). The strategy of affect: Emotions in human cooperation. In P. Hammerstein (Ed.), The genetic and cultural evolution of
cooperation (pp. 7–36). Cambridge, MA: MIT Press.
Gadd, D., & Jefferson, T. (2007). Psychosocial criminology. London: Sage.
Greiner, B. (2004). An Online Recruitment System for Economic Experiments. In K. Kremer, V. Macho (Eds.), Forschung und wissenschaftliches Rechnen 2003.
GWDG Bericht 63, Göttingen: Ges. für Wiss. Datenverarbeitung. pp. 79–93.
Haidt, J. (2003). The moral emotions. In R. J. Davidson, K. R. Scherer, & H. H. Goldsmith (Eds.), Handbook of affective sciences (pp. 852–870). Oxford: Oxford
University Press.
de Hooge, I. E., Breugelmans, S. M., & Zeelenberg, M. (2008). Not so ugly after all: When shame acts as commitment device. Journal of Personality and Social
Psychology, 95(4), 933–943.
de Hooge, I. E., Zeelenberg, M., & Breugelmans, S. M. (2007). Moral sentiments and cooperation: Differential effects of guilt and shame. Cognition and
Emotion, 21(5), 1025–1042.
Izard, C. E. (1977). Human emotions. New York: Plenum Press.
Keltner, D., & Buswell, B. N. (1996). Evidence for the distinctness of embarrassment, shame and guilt: A study of recalled antecedents and facial expressions
of emotion. Cognition and Emotion, 10, 155–171.
Kirchler, E. (2007). The economic psychology of tax behaviour. Cambridge: Cambridge University Press.
Lefebvre, M., Pestieau, P., Riedl, A., Villeval, M.C. (2011). Tax Evasion, Welfare Fraud, and ‘‘The Broken Windows’’ Effect: An Experiment in Belgium, France and
the Netherlands. IZA Discussion Paper 5609, Bonn.
Lemert, E. M. (2002). Primary and secondary deviance. In H. N. Pontell (Ed.), Social deviance: Readings in theory and research. Upper Saddle River: Pearson,
Prentice Hall.
Lewis, M. (1971). Shame and guilt in neurosis. New York: International Universities Press.
Lewis, M. (1992). Shame. The exposed self. New York: Free Press.
Please cite this article in press as: Coricelli, G., et al. Tax evasion and emotions: An empirical test of re-integrative shaming theory. Journal
of Economic Psychology (2013), http://dx.doi.org/10.1016/j.joep.2012.12.002G. Coricelli et al. / Journal of Economic Psychology xxx (2013) xxx–xxx 13
Lowenstein, G. F., Hsee, C. K., Weber, E. U., & Welch, N. (2001). Risk as feelings. Psychological Bulletin, 127, 267–286.
Maciejovsky, B., Schwarzenberger, H., & Kirchler, E. (2011). Rationality vs. emotions: The case of tax ethics and compliance. Journal of Business Ethics, 109,
339–350.
Murphy, K. (2008). Enforcing tax compliance: To punish or to persuade? Economic Analysis and Policy, 38, 113–135.
Murphy, K., & Harris, N. (2007). Shaming, shame and recidivism. A test of reintegrative shaming theory in the white-collar crime context. British Journal of
Criminology, 47, 900–917.
Myles, G. D., & Naylor, R. A. (1996). A model of tax evasion with group conformity and social customs. European Journal of Political Economy, 12(1), 49–66.
Pommerehne, W. W., Hart, A., & Frey, B. S. (1994). Tax morale, tax evasion and he choice of policy instruments in different political systems. Public Finance,
49, 52–69.
Roseman, I. J., Wiest, C., & Swartz, T. S. (1994). Phenomenology, behaviors, and goals differentiate discrete emotions. Journal of Personality and Social
Psychology, 67, 206–221.
Sabini, J., & Silver, M. (1997). In defense of shame: Shame in the context of guilt and embarrassment. Journal for the Theory of Social Behaviour, 27, 1–15.
Schwartz, R., & Orleans, S. (1967). On legal sanctions. University of Chicago Law Review, 34, 282–300.
Slemrod, J. (1998). On voluntary compliance, voluntary taxes, and social capital. National Tax Journal, LI, 485–492.
Slemrod, J. (2007). Cheating ourselves: The economics of tax evasion. Journal of Economic Perspectives, 21(1), 25–48.
Spicer, M. W., & Becker, L. A. (1980). Fiscal inequity and tax evasion: An experimental approach. National Tax Journal, 33, 171–175.
Tangney, J. P. (1991). Moral affect: The good, the bad, and the ugly. Journal of Personality and Social Psychology, 61, 598–607.
Tangney, J. P., & Dearing, R. L. (2002). Shame and guilt. New York: The Guilford Press.
Tangney, J. P., Dearing, R. L., Wagner, P. E., & Gramzow, R. (2000). The test of self-conscious affect-3 (TOSCA-3). Fairfax, VA: George Mason University.
Tangney, J. P., Miller, R. S., Flicker, L., & Barlow, D. H. (1996). Are shame, guilt and embarrassment distinct emotions? Journal of Personality and Social
Psychology, 70, 1256–1269.
Thøgersen, J. (2006). Norms for environmentally responsible behaviour: An extended taxonomy. Journal of Environmental Psychology, 26(4), 247–261.
Tomkins, S. (1962). Affect/imagery/consciousness (Vol. 1). New York: Springer.
Tomkins, S. (1963). Affect/imagery/consciousness (Vol. 2). New York: Springer.
Torgler, B. (2002). Speaking to theorists and searching for facts: Tax morale and tax compliance in experiments. Journal of Economic Surveys, 16(5), 657–683.
Yitzhaki, S. (1974). A note on income tax evasion: A theoretical analysis. Journal of Public Economics, 3(2), 201–202.
Zeelenberg, M. (2007). Emotional consequences of alternatives to reality: Feeling is for doing. Behavioral and Brain Sciences, 30(4), 469–470.
Zeelenberg, M., Nelissen, R. M. A., Breugelmans, S. M., & Pieters, R. (2008). On emotion specificity in decision making: Why feeling is for doing. Judgment and
Decision Making, 3(1), 18–27.
Zeiliger, R. (2000). A presentation of Regate, Internet based software for experimental economics. http://www.gate.cnrs.fr/~zeiliger/regate/RegateIntro.ppt,
GATE. Lyon: GATE.
Please cite this article in press as: Coricelli, G., et al. Tax evasion and emotions: An empirical test of re-integrative shaming theory. Journal
of Economic Psychology (2013), http://dx.doi.org/10.1016/j.joep.2012.12.002You can also read