Taxes paid: Our
economic contribution
2018
←
→
Page content transcription
If your browser does not render page correctly, please read the page content below

Taxes paid: Our economic contribution 2018
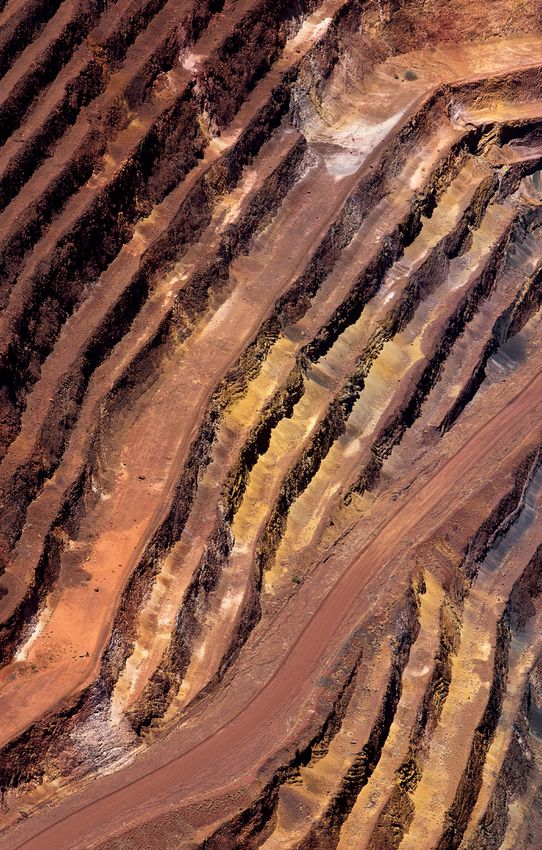
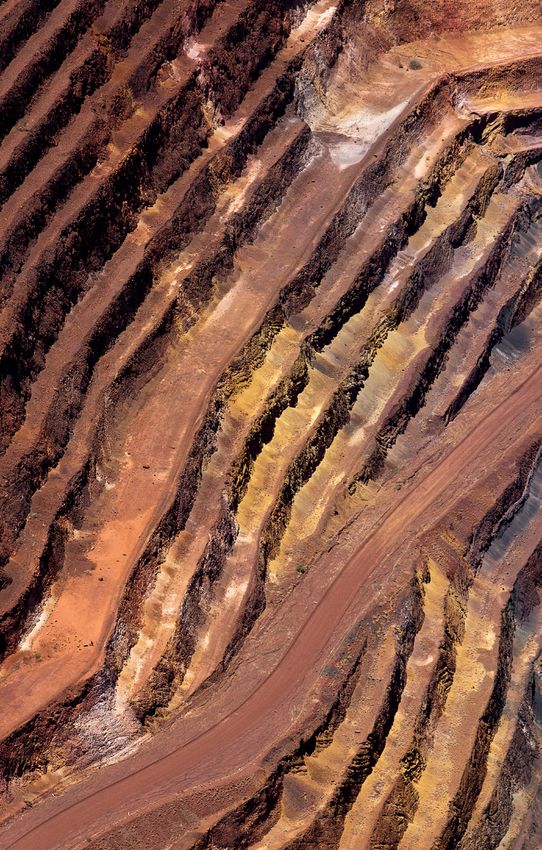
The taxes we pay help
governments provide
essential services to
communities and invest
for the future

Contents
1      Foreword from our chief financial officer
2      Global overview
4      Our direct economic contribution
5      Australia
7      Canada
8      Mongolia
9      United States
10     Europe
11     Africa
12     Latin America
13     Analysis by country and level of government
16     Project-by-project analysis
17     Reconciliation of corporate income tax and royalties
18     Payments to governments and the mining life cycle
19     Pursuing a sustainable tax strategy
20     Our approach to tax
26     Independent auditors’ report
28     Appendix 1: Glossary of terms
29     Appendix 2: Basis of preparation

Cover image: Perth, Australia                                 Image: Concentrate, Oyu Tolgoi, Mongolia
FOREWORD FROM OUR CHIEF FINANCIAL OFFICER

Proud of our contribution
and the positive, lasting
difference we make
We are proud of the products we deliver to                 We believe tax transparency promotes                       We are convinced that creating a
our customers – metals and minerals that                   trust and credibility – not just in                        consistent standard by which companies
are essential to human progress. In 2018,                  companies, but also in the tax regimes in                  can report their contributions with integrity
we refreshed our sustainability strategy,                  which we operate. At the same time, it                     and responsibility is essential to promoting
developing an integrated approach linked                   helps governments make policy decisions                    confidence in business. In 2018, we were
to the United Nations’ Sustainable                         to support stable and effective tax                        proud to add our endorsement to the B
Development Goals. This approach                           systems. Our 2018 transparency                             Team Responsible Tax Principles1, which
ensures that material sustainability issues                statement seeks to translate this belief                   define what leadership in responsible tax
are integrated into our business strategy.                 into action: we will disclose contracts with               looks like. We also support the initiative by
The taxes and royalties we pay to national,                governments in relation to minerals                        the Global Sustainability Standards Board
regional and local governments are an                      development where they are not subject to                  of the Global Reporting Initiative in
important part of this approach, and of our                a confidentiality undertaking, and                         formulating a Tax & Payments to
contribution, enabling governments to                      encourage governments to allow such                        Governments standard, and we are
provide essential services to communities                  disclosure. We commit to continue to                       committed to implementing the standard
and to invest for the future.                              disclose taxes and royalties paid, and other               when it is finalised.
                                                           payments to governments. We also
In 2018, the Rio Tinto Group paid $6.6                     support the disclosure of beneficial                       This report builds on our long history of
billion in taxes and royalties globally,                   ownership and will strive to provide                       transparency in relation to our economic
including $4.8 billion paid in Australia.                  information that includes our joint venture                contribution, and provides comprehensive
Since our first Taxes paid report in 2010,                 relationships, in line with the Extractive                 disclosures over the tax and other
we have paid $63 billion in taxes and                      Industries Transparency Initiative (EITI)                  payments we make to governments.
royalties globally, of which over 70%, or                  and expectations.
$46 billion, was paid in Australia.                                                                                   We welcome your feedback.
                                                           We also commit to continuing to engage
                                                           with communities, governments, civil                       Jakob Stausholm
                                                           society and investors to ensure that our                   Chief financial officer
                                                           economic contribution benefits intended                    April 2019
                                                           localities and populations.

 Taxes and                                    Corporate tax                               Direct economic                             Economic
 royalties paid in                            paid in 2018                                contribution in                             contribution since
 2018                                                                                     2018                                        2014
                                                                                                                                      to the countries
 $6.6bn                                       $3.8bn                                      $42.8bn                                     and communities
                                                                                                                                      where we operate
 Amount invested to strengthen health,
 education, cultural heritage and
                                                                                          37,000                                      $200bn
 environment in 2018                                                                      suppliers in

 $192m                                                                                    120
                                                                                          global locations

1. From bteam.org: The B Team is a not-for-profit initiative formed by a global group of business leaders to catalyse a better way of doing business, for the wellbeing
   of people and the planet.
                                                                                                        Taxes paid: Our economic contribution 2018                        1
GLOBAL OVERVIEW

Our global tax                   Our global taxes and royalties paid
                                 in 2018

contribution                     $6.6bn

  Australia       Canada         Chile                          US

  $4,837m         $386m          $332m                          $331m

  Mongolia        South Africa   UK                             France

  $308m           $79m           $72m                           $47m

  Guinea          Singapore      Indonesia                      Brazil

  $39m            $38m           $27m                           $13m

                                         Taxes paid: Our economic contribution 2018   2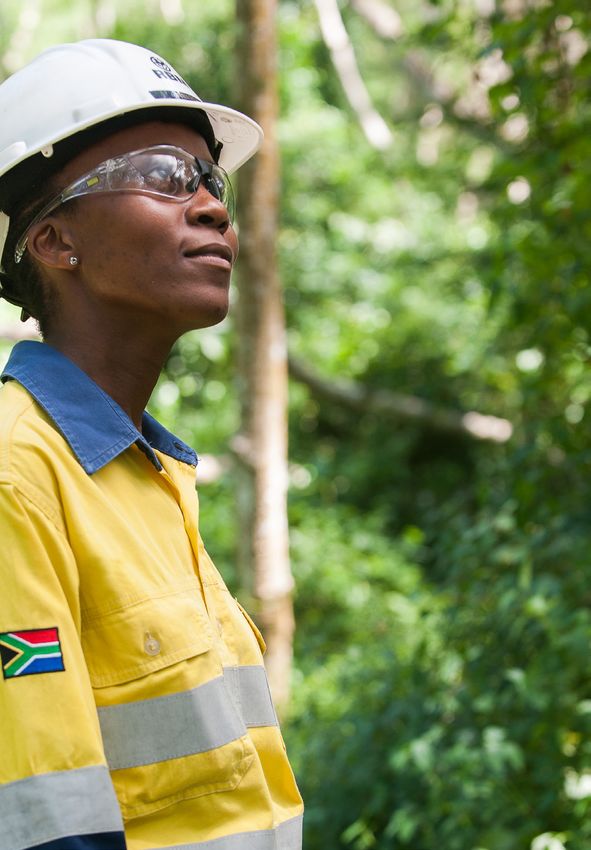
Our global tax contribution
continued

$6.6bn
Global taxes and royalties paid
in 2018
                                                                        $63.0bn            Global taxes and royalties paid
                                                                                           since 2010

$4.8bn
Australian taxes and royalties paid
in 2018
                                                                        $45.8bn        Australian taxes and royalties paid
                                                                                       since 2010

  28.6%                               37.4%                             30.7%                             39.7%
  Global effective                    Global effective tax rate         Australian effective              Australian effective tax
  corporate income tax                on underlying earnings            corporate income tax              rate on underlying
  rate on underlying                  inclusive of royalties            rate on underlying                earnings inclusive of
  earnings in 2018                    in 2018                           earnings in 2018                  royalties in 2018

Group effective corporate income tax rate on underlying earnings

       2014                   2015                    2016                 2017                   2018                  Average
                                                                                                                      (2014-2018)
     28.4%                  26.7%                   22.1%                 28.2%                 28.6%
                                                                                                                       26.8%

Australian effective corporate income tax rate on underlying earnings

       2014                   2015                    2016                 2017                   2018                  Average
                                                                                                                      (2014-2018)
     29.1%                  30.1%                   29.6%                 30.5%                 30.7%
                                                                                                                       30.0%

                                                                                  Taxes paid: Our economic contribution 2018         3
OUR DIRECT ECONOMIC CONTRIBUTION

Working with shared purpose
Our values, experience and history tell us that we must work in a way that
delivers real, lasting benefits for the owners of our company as well as the
wider communities in which we operate. We must care for our employees,
respect and care for the environment while we operate, and rehabilitate the
land when we cease operations. We must contribute our fair share to local
and national economies, including through taxes, and do so transparently.

Direct economic contribution since 2014

2014                   $50,548m

2015                   $36,784m

2016                   $35,318m

2017                   $41,857m

2018                   $42,835m

                                                                                               Payments to suppliers: 29%
                 2018 direct economic                                                          Reinvested: 30%
                 contribution globally                                                         Payables to governments1: 17%

                      $42.8bn                                                                  Dividends and finance items: 12%
                                                                                               Salaries: 11%
                                                                                               Non-government royalties and other: 1%

1. Payables to governments includes charges for corporate income tax, government royalties, employer payroll taxes and other tax charges.

                                                                                                     Taxes paid: Our economic contribution 2018   4
TAXES PAID IN 2017

Australia
Australia is home to around half
of our global assets. We continue
to invest in Australia, with new
developments such as our new,
intelligent Koodaideri iron ore mine
in the Pilbara, and the Amrun
bauxite mine in Cape York.

Of the $6.6 billion Rio Tinto paid
in taxes and royalties during 2018,
$4.8 billion was paid in Australia.

Total taxes and royalties paid

  $4.8bn
  Total taxes and royalties paid in Australia

  $3.17bn
  Corporate income tax paid in Australia

Royalties paid

  $1.45bn
  Total royalties paid to Australian governments

Employee payroll tax

  $666m
  Taxes collected on behalf of employees and
  remitted to Australian governments

Australian underlying earnings 2018                                                                                 $10,025m
Australian effective corporate income tax rate on underlying earnings 2018                                             30.7%
Australian effective tax rate including royalties on underlying earnings 2018                                          39.7%
Total taxes and royalties paid in Australia from 2010 to 2018                                                       $45,880m
Number of employees                                                                                                   19,029

Image: Brisbane, Australia

                                                                                Taxes paid: Our economic contribution 2018     5
AUSTRALIA CONTINUED

                                                                                     Koodaideri:
                                                                            Sharing the benefits
                                                                        of advanced technology

Image: Train carrying iron ore, Pilbara, Western Australia
                                                             Leading the way
                                                             in innovation
In 2019, we’ll begin the construction of                     We’ve included more than 70 innovation projects in the design
our most technologically advanced mine –                     of Koodaideri, helping us connect technology and information
the Koodaideri iron ore mine in Western                      across the whole operation in new ways. We’ve also applied our
Australia. We’re investing $2.6 billion                      Mine of the FutureTM programme to develop advanced extraction
(A$3.5 billion) in the operation, which has                  techniques that reduce environmental impacts and improve
been designed to use the latest techniques                   safety performance. The operation will feature:
in automation and digitalisation, making it
safer and more productive while ensuring it                  –– a digital replica of the processing plant, accessible in real
creates value for businesses and                                time by workers in the field
communities throughout Australia.                            –– fully-integrated mine automation and simulation systems
                                                             –– autonomous trucks, trains and drills
Creating opportunity for                                     –– advanced automation including an automated workshop
Australian businesses                                        –– numerous data analytics capabilities and control loops to
We expect Koodaideri to start producing our                     optimise production and reduce downtime
industry-benchmark Pilbara Blend™ iron ore
product by late 2021, and we’re connecting it
to our main network through a 166km rail
line. The project is expected to generate:

–– more than A$3 billion in procurement
   spend with Australian-based businesses,
   with opportunities for A$2.5 billion for
   Western Australia-based businesses
   during development.
–– jobs for 2,000 people during construction,
   with 600 permanent roles created once
   the mine is operational.
                                                                                           Image: Operations Centre, Perth, Australia

                                                                                 Taxes paid: Our economic contribution 2018             6
Canada

We have invested over
$8 billion in Canada in the last
seven years. With more than
15,000 employees and
contractors working across
more than 35 locations, we are
the largest mining and metals
company in the country.

World leaders in responsible                          Total taxes and royalties paid
aluminium production
Demand for responsibly-sourced products is
growing – and we are leading our industry by
                                                       $386m
                                                       Total taxes and royalties paid in Canada
partnering with our customers to supply low-
carbon, certified aluminium. Our Canadian
aluminium operations produce some of the
highest quality, lowest carbon aluminium in the
world. In fact, our Canadian energy portfolio is
                                                       $114m
                                                       Corporate income tax paid in Canada
100% carbon-free.
                                                      Employee payroll tax
In 2016, we became the first company to

                                                       $412m
introduce certified low-carbon aluminium to the
market – RenewAl – and in 2018, we became the
first company to have our metal certified
responsible by the Aluminium Stewardship               Taxes collected on behalf of employees and remitted to
Initiative (ASI). In 2018, Nespresso announced         Canadian governments
that they will be using our ASI-certified
aluminium for their coffee pods.                      Canadian underlying earnings 2018                                      $1,380m
                                                      Number of employees                                                     10,620
Also in 2018, Rio Tinto and Alcoa – with support
from the Governments of Canada and Quebec,
and Apple – announced the Elysis joint venture to
further develop the world’s first direct
greenhouse gas emissions-free aluminium
                                                      7.0m
smelting process.                                      metric tonnes
The inert anode technology being developed
by Elysis is the most significant innovation in the
                                                       potential reduction in greenhouse gas
aluminium industry for more than a century.            emissions if all aluminium smelters in
This new joint venture is headquartered in
Montreal, Canada and its Research and
                                                       Canada were to use Elysis technology
Development Center will be located at Rio Tinto’s
                                                                                        Image: Area near Kitimat, British Columbia, Canada
Complexe Jonquière, in the Saguenay–Lac-Saint-
Jean region of Quebec, Canada.

                                                                            Taxes paid: Our economic contribution 2018                 7
Mongolia
The Oyu Tolgoi copper mine is a major contributor to the
Mongolian economy. The Oyu Tolgoi operation generated $308
million in taxes, royalties and other payments for Mongolian
governments in 2018. Overall Oyu Tolgoi has paid more than
$2.3 billion in taxes and royalties since 2010.

Oyu Tolgoi – creating value                       Investing in sustainable                        Total taxes and royalties
for Mongolia                                      development                                     paid in Mongolia

Oyu Tolgoi is the biggest employer in the
country, with over 17,000 employees and
contractors (approximately 93% of whom are
                                                  Under a cooperation agreement with local
                                                  communities, Oyu Tolgoi makes an annual
                                                  contribution of $5 million to the Gobi Oyu
                                                                                                  $308m
Mongolian). Oyu Tolgoi is jointly owned by the    Development Support Fund (DSF), an              of this:
Government of Mongolia (34%) and Turquoise        independent fund supporting sustainable
Hill Resources (66%), of which Rio Tinto owns     development. Since 2015, through the DSF,         Total taxes paid to the
51%. Since 2010, we have provided strategic       Oyu Tolgoi has invested $15 million in 78         Mongolian national
and operational management to Oyu Tolgoi.         sustainable development projects and              government
Between 2010-2018, Oyu Tolgoi has spent $2.7      programmes which have resulted in the
billion nationally on procurement, $413 million
of which was spent on procurement from South
Gobi, where the mine is located.
                                                  creation of more than 350 permanent jobs, and
                                                  delivered benefits to over 240,000 community
                                                  members, including scholarships for 142
                                                                                                    $149m
                                                                                                    including royalties of $66m
                                                  students.

                                                                                                    Total taxes paid to four
                                                                                                    Mongolian regional
Mongolian underlying loss 2018                                                       $(337)m        governments
Number of employees                                                                     2,886

                                                                                                    $159m
$8.7bn                                                                                            Employee payroll tax

Invested in Mongolia between
2010 and 2018
                                                                                                    $19m
                                                                                                    Taxes collected on behalf of
                                                                                                    employees and remitted to
                                                                                                    Mongolian governments

Image: Community children, Khanbogd, Mongolia                                 Taxes paid: Our economic contribution 2018       8
United States
We have been creating value in the US for
more than a century, and continue to invest
in our future there. The Resolution project in
Arizona, one of the world’s largest copper
deposits, is progressing through the US
regulatory process with the potential to
begin production in the late 2020s, more
than 25 years after it was discovered.
Total taxes and Employee payroll tax
royalties paid
$331m $17m $47m $93m
Corporate income tax paid in Taxes paid to Salt Lake Taxes collected on behalf of
Total taxes and royalties paid the US County, Utah employees and remitted to US
in the US state and federal agencies
Meeting our customers’ needs Our new location is designed to bring us
closer to our existing and future
in one of our largest markets customers, while also supporting the
In 2018, we opened our American integrated aluminium supply chain
commercial office in Chicago, which has between the US and Canada. It means we
long been one of the world’s historic can better respond and adapt to market
commodity hubs. changes, which in turn will allow us to
better respond to customer needs.
United States underlying loss 2018 $(70)m
Number of employees 3,792
Image: Brooklyn, New York, US Taxes paid: Our economic contribution 2018 9Europe
We pay tax in ten European countries:
–– Belgium –– Germany –– Luxembourg –– Serbia –– Switzerland
–– France –– Iceland –– Netherlands –– Spain –– UK
Our global headquarters are in London.
Total taxes and royalties paid Employer payroll tax
$146m $64m
Total taxes and royalties paid in Europe Employer payroll tax paid in Europe
$44m Employee payroll tax
Corporate income tax paid in Europe $71m
Taxes collected on behalf of employees and remitted to
European governments
Europe underlying earnings 2018 $104m
Number of employees 1,705
Discovering a new mineral in Serbia
In 2004, we discovered a new pre-feasibility study of our potential Alongside our environmental and social
mineral containing both borates jadarite mine and processing facility. impact assessment, the study is allowing
and lithium in Serbia’s Jadar Valley, The study will help us to understand us to explore different ways to
which we called jadarite. After more the scale and quality of the mineral potentially develop the project – from
than a decade of research and and develop new technology to logistics to economics, and environment
development, we have started the extract and process it. to impact on local communities.
Image: Europe at night from space Taxes paid: Our economic contribution 2018 10TAXES PAID IN 2017
Africa
Our operations in Africa include
mines, refineries and processing
plants and, in 2018, we paid tax in
South Africa, Guinea, Namibia,
Madagascar and Zambia.
Total taxes and royalties paid
$132m
Total taxes and royalties paid in Africa
$79m
Total taxes and royalties paid in South Africa
$98m
Corporate tax paid in Africa
Employee payroll tax
$37m
The amount of taxes collected on behalf of employees and
remitted to governments of five countries in Africa
Africa underlying earnings 2018 $222m
Number of employees 4,758
Image: Employee at Richards Bay Minerals
Taxes paid: Our economic contribution 2018 11Latin America
Our interests in Chile, Brazil and Peru include the mining of copper and
bauxite, and an alumina refinery. We are proud partners in the Escondida
mine, the world’s largest copper producer, located in northern Chile.
Image: School children, La Granja, Peru
Total taxes and royalties paid
$347m $13m $22m
Total taxes and royalties paid Total taxes and royalties paid in Brazil Taxes collected on behalf of employees
in Latin America and remitted to Latin American
governments
$332m $2m
Total taxes and royalties paid in Chile Total taxes and royalties paid in Peru
Latin America underlying earnings 2018 (including equity accounted units) $775m
Number of employees 1,499
Taxes paid: Our economic contribution 2018 12ANALYSIS BY COUNTRY AND LEVEL OF GOVERNMENT
Analysis by country
and level of government
This table shows the total of all tax payments for each of the main countries where the Rio Tinto Group has revenue-generating
operations or projects. The Group does not earn any significant profit in countries not listed in this table.
Within each country, total tax payments are reported by the national, regional or local government to which they are paid.
Fees,
dividends
Corporate and other Total
income extractive Other taxes payments to
taxes paid Government related Employer and governments Employee
Country and level of government (US$ millions) (refunded) royalties payments payroll taxes payments borne payroll taxes
Australia 3,165.4 1,449.1 8.9 173.3 40.0 4,836.7 666.1
Australian Taxation Office 3,165.4 6.0 0.1 42.6 5.9 3,220.0 666.1
State of Western Australia – 1,247.9 2.2 87.4 13.2 1,350.7 –
State of Queensland – 151.7 1.7 32.1 2.3 187.8 –
Northern Territory Revenue Office – 43.5 4.9 4.6 (1.4) 51.6 –
State of New South Wales – – – 2.5 0.3 2.8 –
State of Tasmania – – – 2.5 0.1 2.6 –
State of Victoria – – – 1.6 0.1 1.7 –
Shire of Ashburton (WA) – – – – 5.0 5.0 –
City of Karratha (WA) – – – – 4.9 4.9 –
Gladstone Regional Council (QLD) – – – – 3.4 3.4 –
West Arnhem Shire Council (NT) – – – – 1.4 1.4 –
Weipa Town Authority (QLD) – – – – 1.2 1.2 –
Central Highlands Regional Council (QLD) – – – – 1.0 1.0 –
Isaac Regional Council (QLD) – – – – 0.7 0.7 –
Shire of East Pilbara (WA) – – – – 0.7 0.7 –
George Town Council (TAS) – – – – 0.4 0.4 –
Town of Port Hedland (WA) – – – – 0.3 0.3 –
Cook Shire Council (QLD) – – – – 0.2 0.2 –
Other Australian Governments – – – – 0.3 0.3 –
Canada Total 114.4 60.8 10.3 80.2 119.9 385.6 412.1
Canada Revenue Agency 52.9 – – 15.1 4.2 72.2 244.8
Revenu Québec 0.9 – – 58.2 – 59.1 166.4
Ministre des Finances du Québec – 52.3 1.3 – 3.1 56.7 –
Government of Newfoundland and Labrador 36.4 – – 4.6 26.6 67.6 –
Government of Northwest Territories 24.2 – 4.6 0.5 2.2 31.5 0.9
Ministry of Finance of British Columbia – 8.5 – 1.7 4.3 14.5 –
Ville de Saguenay (QC) – – – – 26.6 26.6 –
District of Kitimat (BC) – – – – 18.3 18.3 –
Ville d’Alma (QC) – – – – 9.1 9.1 –
Town of Labrador City (NL) – – – – 7.9 7.9 –
Ville de Sept-Îles (QC) – – – – 6.3 6.3 –
Innu Nation 1 – – 2.6 – – 2.6 –
Ville de St-Joseph-de-Sorel (QC) – – – – 1.8 1.8 –
M.R.C. du Fjord-du-Saguenay (QC) – – – – 1.4 1.4 –
Tlicho Government1 – – 1.2 – – 1.2 –
Commission Scolaire du Lac-Saint-Jean (QC) – – – – 1.1 1.1 –
Commission Scolaire de la Jonquière (QC) – – – – 1.0 1.0 –
Ville de Sorel-Tracy (QC) – – – – 1.0 1.0 –
Commission Scolaire des Rives-du-Saguenay (QC) – – – – 0.9 0.9 –
Municipalité de Sainte-Monique (QC) – – – – 0.9 0.9 –
Taxes paid: Our economic contribution 2018 13ANALYSIS BY COUNTRY AND LEVEL OF GOVERNMENT CONTINUED
Fees,
dividends
Corporate and other Total
income extractive Other taxes payments to
taxes paid Government related Employer and governments Employee
Country and level of government (US$ millions) (refunded) royalties payments payroll taxes payments borne payroll taxes
Ville de Bécancour (QC) – – – – 0.9 0.9 –
Municipalité de Péribonka (QC) – – – – 0.5 0.5 –
Municipalité de Havre-St-Pierre (QC) – – – – 0.5 0.5 –
Yellowknives Dene First Nation1 – – 0.4 – – 0.4 –
Municipalité de l’Ascension-De-Notre-Seigneur (QC) – – – – 0.4 0.4 –
Lutsel K’e Dene First Nation1 – – 0.2 – – 0.2 –
Ministry of Finance of Ontario – – – 0.1 – 0.1 –
Other Canadian Governments – – – – 0.9 0.9 –
Chile Total 322.1 – 1.3 0.1 8.1 331.6 19.7
Servicio de Impuestos Internos 322.1 – 1.3 0.1 8.1 331.6 19.7
US Total 16.6 11.4 56.3 26.3 219.9 330.5 92.7
U.S. Customs and Border Protection – – – – 194.3 194.3 –
US Internal Revenue Service (6.2) – – 25.4 0.2 19.4 74.9
Utah State Tax Commission 11.3 11.4 – 0.4 18.2 41.3 11.2
California Franchise Tax board 6.5 – – 0.4 4.3 11.2 4.5
Ohio Treasurer of State 1.2 – – – – 1.2 –
Minnesota Department of Revenue 1.2 – – – – 1.2 –
Colorado Department of Revenue – – – – 1.0 1.0 0.6
Michigan Department of Revenue 0.6 – – – – 0.6 –
Wisconsin Department of Revenue 0.4 – – – – 0.4 –
New York Department of Taxation and Finance 0.3 – – – – 0.3 –
Pennsylvania Department of Revenue 0.2 – – – – 0.2 –
Oregon Department of Revenue 0.1 – – – – 0.1 –
Tennessee Department of Revenue 0.1 – – – – 0.1 –
New Jersey Department of Treasury 0.1 – – – – 0.1 –
Kansas Department of Revenue 0.1 – – – – 0.1 –
New Mexico Taxation and Revenue Department 0.1 – – – – 0.1 –
Arizona Department of Revenue – – – – – – 0.6
Salt Lake County (UT) – – 46.7 – – 46.7 –
Kern County (CA) – – 9.5 – – 9.5 –
Pinal County (AZ) – – – – 0.4 0.4 –
Los Angeles County (CA) – – – – 0.3 0.3 –
Hidalgo County (TX) – – – – 0.1 0.1 –
Inyo County (CA) – – – – 0.1 0.1 –
Other US Governments 0.6 – 0.1 0.1 1.0 1.8 0.9
Mongolia Total 2 0.3 65.5 12.9 17.7 212.1 308.5 19.1
General Department of Taxation 0.3 65.5 0.2 0.1 83.1 149.2 1.7
Ulaanbaatar City – – 1.0 17.6 87.1 105.7 10.5
Umnugobi Aimag – – 6.2 – 41.9 48.1 6.9
Khanbogd Sum – – 0.5 – – 0.5 –
Gobi Oyu Development Support Fund1 – – 5.0 – – 5.0 –
UK Total 35.5 – – 12.4 24.2 72.1 39.0
HM Revenue & Customs 35.5 – – 12.4 17.7 65.6 39.0
Westminster City Council – – – – 6.5 6.5 –
France Total – – – 40.8 6.3 47.1 14.8
Direction Générale des Finances Publiques National – – – – (6.5) (6.5) –
Union de Recouvrement des Cotisations de Sécurité – – – 40.8 – 40.8 14.8
Sociale et d’Allocations Familiales
Direction Générale des Finances Publiques– Rhône- – – – – 3.6 3.6 –
Alpes
Direction Générale des Finances Publiques– Nord – – – – 9.1 9.1 –
Direction Générale des Finances Publiques– Île-de- – – – – 0.1 0.1 –
France
Taxes paid: Our economic contribution 2018 14ANALYSIS BY COUNTRY AND LEVEL OF GOVERNMENT CONTINUED
Fees,
dividends
Corporate and other Total
income extractive Other taxes payments to
taxes paid Government related Employer and governments Employee
Country and level of government (US$ millions) (refunded) royalties payments payroll taxes payments borne payroll taxes
Iceland Total – – 0.1 8.2 3.0 11.3 9.9
Directorate of Internal Revenue – – 0.1 8.2 0.6 8.9 9.9
Town of Hafnarfjörður – – – – 2.4 2.4 –
China Total 5.6 – 0.2 – 0.8 6.6 3.1
State Administration of Taxation 5.6 – 0.2 – 0.8 6.6 –
Shanghai Municipality – – – – – – 2.3
Beijing Municipality – – – – – – 0.5
Other Chinese Governments – – – – – – 0.3
Netherlands Total 2.2 – – 1.4 2.3 5.9 3.2
Tax and Customs Administration 2.1 – – 1.4 2.0 5.5 3.2
City of Rotterdam 0.1 – – – 0.3 0.4 –
Switzerland Total 1.3 – – – 0.3 1.6 0.2
Federal Tax Administration 1.0 – – – 0.3 1.3 –
Stadt Zurich 0.3 – – – – 0.3 0.2
Total Other 167.0 52.0 3.1 10.5 4.5 237.1 62.0
South Africa – South African Revenue Services 59.3 18.7 – 1.2 – 79.2 25.1
Guinea – Presidency of the Republic of Guinea 38.7 – – 0.3 0.1 39.1 0.1
Singapore – Inland Revenue Authority of Singapore 35.3 – – 3.0 (0.1) 38.2 –
Indonesia – Directorate General of Taxes 4.2 22.4 – – 0.3 26.9 0.9
Brazil – Federal Revenue of Brazil 6.7 1.6 – 3.2 1.4 12.9 1.2
New Zealand – Inland Revenue Department 14.6 – – 0.1 (2.0) 12.7 13.7
Namibia– National Taxation Authority – 6.8 0.6 0.1 0.2 7.7 10.8
Madagascar – General Direction of Taxes – 2.5 0.4 0.3 2.3 5.5 1.0
Luxembourg – Ministry of Finance 4.0 – – – 0.2 4.2 –
Belgium – Federal Public Service Belgium 1.5 – – 1.2 – 2.7 2.0
India – Indian Tax Department 1.9 – – – 0.5 2.4 1.7
Peru – The National Superintendency of Customs and (0.2) – 1.7 0.7 – 2.2 1.0
Tax Administration
Spain – Agencia Tributaria 0.1 – – – 0.8 0.9 –
Kazakhstan – State Revenue Committee – – – 0.2 0.7 0.9 –
Japan – National Tax Agency 0.7 – – – – 0.7 2.8
South Korea – National Tax Service 0.3 – – – – 0.3 –
Serbia – Tax Administration – – – 0.2 0.1 0.3 0.7
Zambia – Zambia Revenue Authority – – 0.2 – – 0.2 –
Laos – Tax Department – – 0.2 – – 0.2 0.1
Papua New Guinea – Internal Revenue Commission – – – – – – 0.1
Germany – Federal Ministry of Finance (0.1) – – – – (0.1) 0.8
Total payments to governments 3,830.4 1,638.8 93.1 370.9 641.4 6,574.6 1,341.9
Total 2018 net refunds from governments on sales taxes, VAT, GST, excise duties, fuel credits and withholding taxes on supplier invoices not borne by Rio Tinto were
$1.6 billion. These refunds are not included in the table above.
1. Indigenous governments and other bodies have been included to comply with extractive industry reporting requirements in the United Kingdom and Canada.
2. The fiscal structure was agreed with the Government of Mongolia in 2009 and reaffirmed when the Underground Mine Development agreement was signed in 2015.
In January 2018 the Mongolian tax authority issued tax assessments alleging underpayment of $155 million of tax. Rio Tinto does not agree with these assessments
and has commenced action to resolve the dispute.
Taxes paid: Our economic contribution 2018 15PROJECT-BY-PROJECT ANALYSIS
Tax payments made on
a project-by-project basis
The analysis by project is prepared in accordance with the basis of preparation in Appendix 2.
Total
Fees, Payments to
dividends and governments
Corporate other for EU Total
income extractive Accounting Other taxes payments to
taxes paid Government related Directive Employer and governments Employee
Product group and project (US$ millions) (Refunded) royalties payments purposes payroll taxes payments borne payroll taxes
Iron Ore 2,974.4 1,236.5 0.6 4,211.5 95.1 27.4 4,334.0 360.7
Pilbara – Western Australia 2,974.4 1,236.5 0.6 4,211.5 95.1 27.4 4,334.0 360.7
Copper & Diamonds 280.8 108.2 68.1 457.1 37.6 243.8 738.5 113.3
Oyu Tolgoi – Mongolia 0.1 65.5 12.9 78.5 17.6 212.1 308.2 19.1
Kennecott Utah Copper – US (20.0) 11.4 46.7 38.1 13.7 18.2 70.0 41.8
Resolution Copper – US (13.9) – – (13.9) 1.0 0.5 (12.4) 3.5
Grasberg – Indonesia (0.2) 22.4 – 22.2 – 4.7 26.9 0.9
Argyle – Australia (34.6) 8.9 1.0 (24.7) 3.6 0.1 (21.0) 15.0
Diavik – Canada 27.5 – 6.5 34.0 1.7 0.5 36.2 14.6
Escondida – Chile – EAU1 321.9 – 1.0 322.9 – 7.7 330.6 18.4
Energy & Minerals 670.4 93.3 15.0 778.7 48.5 58.9 886.1 224.6
New South Wales Coal – Australia 96.7 – – 96.7 – – 96.7 –
Queensland Coal – Australia 423.8 62.8 0.2 486.8 9.1 2.4 498.3 32.3
Rössing – Namibia – 6.8 0.6 7.4 0.1 0.2 7.7 10.8
Rio Tinto Fer et Titane – Canada (6.3) – 1.3 (5.0) 13.4 6.4 14.8 43.9
QIT Madagascar Minerals – 2.5 0.4 2.9 0.3 2.3 5.5 1.0
Richards Bay Minerals – South Africa 56.8 18.7 – 75.5 1.2 2.1 78.8 21.3
US Borax 31.4 – 9.5 40.9 6.3 5.8 53.0 21.2
Dampier Salt – Australia 1.8 2.5 0.4 4.7 2.7 1.2 8.6 10.0
Iron Ore Company of Canada2 66.1 – 2.6 68.7 15.2 38.5 122.4 83.4
Jadar – Serbia – – – – 0.2 – 0.2 0.7
Queensland Coal – Australia – EAU1 0.1 – – 0.1 – – 0.1 –
Aluminium 45.3 133.9 6.3 185.5 16.2 3.5 205.2 41.3
Gove – Australia – 43.5 4.9 48.4 4.0 (0.3) 52.1 11.3
Weipa including Amrun – Australia 6.4 88.9 1.4 96.7 10.0 2.7 109.4 29.5
Sangaredi – Guinea – EAU1 38.7 – – 38.7 – – 38.7 –
Porto Trombetas – Brazil – EAU1 0.2 1.5 – 1.7 2.2 1.1 5.0 0.5
Exploration (17.4) – 2.4 (15.0) 4.8 2.2 (8.0) 14.8
Exploration – Australia (11.2) – – (11.2) 1.6 0.9 (8.7) 6.8
Exploration – Chile 0.2 – 0.2 0.4 0.1 0.3 0.8 1.3
Exploration – US (8.0) – – (8.0) 0.6 0.1 (7.3) 3.1
Exploration – Peru (0.1) – 1.7 1.6 0.7 – 2.3 1.1
Exploration – Brazil 0.2 – – 0.2 0.8 0.1 1.1 0.7
Exploration – Simandou – Guinea – – – – 0.3 0.1 0.4 0.1
Exploration – Other 1.5 – 0.5 2.0 0.7 0.7 3.4 1.7
Non-extractive projects (123.1) 66.9 0.7 (55.5) 168.7 305.6 418.8 587.2
Smelting and Refineries 209.5 60.9 0.2 270.6 115.6 279.8 666.0 367.4
Commercial, finance, head office and (332.6) 6.0 0.5 (326.1) 53.1 25.8 (247.2) 219.8
managed operations
Total payments to governments 3,830.4 1,638.8 93.1 5,562.3 370.9 641.4 6,574.6 1,341.9
1. EAU: Equity accounted units will not be included in the formal UK filing of the “Reports on Payments to Governments” to be filed at Companies House.
2. Iron Ore Company of Canada is reported within Energy & Minerals, reflecting management responsibility.
Taxes paid: Our economic contribution 2018 16RECONCILIATION OF CORPORATE INCOME TAX AND ROYALTIES
Reconciliation of accounting
profit and tax and royalties
charges
Reconciliation of 2018 accounting profit and total tax charge Reconciliation of 2018 total tax charge and current tax charge
US$ millions US$ millions
Profit before tax 18,167 Total tax charge 4,242
Less: share of profit after tax of equity accounted units (513)
17,654 Temporary differences
Expected tax charge at UK rate of 19% 3,354 Unrealised exchange losses (57)
Higher rate of tax on Australian underlying earnings Tax losses 30
at 30% 1,106 Provisions 19
Impact of items excluded from underlying earnings (a) (270) Capital allowances (461)
Other tax rates applicable outside the UK and Australia (47) Tax on unremitted earnings 33
Write-down of previously recognised deferred tax assets 13 Post-retirement benefits (30)
Other items 86 Other temporary differences (50)
Total tax charge 4,242 Current tax charge 3,726
(a) Impact of items excluded from underlying earnings Reconciliation of 2018 current tax charge and corporate income tax paid
US$ millions US$ millions
Net gains/losses on consolidation and disposal 2018 Current tax charge 3,726
of businesses (251) Add: current tax charge of equity accounted units 273
Exchange and derivatives gains/losses 32 3,999
Gains relating to surplus land at Kitimat (81) Final instalment in Australia on 2017 profits paid
Losses from increases to closure estimates 30 in H1 2018 1,142
Total impact of exclusions (270) Final instalment in Australia on 2018 profits due
in H1 2019 (1,300)
Reconciliation of royalties expense to royalties paid Tax charge greater than tax payments (timing) (11)
US$ millions
Corporate income tax paid 3,830
Royalties included in underlying earnings 1,680
Royalties charges greater than royalty payments
(timing) (41)
Total royalties paid 1,639
Effective corporate income tax rates on total earnings
Effective corporate
US$ millions Profit before tax Total tax charge income tax rate
Underlying earnings 12,018 3,441 28.6%
Exclusions from underlying earnings 5,636 801 14.2%
17,654 4,242 24.0%
Add share of profit after tax of equity accounted units 513
Total profit before tax 18,167
Taxes paid: Our economic contribution 2018 17PAYMENTS TO GOVERNMENTS AND THE MINING LIFE CYCLE
Payments to governments
and the mining life cycle
Our projects are long-term investments, and the amount we contribute to
governments varies depending on where the project is in its life cycle.
Explore and evaluate – 10-20 years
The first phase of a project is exploration and evaluation.
Payments made to governments during this stage usually
Repurpose Explore include employment-related taxes for small project teams,
and and as well as payments for permits, fees and licences. Generally,
renew evaluate
no corporate taxes or royalties are paid in this phase.
Develop and innovate – Up to 10 years
The increased expenditure created by the design and
Disciplined construction of a facility, as well as employment taxes
capital associated with the greater number of staff employed to work
allocation on the project, mean there is usually more taxes paid during a
Market Develop
and and project’s second phase. Withholding taxes and unrecoverable
deliver innovate GST/VAT on payments supporting the development of the
project may be relevant. As tax losses will generally arise,
there may be no corporate taxes paid in this phase.
Mine and
process Mine and process | Market and deliver – Decades
Once the facility is operational, governments begin to receive
royalty payments, which can span many decades. In the initial
years of operation, there may be no corporate income taxes paid,
as allowances for the capital costs associated with construction
It takes significant upfront investment
are applied or tax losses from the design and construction phase
to build world-class operations. To be
are utilised. Once tax losses have been utilised, corporate
sustainable, we believe tax policy needs to
income taxes will be paid. As corporate income taxes are related
take into account the cyclical nature of our
to profits, commodity prices affect the tax revenue collected by
industry, and to respect agreements under
governments. Profitable operations can result in a significant
which investment capital has already been
economic contribution in the form of taxes and royalties as well
committed.
as other benefits to local economies in the form of employment,
payments to suppliers and support to local communities.
The risk of fiscal instability can influence the
global flow of capital and a country’s ability
Repurpose and renew – 5+ years
to attract and retain investment. In order to
Payments to governments in the final closure and post-closure
continue to support investment in a country,
phases will be significantly less than in the operating phase.
its tax law should not be retrospective.
Taxes paid: Our economic contribution 2018 18PURSUING A SUSTAINABLE TAX STRATEGY
Our commitment to transparency
and responsible tax principles
Transparency is an enabler of sustainable development, which is why it sits as a
foundational base of our refreshed integrated sustainability approach. We are therefore
committed to supporting the meaningful disclosure of our economic contribution,
including payments to local and national governments.
We believe that greater transparency and 5. Where we claim tax incentives offered by In 2018, we expanded our disclosure
accountability are key to building trust, government authorities, we seek to commitments through a transparency
encouraging sustainable business practices ensure that they are transparent and statement that responds to societal
and translating taxes and royalties into consistent with statutory or regulatory expectations of the active role companies
beneficial development outcomes for those frameworks. can play in supporting strong mineral
communities that host us. By partnering 6. We engage constructively in national and resource governance and equitable
with investors, governments and civil international dialogue with governments, development. We are committed to disclose
society, multinationals can be at the business groups and civil society to contracts with governments in relation to
forefront of collaborative efforts to restore support the development of effective tax minerals development, where they are not
integrity and support stable and effective systems, legislation and administration. subject to a confidentiality undertaking, and
tax systems. That is why we are a founding we encourage governments to allow such
7. We provide regular information to our
member of the Extractive Industries disclosures. We support beneficial
stakeholders, including investors, policy
Transparency Initiative (EITI), and a ownership disclosure, and we strive to
makers, employees, civil society and the
signatory to the B Team Tax Principles. provide information concerning the
general public, about our approach to tax
beneficial owners of those entities that we
and taxes paid.
The B Team is a not-for-profit initiative have joint ventures with, in line with the EITI
formed by a global group of business Building on a track record Standard and expectations.
leaders to catalyse a better way of doing
business, for the wellbeing of people and
of transparency We continue to engage with governments
the planet. The B Team Responsible Tax We have long recognised the crucial role we and other stakeholders to share our
Principles define what leadership in play in growing strong, sustainable experiences on disclosure and transparency,
responsible tax looks like, and were economies by contributing to the societies in and we encourage the harmonisation of
developed by a group of cross-sector, which we operate. With this in mind we are reporting obligations aligned with global
cross-regional companies to articulate best committed to maintaining a leadership role in best practice. As our CFO made clear in the
practice in seven key areas. developing best practice in tax transparency. introduction to this report, we believe that
We have been making comprehensive the creation of a consistent standard by
Our disclosures in this report demonstrate disclosures around our tax payments since which companies can report their
our approach to the seven Responsible Tax publishing our first Taxes paid report in 2010, contributions with integrity and
Principles: and we aim to continue to improve our tax responsibility is essential to promoting
payment reporting by adopting best practice confidence in business. We support the
1. Tax is a core part of corporate and regulatory developments. This report initiative by the Global Sustainability
responsibility and governance, and is builds on our track record of transparency. Standards board of the Global Reporting
overseen by the board of directors Our disclosures include country-by-country Initiative (GRI) in formulating a Tax &
(the board). data on taxes and payments to government, Payments to Governments standard, and we
2. We comply with the tax legislation of the as well as project-by-project disclosures. are committed to implementing the
countries in which we operate, and pay standard once it is finalised.
the right amount of tax at the right time This report meets the requirements of
in the countries where we create value. the Australian voluntary Tax Transparency This report shows how country disclosures
Code. We also file additional reports to can be made by groups on a voluntary basis.
3. We will only use business structures that
disclose payments to governments In a number of areas, for example
are driven by commercial considerations,
connected with extractive activity to meet sustainable development, voluntary
are aligned with business activity and
requirements in the UK and Canada transparency has been shown to encourage
which have genuine substance. We do
(Chapter 10 of EU Accounting Directive innovation in reporting, while proactive
not seek abusive tax results.
2013/34 and the Extractive Sector engagement with stakeholder audiences has
4. We seek, wherever possible, to develop Transparency Measures Act respectively). been shown to support the development of
cooperative relationships with tax These reports include the project-by-project improved reporting models. We support
authorities, based on mutual respect, information disclosed in this report. these trends.
transparency and trust.
Taxes paid: Our economic contribution 2018 19OUR APPROACH TO TAX
Our approach to tax
Our Group Tax Policy (“Policy”) governs our approach to tax strategy,
and is reviewed and approved by the board each year.
The primary responsibility of the Group in relation to taxation is to ensure compliance with the law and relevant
statutory compliance obligations. Within the limits established by these statutory requirements, and subject to the
principles set out in this policy, the Group manages its tax affairs in a proactive manner that seeks to maximise
shareholder value in accordance with the Group’s strategy.
Rio Tinto Tax Policy
Tax risk management The board reviews and Subject to oversight by the board The Group adopts formal
and governance approves the Policy, and and management, the conduct of processes to identify and manage
management’s adherence the Group’s tax affairs and the risks. Material risks
to it, on an annual basis. management of tax risk is are reported to the board
delegated to a global team of tax Audit Committee.
Management enforces the
professionals.
Policy and monitors the We apply the arm’s length principle
appropriateness, adequacy The Group complies with to cross-border transactions in line
and effectiveness of the tax documented tax risk management with guidelines issued by the
risk management systems. procedures and thorough risk Organisation for Economic
assessments are completed before Co-operation and Development
entering into significant (OECD).
transactions.
Dealings with tax The Group values having good The Group proactively engages Where there is uncertainty or
authorities relations with tax authorities and is with tax authorities on a real-time disagreement in the application of
committed to transparency with basis, including participation in the law we work with tax
tax authorities. co-operative compliance authorities to seek clarity or
arrangements (for example in resolve disagreements on a timely
Australia). basis.
Principles of tax Tax planning is aligned with our The Group pays the tax that is due Where the Group takes an
planning and tax risk business strategy and conforms to under a reasonable interpretation uncertain position in relation to a
management our global code of business of the tax law. major business transaction or
conduct, The way we work. initiative, we seek an opinion from
We use business structures that
an independent external adviser to
The Group actively considers the are driven by commercial
support its position.
implications of tax planning on the considerations, aligned with
Group’s corporate reputation. business activity.
Tax incentives and We pay tax on profits according to The Group avails itself of tax Where we access incentives
concessions where business activity occurs and concessions and incentives offered aligned with our business
value is created. by countries to eligible taxpayers objectives we comply with the
who undertake genuine business relevant statutory framework and
activity. meet all reporting requirements.
Supporting effective We support simple, stable and We engage constructively in
tax systems competitive tax laws and local and international tax reform
administration. dialogue to contribute to the
development of sustainable and
effective tax systems.
Rio Tinto will not: Undertake aggressive Take positions that do not have a Artificially transfer profits
tax planning. reasonable basis or which rely on from one business location to
non-disclosure. another to avoid taxation.
Taxes paid: Our economic contribution 2018 20OUR APPROACH TO TAX: CONTINUED
Intra-group transactions Service with information sharing under Finance. This enhances collaboration and
JITSIC regarding a cross-border the sharing of commercial best practices
The operation of a large multinational transaction, which made for a faster across product groups and other
company such as ours involves a large resolution between the two tax corporate functions. Singapore offers a
number of transactions between Group authorities. stable regulatory and legal environment
entities located in different countries. that encourages trade and investment,
Transactions between Group entities are We disclose our material intra-group and is a recognised centre for global
driven by commercial reality, and pricing transactions with revenue authorities commodities trading. The country’s
for these transactions is set to ensure through the lodgement of our tax returns critical mass of global commodities
that remuneration for each entity involved and other co-operative compliance experience and depth of marine and
is aligned with its underlying business arrangements such as our Annual logistics capability, along with its highly-
activities and the risks assumed. We set Compliance Arrangement (ACA) with the educated population, provides access to a
our transfer prices using the “arm’s Australian Taxation Office (see below). large, diverse and highly-trained talent
length” principle in line with guidelines We also comply with the OECD’s country- pool. Many of our major customers,
issued by the OECD and in accordance by-country reporting requirements. This trading partners and service providers
with local country transfer pricing reporting provides tax authorities in each have offices in Singapore.
legislation. We apply globally-consistent jurisdiction in which we operate with a
transfer pricing policies so that the pricing clear overview of our intra-group Our sales and marketing teams work
of all transactions between intra-group transactions, of where our profits, sales, hand-in-hand with our product groups to
companies reflects the underlying employees and assets are located, and enable us to better address customer
economic contribution made through the of where taxes are paid and accrued. This needs and adjust our operations to meet
activities undertaken, assets utilised and ensures a wide dissemination of market demands. Our customer and
risks assumed. information among tax administrations. supplier interactions provide us with
unique insights and data that we can use
To reduce the risk of dispute and achieve Details of our material intra-group to create and unlock value today, as well
certainty on taxation outcomes, we have transactions are discussed in more as shaping our future resource
in some cases entered into Advance detail below. investment decisions. Obtaining the best
Pricing Agreements (APAs) with tax value for our products maximises the
authorities to agree the pricing for value to Rio Tinto, our shareholders and
Commercial centre activities
international related party transactions. to the countries in which we produce our
If there are disputes over transfer pricing, Our commercial strategy is centred on commodities via the taxes we pay.
we prefer to seek agreement between the partnering with Rio Tinto’s product
relevant tax authorities so we can obtain groups, customers and suppliers to As a critical supply chain partner to our
certainty and reduce double taxation. generate insights and unlock value for all mining businesses, our Marine & Logistics
stakeholders. Being closer to our business is responsible for providing safe
We support international co-operation customers enhances opportunities to and sustainable global shipping services
between tax authorities by proactively identify and respond to market and acts as the central repository of
providing information to be shared developments. As over 65% of the maritime and logistics expertise for the
through networks such as the Joint Group’s sales are to customers in the Group. A key focus is on ensuring high
International Taskforce on Shared Asia region, this is facilitated by the operational and safety standards, both in
Intelligence & Collaboration (JITSIC). We location of our global commercial third party ships, across Marine’s fleet of
believe this approach can enhance centre in Singapore, supported by owned ships, and in our third party and
relationships with tax authorities, offices in Chicago, Frankfurt, China, transload sites. We currently employ
optimise compliance with international Japan and South Korea. approximately 50 shipping professionals
and national tax rules, and shorten in Singapore, supported by offices in
examination processes related to With over 450 employees based in Montreal, Frankfurt, Chicago, Sorel and
cross-border business activities. This Singapore, our commercial centre brings Brisbane. By volume, Rio Tinto is the
helps reduce costs for both the revenue together our global Sales & Marketing, largest dry bulk shipping business in the
authorities and Rio Tinto by ensuring tax Procurement and Marine & Logistics world, operating 17 vessels of its own and
issues can be resolved in a timely and businesses, supported by functions contracting a fleet of around 200 vessels
cost effective manner. For example, we including Market Analysis, Economics, at any given time. Logistics supports
recently supported the Australian Commercial Treasury, Insurance, inbound and outbound physical
Taxation Office and US Internal Revenue HR, Legal, Corporate Relations and distribution using rail, truck, container,
Taxes paid: Our economic contribution 2018 21OUR APPROACH TO TAX: CONTINUED
barge and warehouse facilities, providing All transactions with our Singaporean requirements. Rio Tinto objected to the
a global framework of both international entities are on an arm’s length basis, and Australian Taxation Office assessments,
and domestic freight services. Our are priced in accordance with OECD which gave rise to an independent
Marine & Logistics business has been guidelines and local legal legislative Australian Taxation Office review of the
able to benefit from Singapore’s position requirements. Determining appropriate assessments. At the time of writing, the
as a leading international maritime pricing can be a matter of interpretation, so Australian Taxation Office has not
centre, tapping into its ecosystem of for many new transactions we have sought determined (ie reviewed and decided
maritime and logistics service providers guidance from relevant revenue authorities. upon) those objections. In accordance
and talent pool. with normal administrative practice we
Various revenue authorities have have paid 50% of the tax amount under
Our Procurement business delivers reviewed the pricing of transactions the assessments to the Australian
industry-leading value as the provider of between entities in their jurisdiction and Taxation Office. The assessments also
easy-to-use, quality services that enable the Singapore commercial centre, and result in double taxation as a
product groups to focus on core accepted the pricing applied by Rio Tinto. consequence of the tax which has been
operational objectives. Procurement paid in Singapore in respect of the
generates greater cash to Rio Tinto We are however currently in dispute with transactions which are in dispute.
through lower costs, effective the Australian Taxation Office in relation The Australian Taxation Office is currently
management of working capital and to the valuation of certain transactions auditing later periods involving the
better productivity. Global category with our Singapore commercial centre. As same transactions.
teams are located close to relevant with all disputes over transfer pricing
assets, with non-asset specific global valuation, it ultimately concerns the Intra-group financing
categories located in Singapore. Regional interpretation of transfer pricing rules and
sourcing teams are located in regional Our Group funding requirements are met
the arm’s length principle, which can be
hubs (mostly Montreal and Perth) through a combination of external and
open to differing interpretation and
partnering with local businesses co- intra-group financing arrangements.
differences of view, including between the
located at key sites. Excess cash from activities within the
relevant countries involved.
Rio Tinto Group is managed by a team of
Treasury experts who facilitate cash
Rio Tinto also undertakes captive In 2017 the Australian Taxation Office
management and loan financing, enabling
insurance activities in Singapore (see issued amended income tax assessments
efficient cash flow management between
section on Insurance). to Rio Tinto for the calendar years 2010
Rio Tinto entities. Rio Tinto entities
to 2013, requiring the company to pay
located in the United Kingdom and
The total profit made by our Singapore additional tax of A$379 million plus
Australia provide cross-border intra-
entities from global sales and marketing interest of A$68 million, a total of A$447
group financing arrangements to Group
activities in 2018 was $264 million. This million. This payment would be in addition
companies. Consequently any income,
represents less than 2% of our global to the A$25.5 billion of taxes and
including interest received by these
profits of $18.2 billion and less than 3% royalties Rio Tinto paid in Australia during
Rio Tinto companies, is subject to tax
of our Australian profits of $11.8 billion. the same four-year period.
in the United Kingdom or Australia at
normal corporate tax rates. The pricing of
The profit made by our Singapore entities The amended assessments do not relate
these intra-group financing arrangements
from other activities including marine, to any tax avoidance schemes as
is consistent with the arm’s length
logistics, procurement and insurance in confirmed by the Australian Taxation
principle as set out in the OECD
2018 was $224 million. Office, and no penalties have been levied
guidelines, and we are transparent with
by the Australian Taxation Office. The
all relevant tax authorities in respect of
The Singapore government legislates tax issue in dispute is the allocation of value
our intra-group financing.
incentives which are available to all between Australia and Singapore.
taxpayers who meet significant economic Rio Tinto voluntarily approached the
The Turquoise Hill Resources Group
substance requirements. Details of the Australian Taxation Office more than a
provides mine development funding in
tax incentives which apply to the activities decade ago seeking to confirm its pricing
relation to the Oyu Tolgoi project through
in our Singapore commercial centre are arrangements. The transfer price adopted
a Luxembourg financing entity where the
outlined in the “Tax incentives” sections by Rio Tinto in the years covered by the
application of a Double Tax Agreement
below. The entities in Singapore are assessments is in line with the outcome
reduces withholding taxes. This funding
subject to the application of the UK agreed with the Australian Taxation
arrangement is transparent to the
Controlled Foreign Corporations Office for years prior to 2010.
revenue authorities, underpinned by
legislation which does not generally
revenue authority rulings, and subject to
subject those profits to any significant We consider that our pricing is in
international tax rules (specifically
level of UK taxation. accordance with the internationally
controlled foreign corporation rules) in
recognised OECD guidelines and
the UK and Canada.
Australian domestic legislative
Taxes paid: Our economic contribution 2018 22You can also read