Technical Advisory Group Policy Modelling - December 2020 and January 2021 - 18 December 2020 - December 2020 ...
←
→
Page content transcription
If your browser does not render page correctly, please read the page content below
Technical Advisory Group

Policy Modelling - December
2020 and January 2021
18 December 2020

© Crown copyright 2020

TAG ADVICE ONLY                                          NOT WELSH GOVERNMENT POLICY

 Technical Advisory Group - Policy Modelling - December
                 2020 and January 2021

 What is new in this paper

 The Covid-19 epidemic is growing in Wales with a deteriorating outlook (medium-
 high confidence).

 It is difficult to accurately estimate Rt values as behaviours in the run up to
 Christmas may be changing (e.g. proportion of symptomatic people seeking tests).
 However, there is evidence from test positivity increase, growth rate and doubling
 times that we are in a period of exponential growth (high confidence).

 From the current mobility and activity data it is unlikely the current policies
 underpinning alert level 3 restrictions will have the desired impact on the growth of
 the epidemic (medium confidence).

 Changes in epidemic growth from the national implementation of alert level 3
 restrictions on the 4 December have not yet been observed. Any beneficial
 impacts on NHS demand will not be observed for at least one or two weeks.
 (medium confidence)

 The current growth in the epidemic combined with Christmas mixing is likely to
 lead to a substantial increase in NHS demand and reduction in NHS and social
 care capacity in the New Year (high confidence).

 The potential beneficial impacts of higher alert levels, with regard to prevented
 harm from COVID-19, will depend on the public’s willingness, understanding,
 motivation and ability to adopt protective behaviours (e.g. not mixing between
 households).

 To minimise health harms and reduce economic impacts, short, sharp
 interventions that satisfy alert level criteria rather than set dates are recommended
 (medium confidence).

 The uncertainty that the Christmas mixing period gives to forecasting data makes
 the confidence intervals too wide for reliable estimation of future NHS demand. A
 risk-based approach should be adopted. (high confidence)

 The most efficient way to reduce harm from covid-19 and pressure on the NHS is
 to remove the Christmas relaxation policy and move to alert level 4 restrictions as
 soon as practically possible (high confidence)

                                           2
TAG ADVICE ONLY                                                                  NOT WELSH GOVERNMENT POLICY

    1. Summary
This paper considers the current state of the epidemic in Wales and the modelled
impacts of NPIs before and after Christmas. In doing so it estimates the impact of
tiers or alert levels (herein, levels) on growth of the epidemic and impacts for NHS
Wales, including deaths, hospitalisations and ICU occupancy over the winter period.
The paper does not consider the additional non-COVID impacts of winter NHS
pressures nor does it forecast staffing requirements or impacts of staff absences
through quarantine or illness. The paper does not revisit previous modelling or TAG
advice on non-pharmaceutical interventions that have been published1,2,3.

The paper describes a deteriorating picture of the epidemic in Wales in the run-up to
Christmas with increasing covid health harms and negative impacts on the NHS
being accrued in the coming weeks. Given the uncertainty of impacts of current
restrictions and very likely increase in cases in the coming weeks, immediate
actions, equivalent to alert level 4, to suppress growth of the virus, is recommended.

The health benefits of restrictions are considerable in preventing deaths and hospital
admissions, but the GVA costs are also substantial and may be greater. There are
also indirect health harms and impacts on wellbeing that have not been costed which
may be considerable. Efforts to monitor and mitigate socioeconomic harms should
continue to be an integral part of the advice and the decision making process.

    2. Current Situation (15 December)
The most recent estimate of the Reproduction number (Rt) for Wales from SAGE (9
December 2020) is predicted to be between 0.9 and 1.2 (SPI-M from 16 December
is higher at 1.0 to 1.3). The estimate of Rt is shown as a range without a central
estimate. Public Health Wales have also estimated Rt for Wales using data on the
number of positive cases. Public Health Wales have also estimated Rt for Wales
using data on the number of positive cases. As of 15 December 2020, Rt in Wales is
estimated to be 1.56 (95 % confidence interval 1.54 – 1.58). And the all Wales
doubling time estimated by PHW is 9.1 days.

    Nation                                 Growth rate per day                                      Rt
    Wales                                            -1% to +4%                                0.9 – 1.2
    England                                           -2% to 0%                                0.8 – 1.0
    Scotland                                          -5% to -2%                               0.7 – 0.9
    Northern Ireland                                 -3% to +1%                                0.8 – 1.1
    UK                                                -2% to 0%                                0.9 – 1.0

1
  https://gov.wales/technical-advisory-group-statement-regarding-non-pharmaceutical-interventions-pre-christmas-period
2
  https://gov.wales/technical-advisory-group-effectiveness-non-pharmaceutical-interventions-local-health-protection
3
  https://gov.wales/technical-advisory-group-fire-breaks

                                                             3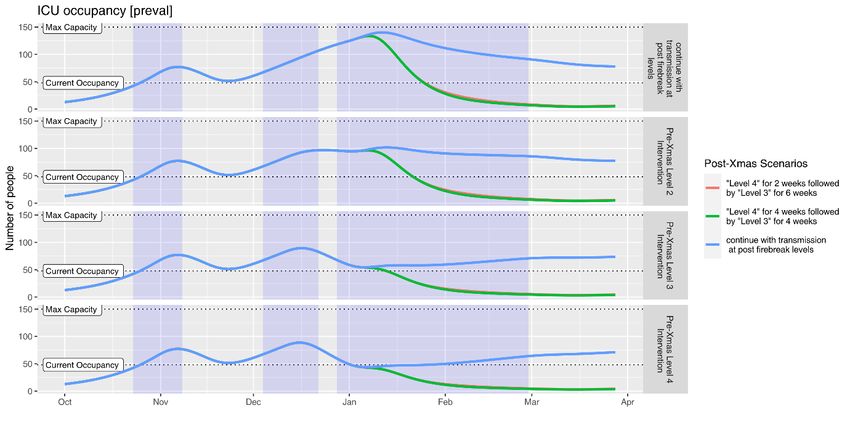
TAG ADVICE ONLY                                                                  NOT WELSH GOVERNMENT POLICY

The ONS infection survey data shows that test positivity appears to have increased
in the most recent week of data (29 November and 05 December), after falling from
a peak at the end of October4. These data are helpful because they are the only
estimates of infection covering asymptomatic as well as symptomatic cases, and
they are not affected by other factors such as testing capacity or the number of
people coming forward for testing.

The ONS results are for private households only – the ‘community population’ – and
do not apply to those in hospitals, care homes or other institutional settings. For the
week 29 November to 05 December, an average of 0.84% of the community
population had COVID-19 (95% credible interval: 0.57% to 1.17%). This equates to
approximately 1 person in every 120 (95% credible interval: 1 in 85 to 1 in 175), or
25,600 people during this time (95% credible interval: 17,300 to 35,600). The
positivity rate appears to have increased in the most recent two weeks, after falling
from a peak at the end of October (figure 1). It is important to stress the uncertainty
around these figures. Since the survey picks up relatively few positive tests overall,
the results can be sensitive to small changes in the number of these positive tests.

    The Covid-19 epidemic is growing in Wales with a deteriorating outlook (medium-
    high confidence).

    Changes in epidemic growth from the national implementation of level 3
    restrictions on the 4 December have not yet been observed. Any beneficial
    impacts on NHS demand will not be observed for at least one or two weeks.
    (medium confidence)

Figure 1. ONS Infection Study change in prevalence of covid-19 over time in four nations.

4

https://www.ons.gov.uk/peoplepopulationandcommunity/healthandsocialcare/conditionsanddiseases/bulletins/coronaviruscovid
19infectionsurveypilot/previousReleases

                                                             4
TAG ADVICE ONLY                                                                       NOT WELSH GOVERNMENT POLICY

Analysis of the weekly case estimates generated using PHW testing data alongside
ONS case estimates shows an increase in both data sets5. PHW data reflects new
cases detected (incidence) whereas ONS data is an estimate of all people testing
positive (prevalence) that week. Interestingly the ratio of ONS prevalence to PHW
seven day incident cases appear to have reduced over time, which may indicate a
higher rate of case acquisition from TTP, although it may also be related to time lags
and finding more cases outside of the community settings which aren’t covered by
the ONS study. This finding may chime with the relatively low rate of positive cases
found in asymptomatic testing in towns and universities in Wales and other nations –
possible evidence that a high proportion of positive cases are currently being
identified.
Table 1. PHW testing data and ONS Infection Survey case estimates.

                                                                                                                     ONS/PHW
                                                                                                                     Ratio
PHW         PHW         Cases per Testing      Testing     Positive             Cases per                            cases per
dates       cases       100k      episodes     per 100K    proportion ONS dates week      Lower CI      Upper CI     week
19-25 Oct        7394       234.5      45878        1455           16.1   17-23 Oct    26100    12600        47900         3.5
26-01 Nov        8661       274.7      43433        1377           19.9   25-31 Oct    27100    12200        50600         3.1
02-08 Nov        6501       206.2      42751      1355.9           15.2   31-6 Nov     35300    25500        46600         5.3
09-15 Nov        5379       170.6      40062      1270.6           13.4   8-14 Nov     18400    11700        26700         3.4
16-22 Nov        6063       192.3      48952      1552.6           12.4   15-21 Nov    16400    10500        23900         2.7
23-29 Nov        7302       231.6      54566      1730.7           13.4   22-28 Nov    18100    12100        25500         2.4
30-06 Nov       11298       358.3      67114      2128.7           16.8   29-5 Nov     25600    17300        35600         2.2

As illustrated by trends in the table above and figure below the number of tests per
week have increased by 68% between 9-15 Nov and 30 Nov-6 Dec, and by 46%
from 19-25 Oct to 30 Nov-6 Dec. This may indicate higher case ascertainment, but
might equally represent changes in testing in response to COVID incidence. Cases
are still increasing but some of the increase might be associated with increases in
testing. This might go some way to explaining why deaths have not increased as
quickly as cases, based on data of time lags from symptom onset to death (Low
confidence). Death registrations may also be delayed when the system is under
pressure.

Further analysis of TTP data may prove beneficial in order to better understand
these trends to understand why more people are seeking tests in the run up to the
Christmas period; but if people have to report symptoms to get tested then the data
may not be reliable.

    It is difficult to accurately estimate Rt values as behaviours in the run up to
    Christmas may be changing (e.g. proportion of symptomatic people seeking tests).
    However, there is evidence from test positivity increase, growth rate and doubling
    times that we are in a period of exponential growth (high confidence).

5
 https://public.tableau.com/profile/public.health.wales.health.protection#!/vizhome/RapidCOVID-19virology-
Public/Headlinesummary

                                                               5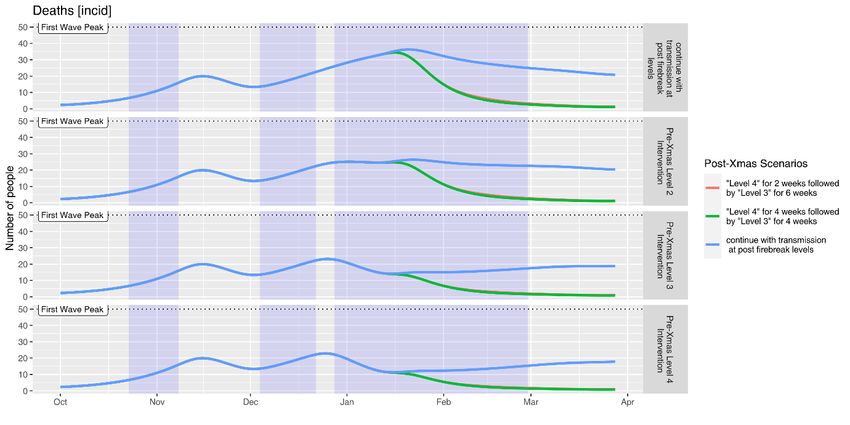
TAG ADVICE ONLY                                                                    NOT WELSH GOVERNMENT POLICY

Figure 2. Confirmed case rate adjusted for availability of tests.

       3. Recent trends in activity data
Data are available via Welsh Government commissioned survey research from Ipsos
MORI. The most recent Ipsos MORI data6 for the period 4 to 7 December for Wales
shows further reductions in some categories from the last survey, conducted a
fortnight earlier from 20 to 23 November. There were reductions in people making
essential trips only and avoiding non-essential travel compared to two weeks ago. It
should be noted that this is self-reported adherence and will be affected by
individuals’ understanding of the rules and the circumstances that apply to them.
Questions were also introduced recently regarding going into other people’s homes.
A quarter (23%) reported allowing someone from outside their household/extended
household into their home (similar to two weeks ago when first asked) – half of those
gave the reason as socialising (also up from a third (32%) two weeks ago).

6
    https://gov.wales/survey-public-views-coronavirus-covid-19-4-7-december-2020

                                                                6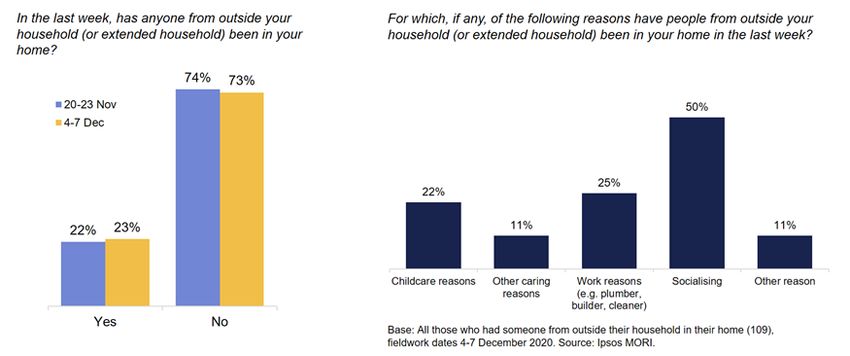
TAG ADVICE ONLY                                         NOT WELSH GOVERNMENT POLICY

One in five (18%) also said they had been in someone else’s home in the last week
(similar to two weeks ago) with 59% of those giving social visits as a reason (up from
44% two weeks ago). Note the relatively small sub-sample size relating to those
mixing in their own/others’ homes. Given this, the estimates should be interpreted
with caution.

It is also useful to look at public understanding as a potential contributor to
adherence, the above sources of data also providing information in relation to the
current restrictions in Wales. For example, Ipsos MORI data show around three in
four (75%) report being very or fairly confident that they understand current Welsh
Government guidance on what they should do in response to the Coronavirus,
although this reduces to half (53%) when respondents are asked how confident they
are, if at all, that the general public in Wales understands the same guidance. Note
these proportions are somewhat lower than when the same question was asked with

                                          7
TAG ADVICE ONLY NOT WELSH GOVERNMENT POLICY
reference to the recent firebreak (86% and 71%, respectively), in the wave
conducted from 6 to 9 November.
One in ten (9%) reported they had experienced one or more COVID-19 symptom in
the last week, though only two in five (44%) of these had requested a test. These
results have been consistent since they were added to the survey two months ago.
Again, note the care needed in interpretation given the small sub-sample size of
those reporting symptoms.
Data on a range of other mitigating behaviours included in the Ipsos MORI survey
since the spring can be found below.
Base: c. 500 adults in Wales aged 16-74 per wave. Source: Ipsos MORI.
The latest results from Public Health Wales’ Public Engagement Survey on Health
and Wellbeing during Coronavirus Measures7 for the period 30 November to 6
December show that one in three (36%) say they understand the current restrictions
in Wales ‘very well’. A further half (50%) reported understanding the restrictions
‘fairly well’. These results are reasonably similar to those presented above,
recognising differences in survey methods and timing. The results also show that two
in five (39%) report following coronavirus restrictions ‘completely’ and a further half
(50%) reported majority compliance. The percentage reporting ‘completely’ is lower
than the last survey (47%). One in three (35%) reported having people outside their
7
https://phw.nhs.wales/news/results-of-latest-public-engagement-survey-from-public-health-wales2/
8TAG ADVICE ONLY NOT WELSH GOVERNMENT POLICY
household/permitted extended household come into their house, whilst one in five
(21%) reported going into others people’s houses.
The potential beneficial impacts of higher alert levels, with regard to prevented
harm from COVID-19, will depend on the public’s willingness, understanding and
ability to adopt protective behaviours (e.g. not mixing between households).
4. Mobility
Mobility data provides rapid insights into the movement of the population. Whilst the
data does not demonstrate adherence, it is a useful measure of population wide
response to changes in restrictions. For example in the first week of the firebreak
mobility was at its lowest since May/June. The recent introduction of further
restrictions on hospitality, the closure of entertainment venues and indoor tourist
attractions has also resulted in reduced mobility – but not to the same extent as the
firebreak. The percentage of Facebook users staying put (i.e. staying at/close to
home all day) was 27.3% in the week after those restrictions were introduced, up
from 25.6% the week before – but below the 38.1% seen in the first week of the
firebreak (or the 33.2% in the second week). Previously very large reductions in
mobility have been followed by reductions in cases, as was the case with the first
lockdown and the firebreak and to a lesser extent the local lockdowns. It is possible
that smaller falls in mobility may not be followed reductions in cases. Other factors
not measureable through the mobility data such as household mixing and other
social distancing behaviours are not measureable through this data.
Following the introduction of the additional restrictions in hospitality, the closure of
entertainment venues and indoor tourist attractions from the 4 December there has
been a small reduction in mobility. It is most noticeable in the Google data for retail
and recreation which covers places like restaurants, cafes, shopping centres, theme
parks, museums, libraries, and movie theatres. It is not possible to determine which
of the additional controls has had a greater effect. The reduction in workplaces could
be due to establishments closing. The chart below shows the change in mobility for
retail and recreation and workplaces by day.
9TAG ADVICE ONLY NOT WELSH GOVERNMENT POLICY
From the current mobility and activity data it is unclear if the current policies
underpinning level 3 restrictions will have the desired impact on the growth of the
epidemic (medium confidence).
5. Christmas relaxation
It is difficult to estimate the likely impact of mixing over the Christmas period of
relaxation (23-27 December), however a central assumption of a 10% higher
background Rt is made in the policy modelling below, alongside greater
intergenerational mixing. Usually the SU model assumes an additional 10% reduced
mixing in older people in the background assumptions.
SPI-M-O modelling groups continue to consider the impact of the festive period on
transmission of SARS-CoV-2 and the impact of mass testing on secondary
infections. Three modelling groups considered mixing during the holidays and
suggest there could be changes in the age distribution of infections over a festive
period, specifically a slight shift towards a higher proportion of cases in older and
more vulnerable age groups. Preliminary analysis from one modelling group
suggested that if additional mixing is restricted to three households meeting per day
and to the five-day window of relaxations, the total number of days spent mixing may
have more of an impact on subsequent prevalence than exclusivity of the bubbles. .
Any reduction in the duration of mixing or the numbers who mix will reduce the risk of
transmission (high confidence). Exclusivity of bubbles was also highlighted as an
important factor in limiting risk (high confidence). There are important caveats to
10TAG ADVICE ONLY NOT WELSH GOVERNMENT POLICY
consider, including that households were assumed to have no symptomatic
infectious cases, childcare bubbles were not included and person-to-person
transmission only was considered (i.e. not transmission arising from other settings).
In addition, this modelling did not account for the adoption of pre-isolation strategies,
which would act to further reduce overall risk. Modelling from one SPI-M group
indicated that children mix less over the festive period (likely due to Schools closing),
whereas other age groups mix more, and especially the 16-25 year old age group.
Lessons learnt from winter celebrations elsewhere point towards a period of
increased transmission following an increase in travel and household mixing.
Reports suggest that both Thanksgiving in the U.S. (22 November) and Canada (21
October) led to periods of increased epidemic growth. The virus spreads through
mixing. If Christmas leads to substantial mixing we see an increase in infection.
(high confidence).
6. Short-term forecasts for hospital admissions
Public Health Wales has developed a short-term regression model to predict hospital
admissions in the following 12 days from current daily case numbers.
A lagged log-linear multi-lag regression model was used to predict hospitalisations
from non-hospitalised cases. Only confirmed community acquired hospitalisations
were included defined as a positive test results being obtained no more than 2 days
after admission. The predictor variables were the time lagged non-hospitalised case
counts and the outcome variable was the hospitalisation count. Both counts were
log-transformed and smoothed prior to model fitting. Time lags applied to the non-
hospitalisation counts covered a window of 12 to 50 days (in 1 day increments,
covering a total of 38 days). This window was identified as optimal based visual
inspection of multiple model fits with lag windows ranging from 1 to 50 days. The
lower limit of this window being the number of days we can forecast (the most recent
two days of data were excluded due to incompleteness). The entire time series of
11TAG ADVICE ONLY NOT WELSH GOVERNMENT POLICY
non-hospitalised case counts were used to fit the model, except the first 50 days
which could not be fitted. The model was then used to predict hospitalisation counts
up to 12 days into the future (up to 23th Dec). The model covers all of Wales and all
age groups.
The plots shows data for hospitalisation counts (red), the prediction made by the
model (light blue) and the forecast with error margins (dark blue).
This model predicts a rise of daily hospital admissions of around 50%, from 40
(current) to 60 per day, by 23 December.
7. Modelling assumptions
The Swansea University model was used to consider the impacts of alert levels. The
assumptions that informed the model are listed below. The model is age stratified so
hospital admissions increase when there is more transmission in older people.
The background Rt value for Wales, as measured by the fit of the model on 1st
December, is 1.3 – in reality this is likely to fluctuate. This assumes some long-term
level of social distancing because the R0 for covid-19 is over 2.5, and there is still a
large susceptible population. The background Rt is a national figure where regional
variation, both higher and lower, exists. A full month has passed since the Firebreak
ended on the 9 November. The numbers of cases, admissions and deaths since
then are consistent with a return to pre-firebreak transmission rate, or slightly lower.
Since then there has been an incremental increase in prevalence, but not an
immediate rebound. If the firebreak had caused a rebound to a relatively higher Rt
value, it would likely have been noticed by now in greater case and admission levels.
12TAG ADVICE ONLY NOT WELSH GOVERNMENT POLICY
The maintenance of consistent, or slightly lower Rt values, may have been assisted
by peripheral impact of the Lockdown in England and bordering counties; however, it
is difficult to assign causality, and uncertainty in current Rt remains.
We consider 3 intervention scenarios, with assumed approximate Rt values defined
in comparison to the background Rt estimate in the post firebreak period of 1.3 on
the 1st December. Rt levels are guided by experience of the analysis of Tier effects in
England, and of the estimated large effect of the firebreak in Wales.
Alert Level two (medium risk) – modelled Rt 1.15 for period of level - some impact
on growth of epidemic, not enough to bring the Rt value below 1. Includes additional
controls to limit the spread of coronavirus. These may be complemented by more
targeted local actions to manage specific incidents or outbreaks. (low confidence)
Alert level three (high risk) – modelled Rt 0.95 for period of level - -represents the
strictest restrictions short of a firebreak or lockdown. This responds to higher or
rising level of infections where local actions are no longer effective in containing the
growth of the virus. (low confidence)
Alert level four (very high risk) – modelled Rt 0.85 for period of level - Restrictions
at this level would be equivalent to the firebreak regulations or lockdown. These
could either be deployed as a preventative firebreak or as a lockdown measure.
(high confidence)
During the first firebreak schools were closed for the first week (half term), primary,
years 7 and 8 returned in the second week with at home blended learning for older
age groups during the second week (years 9-13 and FE). During the first firebreak,
multiple analyses have shown that Rt may have dipped to a as low as 0.7 to 0.75
during the first week, making it one of the most effective measures in reducing
transmission in the UK since the first lockdown.
For the purpose of this paper, health and NHS impacts are calculated to the end of
February 2021 for consistency. It should be noted that the background scenario
leads to fewer cumulative deaths, hospital and ICU admissions in this analysis
(2,422, 7232, 986) compared the recent analysis (2,516, 8,569, 1,028) over the
same period8. This is in part due to a shorter period of Christmas mixing assumed in
this paper, in line with the UK wide announcement and the stochastic nature of the
model9. It should also be noted that the background scenario is not fully unmitigated,
as this would require a scenario with R0 ~ 2.5, and would result in a great deal more
events due to the exponential nature of the epidemic process. (high confidence)
The continued measurement and analysis of the impacts of different levels will be
important to guide future restrictions and relaxations of measures.
8
https://gov.wales/sites/default/files/publications/2020-12/technical-advisory-group-statement-regarding-non-pharmaceutical-
interventions-in-the-pre-christmas-period.pdf
9
https://www.ispor.org/heor-resources/good-practices-for-outcomes-research/article/model-parameter-estimation-and-
uncertainty-analysis
13TAG ADVICE ONLY NOT WELSH GOVERNMENT POLICY
Finally, the models assume that the NPIs have the desired impact on restricting or
reducing mixing and transmission of the virus between people. There are a great
many variables that could influence transmission that are not accounted for in these
models (e.g. public compliance with regulations, such as mixing between household
in residential settings). In the future there may be an opportunity to include models
for different levels of adherence to NPIs.
a. Modelling Scenarios
Pre-Christmas: 4th to 22 December
L1 = continue with transmission at post firebreak levels Rt 1.3
L2 = Level 2 intervention Rt 1.15
L3 = Level 3 intervention Rt 0.95
L4 = Level 4 intervention Rt 0.85
Post- Christmas: 28th Dec to 28 Feb
L1 = continue with transmission at post firebreak levels Rt1.3
Level 4 (Rt0.85) 2 weeks and Level 3 (Rt 0.95) 6 weeks
Level 4 (Rt0.85) 4 weeks and Level 3 (Rt 0.95) 4 weeks
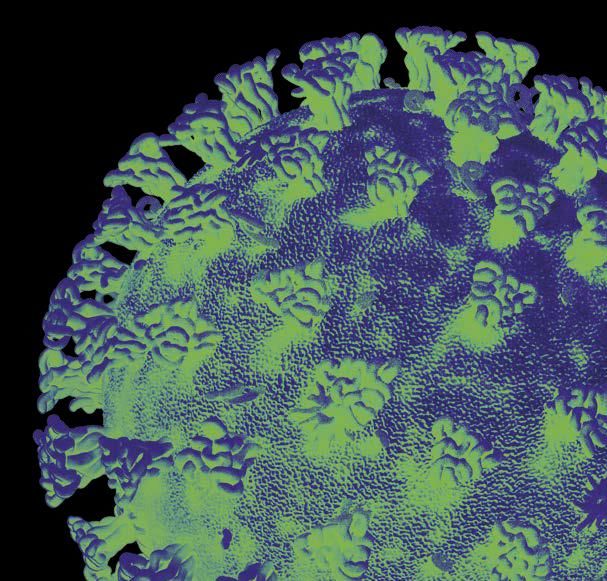
8. Modelling Results
The Figures below show the modelled effects of 12 different pre-Christmas and post-
Christmas policy scenarios. Each of the scenarios can be read from left to right, from
the recent date of 4 December, to the start of the period of reduced restrictions 23
December, up until the end of the post-Christmas period of reduced restrictions 28
December. The results do not extend after the 28 February, conditions thereafter
could significantly change the modelled outcomes (e.g. relaxation would increase
transmission). The red section of the line indicates additional mixing during the
Christmas period, estimated to result in a further 10% additional transmission.
For example, in the first ‘No intervention’ scenario, where the background Rt is
assumed to be 1.3 (4 December), the cumulative number of COVID-19 patients
requiring hospital and ICU beds is estimated to be 7,232 and 986 respectively, with
2,422 deaths.
Christmas mixing is likely to lead to a measurable increase in NHS demand and
reduction in NHS and social care capacity in the New Year (high confidence).
14TAG ADVICE ONLY NOT WELSH GOVERNMENT POLICY
In the fourth row ‘Level 2’ pre-Christmas intervention, which is estimated to reduce
Rt down from the background Rt of 1.3, but only 1.15, the cumulative number of
hospital and ICU beds is estimated to reduce to 6,066 and 827 respectively, with
2,034 deaths.
In the seventh row ‘Level 3’ pre-Christmas intervention, which is estimated to bring
Rt down from the background Rt of 1.3, to below 1 (0.95), the number the cumulative
number of hospital and ICU beds is estimated to reduce to 4,420 and 603
respectively, with 1,514 deaths.
The maximum number of reductions in the cumulative number of hospital and ICU
beds would result from both pre and post-Christmas level 4 conditions and could
prevent the loss of 1,400 deaths, 670 ICU beds and five thousand hospital
admissions.
Figure 3. Modelling scenarios from 2 Dec 2020 to 28 Feb 2021, with cumulative hospital and ICU occupancy and deaths.
Source: Swansea University Policy Model
15TAG ADVICE ONLY NOT WELSH GOVERNMENT POLICY
9. Behavioural context of policy modelling
The analysis presented in the paper assumes there will be population adherence to
the restrictions in place that underpin the modelled policy scenarios. However, as set
out in the recently published Coronavirus control plan, the current picture with regard
to behaviours is complex10. It is important to recognise many people have made
great efforts to adhere to the restrictions in place throughout the course of the
pandemic and continue to do so11. There are numerous potential explanations for
non-adherence, such that simply looking at the actions of individuals when
attempting to understand increasing rates of infection is not helpful or justified.
Evidence from various sources suggests the majority of people continue to report
practising key personal protective behaviours, including social distancing and hand
hygiene. However, these data sources also provide evidence that indicates a degree
of non-adherence elsewhere that needs to be considered, notably in terms of mixing
with people not in the same extended household, alongside some misunderstanding
of the risks of transmission associated with meeting others.
Public Health Wales data12 also provide a sense of people’s plans for the festive
period, with two in three (66%) reporting plans to have visitors to their home or visit
other people’s homes over the period 23-27 December and just under half (45%)
intending to form a Christmas bubble. Around half (53%) reported changes being
made to restrictions over Christmas being about right, while 31% would prefer tighter
restrictions and 15% more relaxed restrictions. It should be noted, however, that in
light of the continued growth in infections since these data were collected, alongside
increasing public debate about the proposed arrangements13, it is possible these
proportions may have changed. With the increased likelihood of social mixing and
rates of transmission, it will be as important as ever to mitigate the impact as far as
possible14.
10. Preliminary Health Economic analysis of scenarios
A preliminary economic analysis of scenarios was carried out. This included
estimated costs of covid-19 hospital and ICU admissions, a conservative estimate of
the cost of covid-19 deaths, estimates of quality-adjusted life years (QALYs) lost
from Covid community cases, covid hospital admissions and deaths, and a very
conservative (low end estimate) of the QALYs lost from long covid. The true costs
and QALYs lost from COVID-19 are likely to be higher than these estimates as they
do not include post-hospital rehab, the likely full implications of multi organ damage,
productivity or informal care costs. The indirect opportunity costs for people whose
10
https://gov.wales/coronavirus-control-plan-alert-levels-wales
11
https://blogs.bmj.com/bmj/2020/10/26/the-concept-of-fatigue-in-tackling-covid-19/
12 https://phw.nhs.wales/news/results-of-latest-public-engagement-survey-from-public-health-wales2/
13 https://www.bmj.com/content/371/bmj.m4847.full.print
14 https://www.gov.uk/government/publications/emgspi-b-mitigating-risks-of-sars-cov-2-transmission-
associated-with-household-social-interactions-26-november-2020
16TAG ADVICE ONLY NOT WELSH GOVERNMENT POLICY
NHS treatment is delayed because of treating COVID-19 patients is not included.
There are likely to be lots of complex dynamic effects that are difficult to predict.
Even for the costs and QALYs we have included, there is likely to be a large degree
of uncertainty. The costs and QALYs are estimated for the population as a whole,
however we know that direct covid harms are highly likely to be experienced more by
people of low socioeconomic position, but that indirect harms are also likely to be
unequally distributed as well.
The net cost savings plus value of QALYs gained was combined with estimates from
Welsh Treasury of potential GVA loss from different types of restrictions. This gives
an indication of net benefit associated with different scenarios – however this is likely
to be a very incomplete and uncertain analysis but is presented here in case it
should aid decision making despite this uncertainty.
Most of the scenarios have a negative net monetary benefit in this analysis – the
GVA impacts are bigger than the value of health benefits. However there are other
costs and benefits that are only partially accounted for. The estimate of “GVA”
impacts is highly uncertain, but it is highly likely the GVA loss would be larger than
this. In addition to this GVA loss there will of course be the wide range of other socio-
economic harms which are even harder to quantify.
Table E1. Cost savings and QALYs gained compared with Level 000001 where Rt
stays at around 1.3. Results from 1st Dec - 28th Feb. All scenarios assume relaxing of
restrictions from 23rd - 27th December. All figures reflect a range of assumptions and
are therefore heavily rounded.
Incremental Incremental
net monetary net monetary
benefit benefit "GVA" loss Net value
valuing valuing from 15 (m) with
HC cost QALYs QALYs at QALYs at December QALYs at
Scenario Description savings (m) gained £60k (m) £30k (m) (m) £60k
L1_L1 Level 1 from Dec - Feb (Rt around 1.3)- comparator £0 0 £0 £0 £0 £0
L1_L42wL36w Level 1 until 22nd Dec, level 4 for 2 weeks from 28th Dec, then level 3 for 6 weeks £30 6,000 £360 £200 -£500 -£140
L1_L44wL34w Level 1 until 22nd Dec, level 4 for 4 weeks from 28th Dec, then level 3 for 4 weeks £30 6,000 £370 £200 -£600 -£230
L2_L1 Level 2 until 22nd Dec, level 1 from 28th Dec £10 3,000 £190 £100 -£60 £130
L2_L42wL36w Level 2 until 22nd Dec, level 4 for 2 weeks from 28th Dec, then level 3 for 6 weeks £40 8,000 £490 £260 -£550 -£60
L2_L44wL34w Level 2 until 22nd Dec, level 4 for 4 weeks from 28th Dec, then level 3 for 4 weeks £40 8,000 £500 £270 -£650 -£150
L3_L1 Level 3 until 22nd Dec, then level 1 from 28th Dec £30 7,000 £440 £240 -£150 £290
L3_L42wL36w Level 3 until 22nd Dec, level 4 for 2 weeks from 28th Dec, then level 3 for 6 weeks £50 10,000 £650 £350 -£650 £0
L3_L44wL34w Level 3 until 22nd Dec, level 4 for 4 weeks from 28th Dec, then level 3 for 4 weeks £50 10,000 £660 £350 -£750 -£90
L4_L1 Level 4 until 22nd Dec, then level 1 from 28th Dec £30 8,000 £520 £280 -£300 £220
L4_L42wL36w Level 4 until 22nd Dec, level 4 for 2 weeks from 28th Dec, then level 3 for 6 weeks £50 11,000 £700 £370 -£800 -£100
L4_L44wL34w Level 4 until 22nd Dec, level 4 for 4 weeks from 28th Dec, then level 3 for 4 weeks £50 11,000 £700 £380 -£900 -£200
11.Conclusions
As modelled previously, and now observed, we are currently in a period of sustained
epidemic growth. This is due to relaxation of restrictions following the first firebreak
and more population mixing. The scenarios within this paper consider the potential
impacts of a pre and post-Christmas levels to control growth of the epidemic. As
discussed previously earlier intervention prior to a period of exponential growth (e.g.
firebreak) has greater impacts in the short term than interventions after epidemic
growth has been observed. Short-term forecasts indicate a likely 50% increase in
daily hospitalisations by 23rd December, based on current case trends.
17TAG ADVICE ONLY NOT WELSH GOVERNMENT POLICY
This policy modelling analysis is helpful as it illustrates the potential benefits in terms
of reduction in deaths, NHS occupancy and ICU bed for levels 2, 3 and 4 scenarios
in the pre and post-Christmas period. Unlike the previous pre-Christmas analysis,
this paper only considers one background Rt (1.3). As shown in the earlier paper, an
increase in background Rt of 0.1 can have significant effects on all outcomes. Even
so, this analysis shows that if realised, the impact of level 3 or level 4 restrictions in
the pre-Christmas period could prevent the loss of significant numbers of lives from
COVID infection.
Reduction in epidemic growth from levels 2, 3 or 4 in the pre-Christmas period could
reduce the maximum occupancy level of both hospital and ICU beds. Levels 3 and 4
could reduce hospital demand sooner than level 2.
The two post-Christmas scenarios of either two or four weeks in level 4, followed by
either 6 or 4 weeks level 3, respectively, yielded strikingly similar results, though it
should be noted that the assumed Rt was similar in both cases. Both scenarios could
result in similar reductions in deaths and hospital admissions. A further scenario in
between Rt = 0.95 and 1.15 could be instructive to investigate. As described earlier
there is greater confidence in the Level 4 reduction in Rt as this has been observed
in the firebreak, until further data is collected on the Level 3 restrictions in Wales it
would not be advisable to use the modelling to set dates for transitioning from Level
4 to Level 3.
Given the significant changes in population mixing and behaviours in the pre and
post-Christmas period (e.g. return of university students) alongside new and existing
restrictions (e.g. blended learning, hospitality and Christmas event closures) there is
a high degree of uncertainty in the outcomes of the models. The observed data
trends may be quite different from those that have been modelled. In particular, the
public response to restrictions is difficult to predict, both overall and in the likely
heterogeneity between people and places. Additionally, the recent identification of a
variant SARS-CoV-2 may change the transmission dynamics. However, to date the
models have provided a very clear and reliable indication of the epidemic’s
behaviour in Wales. Evidence from other winter celebrations (e.g. Thanksgiving)
suggests that a period of household mixing could increase growth of the epidemic.
Polling data also suggest a considerable number of families in Wales will meet with
other households to celebrate Christmas.
While the immediate post firebreak Rt value is fairly well defined, the impacts, if any,
from very recent restrictions on the growth of the epidemic are not yet clear. From
past NPIs, changes in growth rates were observed after 10 days, one clear
generation period. Hence, at present, all model scenarios track the observed data
reasonably well and we cannot yet distinguish between them. Wales could
realistically be on any of the 4 main trajectories. If the restrictions currently in place
impact on Rt this could be revealed in the trends in the data observed from the week
commencing 14 December.
18TAG ADVICE ONLY NOT WELSH GOVERNMENT POLICY
This tracking can be used not only to identify the more likely scenarios, but also
inform how different measures could have an impact in the post-Christmas period.
This tracking is especially important to determine whether level 3 restrictions are
sufficient to reduce Rt below 1. If this is revealed not to be the case, then the small
differences in the model scenarios between level 3 and 4 would be amplified, with
level 3 scenarios having a reduced impact.
The closure of schools for a period of blended learning could have positive impacts
on Rt if people do not mix between households in the run up to Christmas. Also, if
behaviours change and more symptomatic people take tests and isolate for 10 days
on symptoms, this could have a significant impact on the epidemic in Wales. From
Ipsos data fewer than half of those displaying one of the three recognised symptoms
seek a test. Many people who test positive have no symptoms at the time of testing.
A 10 day period of pre-isolation before meeting older family member would be one
way of reducing risk of transmission between households.
Immediate level 4 type restrictions in the pre and post-Christmas period would likely
lower the epidemic’s growth and associated health impacts. Alongside more risk
communication about ‘not mixing’ additional measures that could be considered
include greater working from home, avoidance of mixing in Christmas sales, stay
local advice. In all scenarios there is an expected period of epidemic growth post-
firebreak that is reflected in the data. Given this background level of transmission will
inevitably require restrictions then it should be considered at what level of prevalence
is COVID-19 to be controlled? It is expected in the model scenarios that the later, or
less effective measures will all result in a sustained period during which hospital
occupancy is above current levels.
The current growth in the epidemic combined with Christmas mixing is likely to
lead to a substantial increase in NHS demand and reduction in NHS and social
care capacity in the New Year (high confidence).
The preliminary health economic analysis suggests that long periods of level 4 may
cause considerable socioeconomic harm which counterweights the health benefits.
This suggests that any move to level 4 should be kept under review, for instance
weekly, and considered in the context of socioeconomic harms as well as indicators
of covid transmission and related harm. However, the assumed benefits of level 3
would have to be confirmed (by monitoring the pre-Christmas period), and there
would need to be considerable confidence that the Rt value could be maintained
below 1. As we build up a better picture of the harms associated with covid-19, an
assessment of the balance of costs and benefits may change. In particular, more
evidence around the prevalence and typical syndrome for long covid may change the
estimated magnitude of benefits from preventing virus transmission.
19TAG ADVICE ONLY NOT WELSH GOVERNMENT POLICY
APPPENDIX.
COMPARISON OF MODELLED SCENARIOS AND IMPACT ON TRENDS IN DEATHS, ICU OCCUPANCY AND NON-ICU OCCUPANCY.
20TAG ADVICE ONLY NOT WELSH GOVERNMENT POLICY
21TAG ADVICE ONLY NOT WELSH GOVERNMENT POLICY
22You can also read