Technical Advisory Group - Policy modelling update 5th May 2021 - GOV.WALES
←
→
Page content transcription
If your browser does not render page correctly, please read the page content below
Technical Advisory Group
Policy modelling update

5th May 2021

© Crown copyright 2021
Policy modelling update 5th May 2021
Welsh Government COVID-19 TAG Policy Modelling Subgroup
1. Summary
This paper explores the results of policy modelling carried out by Swansea
University to understand possible futures around the coronavirus pandemic in
Wales.
The epidemiological models have produced estimates of infections and direct
COVID-related harms until the end of March 2022.
Overall, the modelled scenarios suggest that it is likely cases, hospitalisations
and deaths will increase in the second half of 2021 as restrictions are eased.
So far in 2021, it is likely that restrictions and public responses have had an
impact in reducing transmission of the virus and reducing hospital admissions
and deaths. As we move into the next phase, the vaccination programme will
have to do more of the ‘heavy lifting’ in preventing COVID-19 harms.
Evidence is emerging suggesting that vaccines are preventing onward
transmission which means the number of cases, based on current variants in
circulation in Wales, is likely to be smaller than previously experienced.
However, there is still uncertainty about duration of effectiveness of available
vaccines and plans for booster vaccinations.
It is likely that future outbreaks will occur in children and young people who
have more contacts and have not been vaccinated, so in future it may be
useful to consider what level of virus transmission is acceptable if
vaccinations are keeping hospitalisations and deaths low.
Key uncertainties are: the level of adherence to social distancing and other
restrictions; the impact of vaccines on transmission; the impact of new
variants; and, the possibility of waning immunity.
This paper shows how the dominant B117 variant would have produced a
much worse peak had it been the dominant variant in the first wave (Appendix
2).
The current modelled scenarios do not include the impact of antigenic drift or
waning immunity; so are likely to be robust for the next few months, but
further evidence is likely to be established in advance of Winter 2021/22.
The main issues that could cause a significant resurgence of COVID-19
harms are: widespread transmission of a vaccine escape and/or immune
escape variant; a breakdown in social distancing behaviour; or to a lesser
extent, a change in vaccine supply or significant drop in vaccine uptake. New
2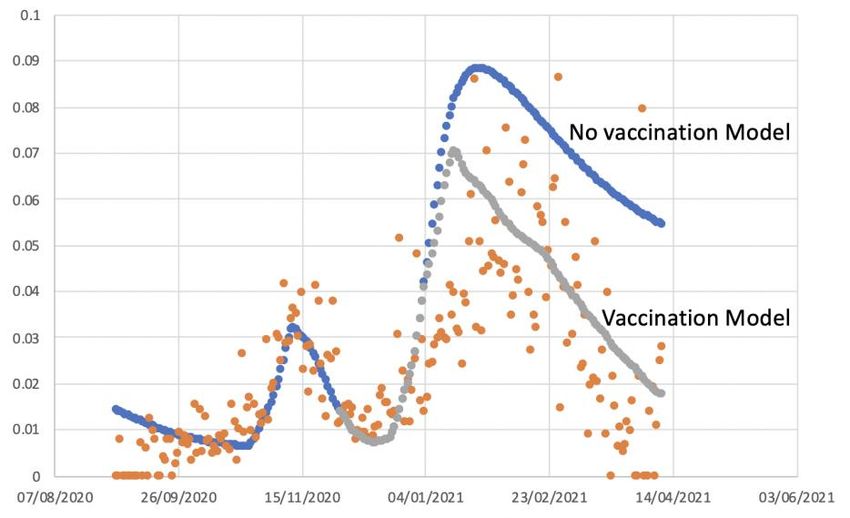
variants also need to be monitored for differential impacts, for instance on
children.
As the vaccine roll out continues, the horizon looks more positive in terms of
expecting lower numbers of COVID-19 deaths than were observed in
November 2020 – February 2021.
Continued surveillance of infections in schools, supply, uptake and
effectiveness of vaccines, and impact and spread of variants is crucial in
helping to understand what trajectory Wales is following in terms of the
pandemic and in fine-tuning future policy formulations to deal with the
pandemic while reducing other health, educational and socioeconomic harms
and inequalities.
3
2. Objective
The objective of this paper is to examine scenarios for COVID-19 in Wales from April
2021-March 2022, which include different assumptions around the impact of new
variants, impacts of vaccine efficacies and individuals’ ability to continue to follow
restrictions and to continue to adopt protective behaviours (labelled in this paper as
“adherence”).

    3. Background
Wales went into Level 4 restrictions on 20th December 2020 following the
identification of the new Variant of Concern 202012/01, increasing rates of confirmed
COVID case rates, and pressure on the NHS.1 Over 57% of the population of Wales
have now received one dose of a vaccine. This includes over 95% of over 80 year
olds and more than 85% of 50-54 year olds, the final group in the top nine priority
groups Welsh Government targeted, and achieved, to offer a first dose of the
vaccine to by 15th April 2021. This is expected to lead to a reduction in
hospitalisations and deaths in vaccinated groups.

The case rate as of 22nd April 2021 for Wales is 12.2 confirmed cases per 100k (7
day rolling), and positivity has also fallen below 1.4% after peaking at over 25%. In
addition, prevalence is 0.11% (as measured by the ONS COVID Infection Survey in
the week to 10th April 2021) and antibody prevalence was 61.0% in the week to 11th
April 2021 (as measured by the COVID Infection Survey), indicating that a high
proportion of people have antibodies present either following natural infection or
vaccination.

    4. Evidence Summary
The latest information about the COVID-19 situation in Wales can be found on the
Welsh Government website.2

    5. Updated modelling scenarios from Swansea University
Swansea University produced a range of modelled scenarios (72 in total) for the time
period up to end of March 2022. The methods have been described previously. 3

Level of restrictions in place across Wales
The Welsh Government has set out four alert levels for public response to threat
levels that require measures designed to control the spread of the virus and protect
people’s health.4 Wales has been in Level 4 restrictions since 20 December 2020,

1 Written Statement: Alert level four restrictions
2 Technical advisory Cell: summary of advice 2 April 2021
3 https://gov.wales/sites/default/files/publications/2021-03/technical-advisory-cell-modelling-update-

12-february-2021.pdf
4 Coronavirus Control Plan: Alert levels in Wales (14 December 2020).

                                                   4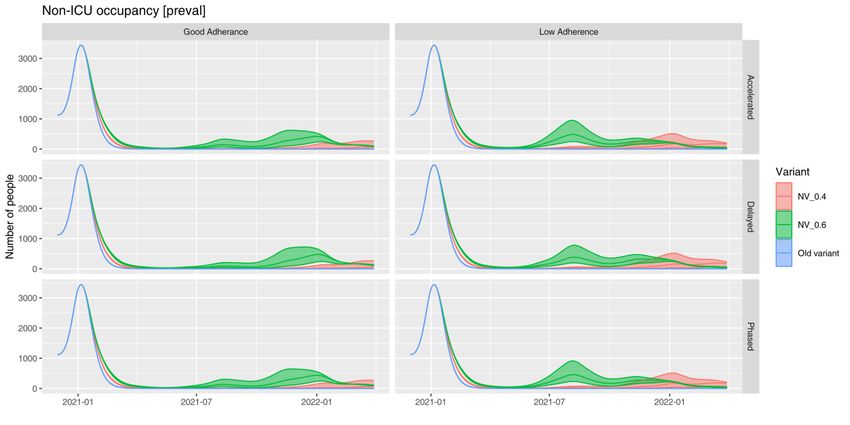
although restrictions have been slowly easing to move Wales from Level 4 to Level 3
by 3rd May 2021, subject to public health conditions remaining favourable5. Three
scenarios are modelled in this paper which assume the level of restrictions in place
across Wales would be:
Scenario 1 (accelerated):
From 12 April = schools return plus low risk bits of alert level three
From 3 May = full move to alert level three
From 24 May = move to alert level two
From 28 June = move to alert level one
Scenario 2 (delayed):
From 12 April = schools return plus low risk bits of alert level three
From 10 May = move to alert level three
From 14 June = move to alert level two
From 19 July = move to alert level one
Scenario 3 (phased):
From 12 April = schools return plus low risk bits of alert level three
From 10 May = move to alert level three
From 24 May = move to alert level 2.5 (in between three and two)
From 31 May = move to alert level two
From 28 June = move to alert level one
In all scenarios it was assumed that a complete return to normal contact behaviour
would not occur over the time period. Instead, it was assumed that a level of contact
behaviour half-way between level 1 and completely normal (level 0.5) was set from
1st August 2020 until the end of the simulations.
Effectiveness of vaccines
The scenarios modelled in this paper all set out a range of possibilities for how
effective vaccine is against infection and clinical events: either 65%, 80%, or 95%
effective. This is represented in each figure by a band representing the lower,
central, and upper estimates for cases, hospitalisations, ICU occupancy and deaths
in each model. This range of vaccine efficacy levels was chosen to reflect general
‘low’, ‘medium’ and ‘high’ efficacy scenarios based on current knowledge. There
remains considerable uncertainty on the vaccine efficacy in the population across
different events (infection, transmission, hospitalisation, deaths), how these change
between first and second doses, and on age-specific vaccine efficacies. Our
efficacies are chosen to represent averages across these parameters, using the first
dose roll out as the time point of vaccination, plus a two week delay before the
5 Further coronavirus restriction relaxations brought forward (22 April 2021)
5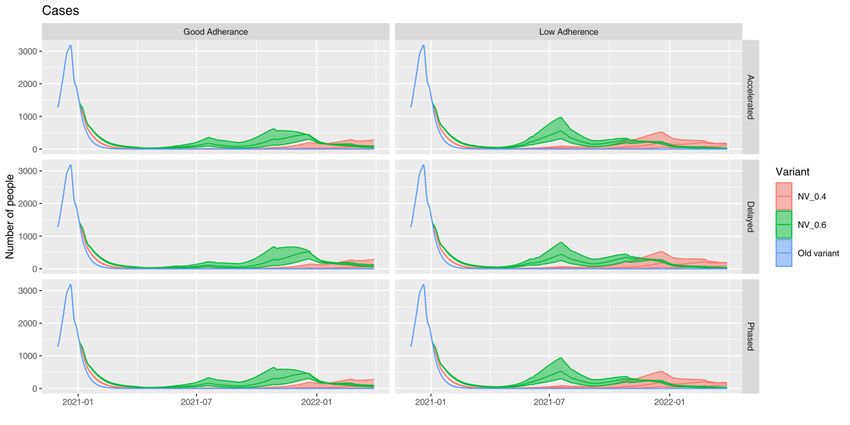
vaccine effects occur. Evidence is emerging on these parameter values, and the
model will be updated to include more detailed vaccine effects when they are clear.
The policy modelling has been updated to reflect the differing uptake rates across
age bands:
95% for over 65s (observed)
85% for 50-64 (observed)
70% for 40-49 (assumed)
60% for 30-39 (assumed)
50% for under 30 (assumed)
Levels of ‘adherence’
Each of the scenarios modelled in this paper is presented twice, side-by-side. The
‘adherence’ levels in these scenarios are modelled on the assumption of both:
‘Good adherence’ (where ‘adherence’ is at a level equivalent to what was
seen during the autumn firebreak in Wales)
‘Low adherence’ (where ‘adherence’ is at a level equivalent to what was seen
during December 2020 in Wales). In this analysis, low or good adherence is in
reference to individual’s numbers of contacts, which may change as a result
of motivation to comply, but also depending on ability to comply, for instance if
workplaces require them to return to working on-site. So it is not only about
adherence with the rules, but also how many contacts people are having
which may still be within the rules. We know that so far in the pandemic,
adherence has been high and there has been a huge collective effort to
reduce contacts, take precautions (such as meeting outside, wearing face
covering, handwashing, etc) and control the virus. In these scenarios, good
adherence is similar to the reduction in contacts seen in the October 2020
firebreak, while low adherence is more like the number of contacts seen in
December 2020.
Impact of Variants
The main outputs centre on the B117 variant (termed NV_0.6 and shown in green in
the figures). This variant arose in November 2020 and quickly became dominant
across the UK. B117 was estimated to add approximately 0.6 to Rt, as compared to
a baseline Rt = 1.3. (Note that the magnitude of the additive effect changes with the
transmission dynamics and control measures in place over time, and is equivalent to
an approximate R0 of 4.3). For comparison, the ‘old variant’, representing the virus
transmission dynamics prior to December 2020, is shown (blue lines), illustrating the
considerable increase in impact of the B117 variant. An intermediate variant, NV_0.4
6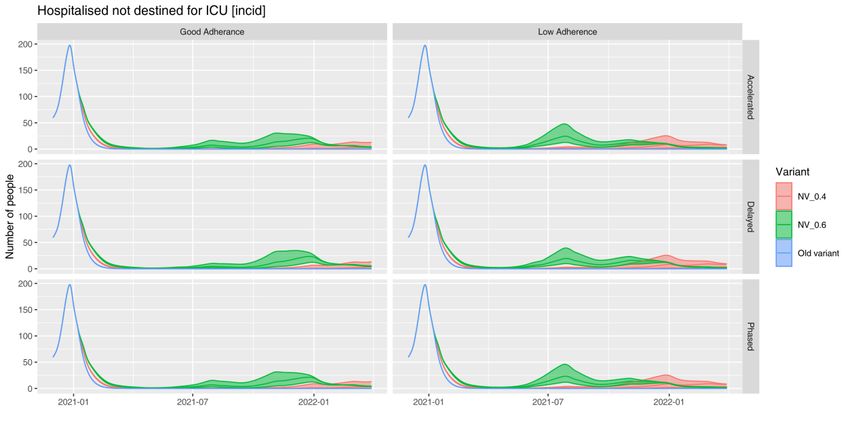
is also shown (red lines) for comparison, for which the variant adds 0.4 to the Rt
number as observed in November (compared, again, to baseline Rt = 1.3).

Current analysis from England still suggests that the dominant Kent B.117 variant
may add around 0.4 to 0.7 to the Rt number compared with the wild type variants,
but this would be if the new variant was 100% of cases, and the background R 0 in
Wales may be slightly lower than in England because Wales has more people in
rural areas, so 0.6 is considered to be a sensible high value to use in the modelling.
The increased R0 of the B.117 variant is reflected in the fact that it is has quickly
become dominant around the world.6,7 Other variants of concern may have
increased infectivity or be more likely to escape vaccines.

      6. Results Summary
All model scenarios predict an increase in cases in the second half of 2021. For
B117 the models predict a peak between May 2021 and September 2021. If the ‘new
variant’ effect contributes only 0.4 to the Rt number, then the models predict a small
rise in cases from November 2021. All scenarios with the wild type variant indicate
that subsequent peaks are unlikely (at least under the assumption that there is no
waning immunity over the period).

These scenarios suggest that levels of adherence to restrictions and the
transmissibility of the Variant of Concern (VOC) have the greatest impact on the
number of cases, hospitalisations and deaths, with a smaller contribution from
vaccine effectiveness. This aligns with the previous model scenarios from which the
current MLS and RWC were obtained, in which levels of adherence made the
greatest impact to the number of transmissions.

If adherence to restrictions falls, then there may be a larger resurgence of the virus
around May-June time, especially under the B117 scenario. Given that the peaks in
hospital cases and deaths for those scenarios with the least optimistic assumptions
come at least 2 months after moving to Level 3, this would in a real-world scenario
allow some opportunity to re-impose more stringent restrictions at an early stage if
data indicated that cases were following such a trajectory. As such it indicates the
importance of carefully monitoring key indicators and reacting swiftly if needed.

It is clear that the impact of new variants, vaccine efficacy and ‘adherence’ are large,
and even the most pessimistic scenarios do not see as many deaths as have
happened over the winter period.

Figures 2A, 2B and 2C compare the model-estimated deaths with the current
Reasonable Worst Case (RWC), Most Likely Scenario (MLS), and actual deaths
reported by ONS and PHW. Figures 3A, 3B and 3C compare the model-estimated

6   https://www.reuters.com/article/us-health-coronavirus-germany-variants-idUSKBN2AX0RV

7   https://www.who.int/publications/m/item/weekly-epidemiological-update-on-covid-19---13-april-2021

                                                   7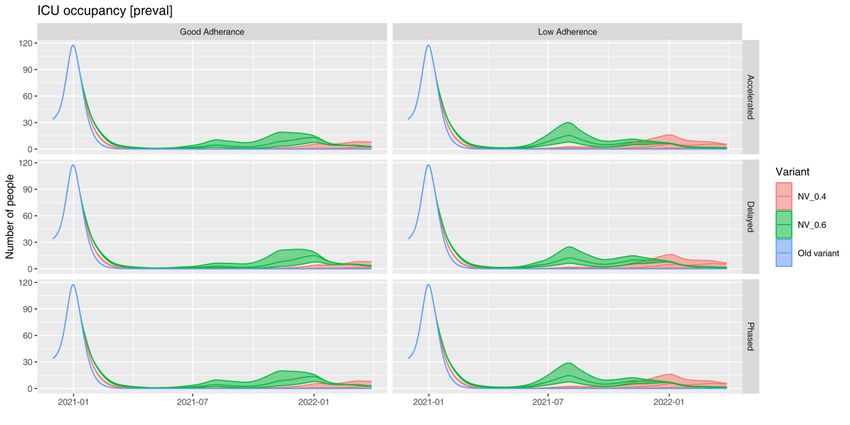
admissions with the current RWC, MLS, and actual admissions reported by PHW.
From these charts, it is clear that none of the models are likely to follow the current
RWC and all estimate significantly lower deaths than the MLS assuming “good”
adherence up to end of June 2021. The current RWC predicts a peak around
May/June 2021. The reason for the differences include:
Previous RWC included some more pessimistic vaccine efficacy assumptions
Current vaccine roll out has outpaced assumptions (rate of first dose roll out
has not decreased alongside second dose delivery)
Previous RWC included potential Low adherence scenarios over February
and March, which are now considered unlikely
Consequently, the most recent policy modelling scenarios estimate a peak around
July/August 2021 and of lower magnitude than the current RWC. We therefore
recommend updating the current RWC and MLS.
Tables 1A, 2A and 3A show the total symptomatic cases (in future labelled as
“cases”), deaths, admissions and ICU admissions between the 1st April 2021 and
30th June 2021 predicted for each scenario. For all scenarios, the number of cases
and deaths reduce as vaccine efficacy increases or adherence to restrictions
improves.
Tables 1B, 2B and 3B show the daily peaks of COVID-19 cases, deaths, admissions
and ICU admissions between the 1st April 2021 and 30th June 2021 predicted for
each scenario. For all scenarios, the maximum number of cases and deaths reduce
as vaccine efficacy increases or adherence to restrictions improves.
The total number of COVID-19 cases and deaths was lowest under the delayed
approach.
Interpretation – new Reasonable Worst Case and Most Likely Scenario
These model results do not include waning immunity or antigenic drift, so should be
interpreted with caution over a longer time horizon. It may be that we see some
resurgence of the virus in Winter 2021-22 due to waning immunity, due to virus
mutations or recombination, or due to low uptake of the vaccine in younger age
groups combined with increased contacts.
The current reasonable worst case (RWC) has a peak that may happen in May
2021, which is very unlikely with the low incidence we are seeing now. The RWC still
exists as a planning scenario that is meant to be pessimistic but plausible, not what
we think will happen. We therefore propose the RWC scenario to be the most
pessimistic of these scenarios: vaccine 65% effective, “low” adherence, accelerated
release of restrictions, and B117 variant Rt number.
At the same time, we can update the Most Likely Scenario (MLS) with more recent
data. We consider that the new MLS is likely to be the following: “good” adherence of
8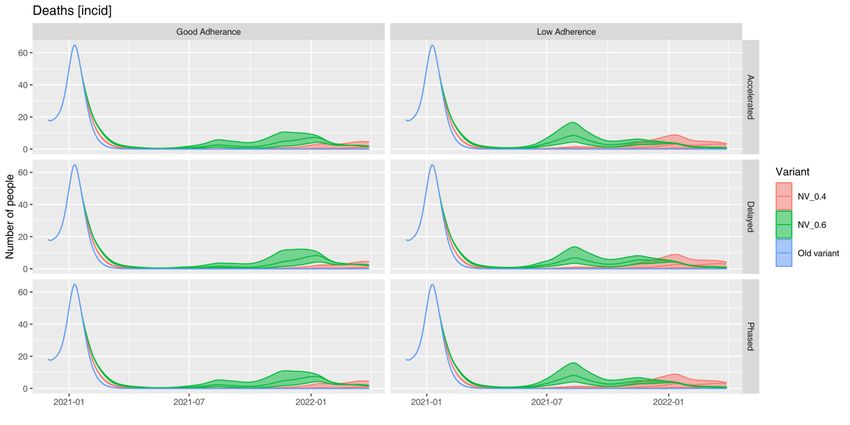
existing restrictions, vaccine 80% effective, accelerated release of restrictions, and
B117 Rt; but this will be monitored over time as to whether it fits the relevant data.

Figure 4 showing the new proposed MLS and RWC scenarios are included in the
appendix. The charts also include the current February 2021 MLS and February
2021 RWC for comparison.

                                           9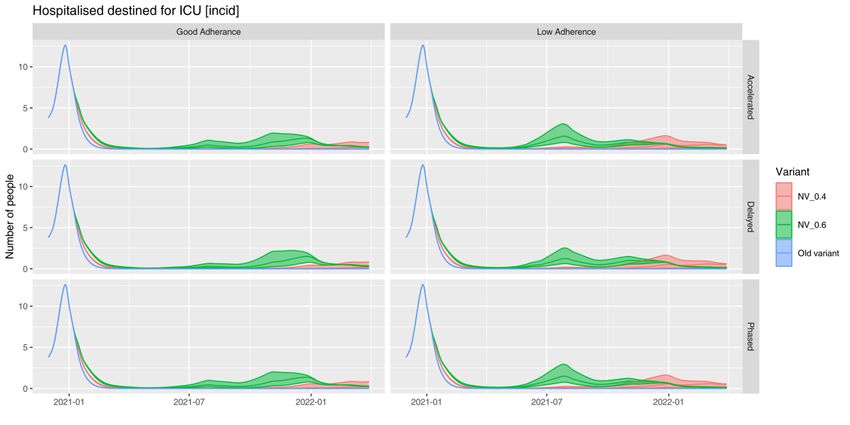
Figure 1. Trend in outcomes for an “Accelerated approach”, “Delayed approach” and
“Phased approach”, with good/low adherence, varying effects of new variants
(coloured curves), and different vaccine efficacy (areas around trend lines).

1A. Daily cases

1B. Hospital admissions not destined for ICU (COVID-19 positive cases).

                                        10
1C. Hospital ICU admissions (COVID-19 positive cases).
1D. Hospital non-ICU occupancy (COVID-19 positive cases).
111E. Hospital ICU occupancy (COVID-19 positive cases)
1F. Deaths.
12Figure 2. Model-estimated COVID-19 deaths along with the current RWC
(RWC_0221) and MLS (MLS_0221), compared to the actual deaths reported by
ONS and PHW, for the three scenarios: “Accelerated approach”, “Delayed approach”
and “Phased approach”.
2A. Accelerated approach
Deaths (NV_0.6, Accelerated Scenario)
70
60
50
40
30
20
10
0
Vacc 0.8 Good adherence Vacc 0.8 Low adherence Vacc 0.95 Good adherence
Vacc 0.95 Low adherence Vacc 0.65 Good adherence Vacc 0.65 Low adherence
7 day RA Deaths (PHW) 7 day RA Deaths (ONS) Feb-21 RWC
Feb-21 MLS
2B. Delayed approach
Deaths (NV_0.6, Delayed Scenario)
70
60
50
40
30
20
10
0
Vacc 0.8 Good adherence Vacc 0.8 Low adherence Vacc 0.95 Good adherence
Vacc 0.95 Low adherence Vacc 0.65 Good adherence Vacc 0.65 Low adherence
7 day RA Deaths (PHW) 7 day RA Deaths (ONS) Feb-21 RWC
Feb-21 MLS
132C. Phased approach
Deaths (NV_0.6, Phased Scenario)
70
60
50
40
30
20
10
0
Vacc 0.8 Good adherence Vacc 0.8 Low adherence Vacc 0.95 Good adherence
Vacc 0.95 Low adherence Vacc 0.65 Good adherence Vacc 0.65 Low adherence
7 day RA Deaths (PHW) 7 day RA Deaths (ONS) Feb-21 RWC
Feb-21 MLS
14Figure 3. Model-estimated COVID-19 admissions along with the current RWC
(RWC_0221) and MLS (MPS_0221), compared to the actual confirmed admissions
reported by PHW, for the “Accelerated approach”, “Delayed approach” and “Phased
approach”.
3A. Accelerated approach
Admissions (NV_0.6, Accelerated scenario)
250
200
150
100
50
0
Vacc 0.8 Good adherence Vacc 0.8 Low adherence Vacc 0.95 Good adherence
Vacc 0.95 Low adherence Vacc 0.65 Good adherence Vacc 0.65 Low adherence
7 day RA Admissions (actuals) Feb-21 RWC Feb-21 MLS
3B. Delayed approach
Admissions (NV_0.6, Delayed scenario)
250
200
150
100
50
0
Vacc 0.8 Good adherence Vacc 0.8 Low adherence Vacc 0.95 Good adherence
Vacc 0.95 Low adherence Vacc 0.65 Good adherence Vacc 0.65 Low adherence
7 day RA Admissions (actuals) Feb-21 RWC Feb-21 MLS
153C. Phased approach
Admissions (NV_0.6, Phased scenario)
250
200
150
100
50
0
Vacc 0.8 Good adherence Vacc 0.8 Low adherence Vacc 0.95 Good adherence
Vacc 0.95 Low adherence Vacc 0.65 Good adherence Vacc 0.65 Low adherence
7 day RA Admissions (actuals) Feb-21 RWC Feb-21 MLS
16Table 1. Accelerated approach
1A. Totals (Between 1st April 2021 and 30th June 2021)
Accelerated COVID-19 Covid-19 COVID-19 COVID-19 ICU
Scenario Cases Deaths Admissions Admissions
Vacc 0.8 Gd Adh 4,746 54 167 10
Vacc 0.8 Low Adh 15,260 108 495 30
Vacc 0.95 Gd Adh 3,019 36 101 6
Vacc 0.95 Lw Adh 9,433 68 282 17
Vacc 0.65 Gd Adh 7,854 82 292 18
Vacc 0.65 Low Adh 25,691 181 907 54
RWC_Feb2021 139,451 2,739 7,772 466
MLS_Feb2021 47,424 595 2,003 120
1B. Daily Peaks (Between 1st April 2021 and 30th June 2021)
Accelerated COVID- Covid- COVID-19 COVID-19 COVID-19
Scenario 19 19 Admissions Bed ICU Bed
Cases Deaths Occupancy Occupancy
Vacc 0.8 Gd Adh 124 1 4 71 2
Vacc 0.8 Low Adh 500 4 18 258 9
Vacc 0.95 Gd Adh 69 1 2 57 1
Vacc 0.95 Lw Adh 290 2 9 139 5
Vacc 0.65 Gd Adh 233 2 9 125 4
Vacc 0.65 Low Adh 890 7 36 499 18
RWC_Feb2021 2,205 36 110 2,199 66
MLS_Feb2021 718 10 31 608 19
171C. Totals by quarter for NV_0.6, vaccine efficacy of 0.8 and good adherence (MLS)
Accelerated COVID-19 Covid-19 COVID-19 COVID-19 ICU
Scenario Cases Deaths Admissions Admissions
01/04/2021 –
30/06/2021 4,746 54 167 10
01/07/2021 –
30/09/2021 11,782 183 572 34
01/10/2021 –
31/12/2021 29,706 380 1,384 83
01/01/2022 –
29/03/2022 10,503 311 685 41
1D. Daily peaks by quarter for NV_0.6, vaccine efficacy of 0.8 and good adherence
(MLS)
Accelerated COVID- Covid- COVID-19 COVID-19 COVID-19
Scenario 19 19 Admissions Bed ICU Bed
Cases Deaths Occupancy Occupancy
01/04/2021 –
30/06/2021 124 1 4 71 2
01/07/2021 –
30/09/2021 201 3 9 171 5
01/10/2021 –
31/12/2021 426 7 21 418 13
01/01/2022 –
29/03/2022 260 7 19 418 12
18Table 2. Delayed approach
2A. Totals (Between 1st April 2021 and 30th June 2021)
Delayed Scenario COVID-19 Covid-19 COVID-19 COVID-19 ICU
Cases Deaths Admissions Admissions
Vacc 0.8 Gd Adh 3,787 50 139 8
Vacc 0.8 Low Adh 11,992 98 396 24
Vacc 0.95 Gd Adh 2,460 35 86 5
Vacc 0.95 Lw Adh 7,496 62 229 14
Vacc 0.65 Gd Adh 6,121 76 237 14
Vacc 0.65 Low Adh 20,007 162 714 43
RWC_Feb2021 139,451 2,739 7,772 466
MLS_Feb2021 47,424 595 2,003 120
2B. Daily Peaks (Between 1st April 2021 and 30th June 2021)
Delayed Scenario COVID- Covid- COVID-19 COVID-19 COVID-19
19 19 Admissions Bed ICU Bed
Cases Deaths Occupancy Occupancy
Vacc 0.8 Gd Adh 83 1 3 71 2
Vacc 0.8 Low Adh 361 3 12 180 6
Vacc 0.95 Gd Adh 47 1 2 57 1
Vacc 0.95 Lw Adh 208 1 7 97 3
Vacc 0.65 Gd Adh 155 2 5 90 3
Vacc 0.65 Low Adh 651 5 25 347 12
RWC_Feb2021 2,205 36 110 2,199 66
MLS_Feb2021 718 10 31 608 19
192C. Totals by quarter for NV_0.6, vaccine efficacy of 0.8 and good adherence
Delayed Scenario COVID-19 Covid-19 COVID-19 COVID-19 ICU
Cases Deaths Admissions Admissions
01/04/2021 – 3,787 50 139 8
30/06/2021
01/07/2021 – 7,966 118 375 23
30/09/2021
01/10/2021 – 31,253 369 1,421 85
31/12/2021
01/01/2022 – 13,416 379 854 51
29/03/2022
2D. Daily peaks by quarter for NV_0.6, vaccine efficacy of 0.8 and good adherence
Delayed Scenario COVID- Covid- COVID-19 COVID-19 COVID-19
19 19 Admissions Bed ICU Bed
Cases Deaths Occupancy Occupancy
01/04/2021 – 83 1 3 71 2
30/06/2021
01/07/2021 – 122 2 5 104 3
30/09/2021
01/10/2021 – 503 8 25 481 15
31/12/2021
01/01/2022 – 319 8 23 482 15
29/03/2022
20Table 3. Phased approach
3A. Totals (Between 1st April 2021 and 30th June 2021)
Phased Scenario COVID-19 Covid-19 COVID-19 COVID-19 ICU
Cases Deaths Admissions Admissions
Vacc 0.8 Gd Adh 4,375 52 156 9
Vacc 0.8 Low Adh 14,080 103 457 27
Vacc 0.95 Gd Adh 2,799 35 95 6
Vacc 0.95 Lw Adh 8,719 65 262 16
Vacc 0.65 Gd Adh 7,196 79 270 16
Vacc 0.65 Low Adh 23,690 170 834 50
RWC_Feb2021 139,451 2,739 7,772 466
MLS_Feb2021 47,424 595 2,003 120
3B. Daily Peaks (Between 1st April 2021 and 30th June 2021)
Phased Scenario COVID- Covid- COVID-19 COVID-19 COVID-19
19 19 Admissions Bed ICU Bed
Cases Deaths Occupancy Occupancy
Vacc 0.8 Gd Adh 111 1 4 71 2
Vacc 0.8 Low Adh 462 3 16 232 8
Vacc 0.95 Gd Adh 63 1 2 57 1
Vacc 0.95 Lw Adh 266 2 9 125 4
Vacc 0.65 Gd Adh 210 2 8 111 4
Vacc 0.65 Low Adh 827 6 33 449 16
RWC_Feb2021 2,205 36 110 2,199 66
MLS_Feb2021 718 10 31 608 19
213C. Totals by quarter for NV_0.6, vaccine efficacy of 0.8 and good adherence
Phased Scenario COVID-19 Covid-19 COVID-19 COVID-19 ICU
Cases Deaths Admissions Admissions
01/04/2021 – 4,375 52 156 9
30/06/2021
01/07/2021 – 11,006 168 530 32
30/09/2021
01/10/2021 – 30,435 384 1,413 85
31/12/2021
01/01/2022 – 11,021 325 717 43
29/03/2022
3D. Daily peaks by quarter for NV_0.6, vaccine efficacy of 0.8 and good adherence
Phased Scenario COVID- Covid- COVID-19 COVID-19 COVID-19
19 19 Admissions Bed ICU Bed
Cases Deaths Occupancy Occupancy
01/04/2021 – 111 1 4 71 2
30/06/2021
01/07/2021 – 184 3 8 157 5
30/09/2021
01/10/2021 – 444 7 22 435 13
31/12/2021
01/01/2022 – 272 7 20 435 13
29/03/2022
22Appendix 1. RWC
Figure 4. COVID-19 current and proposed most likely scenarios (MLS) and
reasonable worst case (RWC)
COVID-19 admissions (NV_0.6, Accelerated scenario)
250
200
150
100
50
0
MLS (vacc 0.8 good adherence) RWC (Vacc 0.65 low adherence) 7 day RA Admissions (actuals)
Feb-21 RWC Feb-21 MLS
23Appendix 2. Consideration of age-specific effects
To illustrate the age-specific effects of vaccination, the model was fitted to recent
case incidence data up until the beginning of April, using the model with / without
vaccination. The output of the model case fatality rate was then compared to the
observed data. (Note figure 5 is not a direct model fit, the fit was obtained solely from
case data, and the predictions plotted against the observations). The vaccination
model illustrates the significant change in the case fatality ratio, due to early roll-out
of the vaccine in the older population, in which the great majority of severe cases are
experienced.
Fig 5. Impact of vaccination on the ratio of death / cases. Case incidence fitted with a
model with no vaccination (blue) and with vaccination (grey).
Appendix 3. Illustration of the effect of B117 at the start of the
pandemic
To illustrate the potential impact of the dominant B117 variant, the model was run
with emergence of this variant in the UK, during the first wave in early 2020. The
scenario assumption is the emergence in January, soon after the importantion of the
first cases, and spread to reaching 50% by 22nd February and complete dominance
by 8th March.
The key result of the scenario is that the increase in the rate of transmission through
the new variant may have been very difficult to detect at this point of the UK
epidemic. At this stage, in the absence of widespread testing, hospitalisations and
death incidence were the key indicators of transmission, and these measures lag
infection incidence by 1 to 3 weeks. The model suggests the epidemic curve for
death incidence may not have deviated significantly from that of the original variant
until very close to, or past the decision point for the 23rd March lockdown. This
24suggests that the more rapid spread of the variant may not have been evident, and
timing of lockdown may have remained unchanged. However during early March,
B117 would have caused considerably more infections, with the consequence that
the post lockdown peak in clinical events may have been up to four-fold higher, with
associated much greater ICU demand.
Figure 6A. Modelled deaths in first wave with original variant (blue) and with
hypothetical early UK emergence and spread of B117 variant (red).
Figure 6B. Modelled ICU occupancy in first wave with original variant (blue) and with
hypothetical early UK emergence and spread of B117 variant (red).
25Appendix 4. Introduction of Health Board Level Modelling
For model fitting, case incidence, hospital incidence, ICU incidence, death incidence,
hospital prevalence and ICU prevalence are used at the all-Wales level. Hence a
single model is used at the all-Wales level for scenarios, and Health Board level
metrics simply on a per capita basis. The models have now been updated on a
Health Board level, which aims to capture more local effects of Rt and timing of
interventions. This allows future scenarios to include more realistic previous
exposure (and Health Board specific vaccination roll out).
It is hoped that the Health Board level scenarios will replace the all-Wales model for
scenarios going forward, however at this stage it requires additional testing. The all-
Wales model has the advantage of larger data sample sizes, and has been tested on
many occasions over the time period. Preliminary outputs from the Health Board
level model, using the same scenarios as above, are shown in Figure 6.
Figure 7. Preliminary Health Board level scenario models. Scenarios from figure 1,
with previous history fitted at the Health Board level instead of all-Wales. Case
predictions only shown for illustration. Dotted lines so expected trajectory in absence
of vaccine roll-out.
2627
You can also read