Technical Conference: Impacts of COVID-19 on the Energy Industry - Panel 3: Natural Gas and Oil Demand Panelist Biographies and Statements ...
←
→
Page content transcription
If your browser does not render page correctly, please read the page content below
Technical Conference:
Impacts of COVID-19 on the Energy Industry

      Panel 3: Natural Gas and Oil Demand

      Panelist Biographies and Statements

               Docket No. AD20-17-000
                   July 8-9, 2020
Impacts of COVID-19 on the Energy Industry

                       Panel 3: Natural Gas and Oil Demand

Panelist Biographies and Statements:
   • Robert Brooks, Founder and President, RBAC, Inc.
   • David Bryson, Senior Vice President and Chief Commercial Officer, Gas
     Transmission and Midstream, Enbridge
   • Anatol Feygin, Executive Vice President and Chief Commercial Officer, Cheniere
     Energy
   • Gary Gibson, General Manager and Chief Executive Officer, City Utilities of
     Springfield
   • Terry Lewandowski, Senior Director – Energy, Nutrien, and President of the Process
     Gas Consumers Group
   • Matt O’Mahoney, Managing Director – Fuel Procurement and Operations, Delta
     Airlines
   • Toby Rice, Chief Executive Officer, EQT Corporation
Robert Brooks
                                 Founder and President
                                 RBAC, Inc.

Dr. Robert Brooks has over forty years as a thought leader in the subject of energy economics. In this
role he has developed modeling systems used for understanding and predicting the consequences of
changes in the natural gas industry in the US and worldwide.

He is the Founder of RBAC, Inc. which serves industry, government agencies and leading energy
consulting companies with its modeling tools and research.

In 1997 Dr. Brooks designed the industry standard GPCM® Natural Gas Market Forecasting System
used by consultants, firms, government agencies and other organizations engaged in the North
American energy market analysis and forecasting. More recently he has developed the G2M2® Global
Gas Market Modeling System for use by industry analysts and policy makers around the world.

Dr. Brooks is a member and frequent speaker at conferences of the International Association for
Energy Economics and the Energy, Natural Resources & the Environment section of INFORMS. His
recent presentations have focused on the evolution of the global gas and LNG market as influenced by
the North American shale gas revolution and implications of various of various pipeline projects and
impacts of geopolitical events.

He is an applied mathematician, software systems designer, and energy economist with over forty
years of experience in developing decision support systems for industry analysts and government
policymakers. Dr. Brooks' educational background includes a Ph.D. in Management/Operations
Research from MIT.

Early in his career, Dr. Brooks developed modeling systems for US Federal and State government
agencies. He was a principal model designer for US President Jimmy Carter’s National Energy
Transportation Study.
FERC COVID-19 Technical Conference
Statement
Good morning, my name is Robert Brooks. I am the founder and president of RBAC, Inc. RBAC develops
and licenses predictive analytics tools for industry, consultants, and government agencies involved with
energy, transportation, and the environment. Our principal product is the GPCM Natural Gas Market
Forecasting System which is a widely used tool for developing forecasts and scenarios for North American
natural gas flows, price, and basis.

The ongoing pandemic has profoundly impacted energy markets primarily by reducing energy
consumption. This, of course, has led to a corresponding reduction in the demand for well-drilling and
production. To date, COVID-19’s greatest impact to energy consumption has occurred in the
transportation sector. People aren’t driving or flying nearly as often amid lockdowns, increased telework,
and travel restrictions. As a result, oil markets have experienced more turmoil than natural gas markets
because a large percentage of refined crude products are used as transportation fuels. The EIA reported
that jet fuel, distillates, and motor gasoline demand declined between 40-60% during the peak of the
pandemic. Refinery operations quickly reduced utilization rates, falling from rates that exceeded 90% in
January to 68% by mid-April.

The pandemic has reduced natural gas demand from the commercial and industrial sectors as well as LNG
exports, but the magnitude of these impacts are less severe compared to those experienced in the
transportation sector. Industrial gas demand is estimated to have declined by over 3 billion cubic feet per
day (Bcf/d) during April compared to the previous year, a reduction of approximately 13.5%. Deliveries to
LNG facilities declined by about 2.3 Bcf/d between May and June 2020, a decline of approximately 35%,
amid cargo cancellations that appear to be ongoing. Impacts to other natural gas sectors have been more
limited. Declines in commercial gas demand have been partially offset by increases in residential demand
as people stay home. Several RTOs/ISOs have reported declines in weather adjusted energy demand, but
most of these declines were less than 10% on average. However, currently low natural gas prices increase
the competitiveness of natural gas as a power generation fuel, so only a portion of this decline has fallen
on gas-fired generation. While the impacts to gas markets have been less severe than those of oil, the
low-price environment and general uncertainty has likely delayed the investment decisions of several
infrastructure projects, such as the Permian and Haynesville Global Access projects. The low-price
environment and market uncertainty should also intensify an ongoing trend of producers’ focusing on
returns on investment rather than production growth.

Our general view is that the pandemic will continue to primarily impact transportation fuels due to
ongoing social distancing requirements, more remote working, and less road and air travel – all of which
are likely to last through 2020 and into 2021. Lower demand for transportation fuels that reduce the price
of oil have important implications for U.S. natural gas supply because of large volumes of associated gas
production. Associated natural gas production from liquids-focused areas such as the Bakken Shale,
Permian Basin, and Niobrara Shale accounted for over 25% of total U.S. production in January 2020.

The crude oil price rebound to $40/bbl has initiated the reopening of some oil well shut-ins and may lead
to a slight rebound in drilling in the most economic liquids focused locations, but few oil wells outside of
the best acreage are profitable at $40/bbl. If oil prices persistently remain below the $40-50/bbl range,
then production will likely shift to non-associated areas such as the Marcellus and Haynesville shale
formations. However, should oil prices rise above the $40-50/bbl range, there will likely be a rebound in
liquids focused areas and associated gas production where the costs of gas production are largely
accounted for by liquids sales. Therefore, the price of oil is a major determining factor in the location of
future natural gas supply growth. The location of future natural gas supply growth has important
implications for pipeline utilization and constraints. For example, RBAC analyzed several Permian basin
production scenarios and found that should significant production growth resume and dry-gas production
volumes exceed 13.9 Bcf/d by 2022, then the basin’s takeaway capacity will be reached. Producers would
be forced to sell associated gas at low prices, similar to the experiences during 2019.

This concludes my opening remarks and I look forward to answering any questions that you may have.

David Bryson
                              Senior Vice President and Chief Commercial Officer
                              Gas Transmission and Midstream
                              Enbridge

David Bryson is Enbridge’s Chief Commercial Officer for the Gas Transmission and Midstream business.
As a member of the leadership team, he provides strategic leadership and management oversight to
Marketing, Business Development, Gas Control, and Planning and Economic Valuation for the
transmission and gas storage services and assets across North America.

Prior to joining the Gas Transportation and Midstream business, David was the Senior Vice President of
Operations for Enbridge’s Liquids Pipelines. In this position, David was responsible for North American
field operations ensuring the safe and reliable delivery of energy through the Enbridge Liquids Pipelines
systems.

In his 25 years at Enbridge, David has held various roles across Enbridge’s Liquids and Gas businesses,
including asset performance, operations, project development and execution, and customer service
with a focus on driving optimal performance while identifying and pursuing new business development
opportunities to grow and enhance the business.

David has a Mechanical Engineering Degree from the University of Western Ontario and is a graduate
of the Harvard Business School’s Advanced Management Program.
On behalf of Enbridge, I would like to thank the Commission for hosting this Technical
Conference to better understand the impacts of the COVID-19 pandemic on the industry. I would
also like to thank the Commission for their hard work and commitment to “business as usual” in
a work from home environment.

Enbridge’s operations are widespread across North America and are primarily made up of
interstate natural gas and liquids transportation - both industries regulated by the Commission.
Enbridge transports nearly 20% of the natural gas consumed in the U.S. and 3 million barrels of
liquids products per day on more than 22,000 miles of federally regulated pipelines.

The backbone of Enbridge’s liquids transportation Mainline is our Lakehead system which
transports primarily Western Canadian and Bakken crude oil and natural gas liquids to refineries
throughout the U.S. Midwest and eastern Canada. Our connectivity across this footprint has
facilitated market access expansions through the Mid-Continent and to the large concentration of
Gulf Coast refineries as well.

As we all know, the pandemic triggered a massive reduction in oil demand. With the Enbridge
Mainline as a common carrier (competitors are generally 90% contracted), we expect as much as
300kbpd of lower throughput on average through the end of 2020. This translates into a
significant reduction in earnings while in contrast, our operating costs remain fixed, save for
power costs as we continue to maintain and operate our systems in a safe and reliable manner.

As a result of these conditions, Enbridge has taken tough but deliberate steps to financially
weather the impacts of the pandemic, including a voluntary workforce reduction program and
deferment of considerable spending in our capital expansion program.

With this backdrop, FERC’s five-year review of the oil pipeline rate index is a critically
important proceeding for the industry. Higher costs for operational and safety efforts, along with
COVID-related demand decline, underscores the need for the index to be fully reflective of
actual cost changes experienced by the oil pipeline industry, especially when the volatility for the
energy sector will remain for quite some time.

As for the Enbridge gas transportation network, it is comprised of several pipeline systems
across the continent serving industrial, commercial, residential and power plant loads as well as
the growing LNG export demand.

The throughput on our gas transportation system has been impacted as well with demand being
reduced by 5 to 15% across various markets. We do expect this demand to recover more quickly
when the economy gains momentum, but the exact amount and pace is yet to be determined.

As operators of essential energy infrastructure systems, we quickly incorporated COVID-19
expert guidance and health protocols across all our systems and offices, and as a result, have
been able to safely continue to serve our customers and deliver the energy they need. Throughout
the pandemic, we proactively took steps to ensure our employees and our contractors were able
to continue working safely on identified and prioritized critical system needs.
We continue to actively seek and execute expansions of our existing systems to meet incremental
demand across our domestic markets and to support growing exports. Although these
development opportunities continue to present themselves, there is no doubt some will take
longer as supply and demand stabilize. In parallel with this, processing of permits is taking
longer in some cases as agencies work from home and we continue to face the challenge in some
states with permits or easements not being issued or granted. I would encourage the Commission
to keep reviewing and processing certificates and rehearing requests in a timely manner.

America needed more natural gas and liquids transportation capacity before the pandemic, and
this certainly will be true moving forward. This energy infrastructure development will play a
critical role in stimulating and sustaining America’s economic recovery.

Thank you for the opportunity to be here today.
Anatol Feygin
                                     Executive Vice President and Chief Commercial Officer
                                     Cheniere Energy

Anatol Feygin has served as Executive Vice President and Chief Commercial Officer since September
2016. Mr. Feygin joined Cheniere in March 2014 as Senior Vice President, Strategy and Corporate
Development. Mr. Feygin also currently serves as Executive Vice President and Chief Commercial
Officer of Cheniere Partners GP.

Prior to joining Cheniere, Mr. Feygin worked with Loews Corporation from November 2007 to March
2014, most recently as its Vice President, Energy Strategist and Senior Portfolio Manager. Prior to
joining Loews, Mr. Feygin spent three years at Bank of America, most recently as Head of Global
Commodity Strategy. Mr. Feygin began his banking career at J.P. Morgan Securities Inc. as Senior
Analyst, Natural Gas Pipelines and Distributors.

Mr. Feygin earned a B.S. in Electrical Engineering from Rutgers University and an M.B.A. in Finance
from the Leonard N. Stern School of Business at New York University.
Gary Gibson
General Manager and Chief Executive Officer
City Utilities of Springfield
City Utilities of Springfield is a progressive, community-owned utility serving 320 square miles in
southwest Missouri since 1945 with electricity, natural gas, water, broadband, and public
transportation services. City Utilities is overseen by a governing board composed of local citizens. Over
111,000 customers enjoy electricity prices among the lowest in the United States, the convenience of
one bill for all utilities, and dependable hometown services delivered with a personal touch.
As the Chief Executive Officer for City Utilities, the General Manager serves as the strategic leader for
City Utilities’ vision and mission, provides overall direction for the efficient operation of City Utilities,
and advises and makes recommendations to the Board of Public Utilities.
Mr. Gibson holds a B.S. in Mechanical Engineering from the Missouri University of Science and
Technology. He has formerly served as Chairman of the Missouri Association of Natural Gas Operators,
Chair of the Board of the MEA Energy Association, the Board of the American Public Gas Association
(APGA) and is the Past-Chair of the APGA Research Foundation.Gary Gibson Opening Statement FERC COVID-19 Technical Conference July 9, 2020 – Panel 3 I appreciate the opportunity to participate in this panel today and thank Chairman Chatterjee, the Commissioners, and Commission staff for organizing this important technical conference regarding the impacts of COVID-19 on the energy industry. I am Gary Gibson, General Manager - CEO for City Utilities of Springfield, and I appear on behalf of the American Public Gas Association or APGA. City Utilities of Springfield is a community-owned utility serving over 110,000 customers in southwest Missouri with natural gas, as well as electricity, water, broadband, and public transportation services. For the last 75 years, City Utilities has been governed by a board of dedicated local citizens. APGA appreciates the Commission’s commitment to addressing the significant impacts that COVID-19 has had on the energy industry. Throughout this crisis, approximately 1,000 communities across the U.S. have relied on their public gas utilities for safe, reliable, and affordable fuel for use in cooking, clothes drying, and space and water heating, as well as for various commercial and industrial needs. APGA’s members have delivered. APGA members are locally-owned and governed to be accountable to the communities they serve – community aid and service is the mandate for these utilities. Consequently, APGA’s members, including City Utilities, have taken significant steps to ensure natural gas continues to safely flow to all during this crisis, especially to those with emergency financial needs. To best serve their communities, APGA’s members have been pausing shutoffs, waiving fees and penalties for late payment, and restoring service to those in need. As a result, many APGA members have had customers request deferrals of payments, resulting in the deferral of hundreds of thousands of dollars in revenue for some systems. Furthermore, APGA members and other pipeline operators have developed COVID-related procedures to ensure that personnel have the planning, resources, and technology they need to perform their roles and to minimize exposure to the virus. While enforcement of certain regulations has been relaxed to provide relief to regulated communities, pipeline safety has remained the top priority during these challenging times. Employees of APGA members have been on the front lines supporting their customer owners by responding to a variety of service calls. Municipal gas utilities have also fallen victim to the hardships presented by the pandemic, having lost roughly $140 million since March and being projected to realize additional revenue losses in the coming months. While Congress has acted swiftly to provide much needed aid to various industries, local governments including municipal utilities have been largely ineligible for many of these programs. Consequently, APGA has requested Congressional assistance to help offset revenue losses as a result of COVID-19. Until public utilities receive appropriate support, APGA’s members will continue to face significant financial hardships, which could impact infrastructure projects moving forwards.
With these challenging times, there has been heightened awareness of many APGA members’
dependence on one pipeline for gas supply. While no issues were experienced during the
pandemic, the Commission is encouraged to ensure that it is taking appropriate steps in
approving infrastructure that allows for America’s abundant energy resources to reach the homes
and businesses that need them.

During this crisis, many of the best solutions have come at the local level – those closest to the
needs of their communities. Public gas utilities continue to be essential to thousands of
communities across the country, and we look forward to working together with the Commission
and other stakeholders towards solutions that support these critical entities through responsible
recovery. Thank you again, and I look forward to today’s discussion.
Terry Lewandowski
                             Senior Director – Energy, Nutrien,
                             and President of the Process Gas Consumers Group

In his current position he oversees all physical and financial energy trading for North America. Terry
has over 25 years in the energy industry and has been with the company for over 20 years. Nutrien is
the world's largest provider of crop inputs and services, playing a critical role in helping growers
increase food production in a sustainable manner. We produce and distribute 25 million tonnes of
potash, nitrogen and phosphate products world-wide. We operate with a long-term view and are
committed to working with our stakeholders as we address our economic, environmental and social
priorities.

Terry also serves as the Chairman for the Process Gas Consumers Group (PGC), a national association
of industrial gas consumers whose member companies represent a broad cross-section of U.S.
industry. PGC represents energy-intensive large industrial and manufacturing natural gas consumers
who have the potential to benefit from the low-cost energy prices brought about by the shale
revolution. PGC members own and operate hundreds of manufacturing plants and facilities in virtually
every state in the nation and consume natural gas delivered through interstate natural gas pipeline
systems throughout the United States. PGC members hold transportation capacity on numerous
interstate pipelines. PGC advocates on behalf of its members to ensure that they can continue to
receive the requisite gas to operate their facilities at reasonable and competitive costs in the global
marketplace.
Matt O’Mahoney
Managing Director
Fuel Procurement and Operations
Delta Airlines
In this position, Matt’s responsibilities include jet fuel procurement of the approximately 4 billion
gallons (pre Covid19) Delta consumes annually. In addition, Matt’s team manages airport fueling
operations and fuel consortium involvement for Delta as well as QA/QC for the airline. Matt also works
with a cross-divisional Fuel Board at Delta on fuel consumption savings initiatives and supports Delta’s
sustainability efforts.
Matt is active with the Energy Council for A4A (Airlines for America) who he will be representing in this
FERC forum.
Matt has worked at Delta for 17 years, with the majority of his time in Finance. Prior to his current
position, Matt was the Chief Financial Officer of Monroe Energy, Delta’s refining subsidiary which
operates the Trainer Refinery outside of Philadelphia, PA. He has also held positions in division Finance
and Financial Planning & Analysis at Delta. Matt has a BBA in Finance from the University of Georgia
and an MBA from Emory University.
In his free time, Matt enjoys spending time with his wife and two children, traveling, and running.FERC Forum: Impacts of COVID-19 FERC Docket No. AD20-17-000 Matt O’Mahoney – Delta Air Lines July 9, 2020
Airlines for America (A4A) Members and Mission
Founded in 1936
A4A advocates on behalf of its members to shape crucial policies and measures that promote safety,
security and a healthy U.S. airline industry. We work collaboratively with airlines, labor, Congress, the
Administration and other groups to improve aviation for the traveling and shipping public.
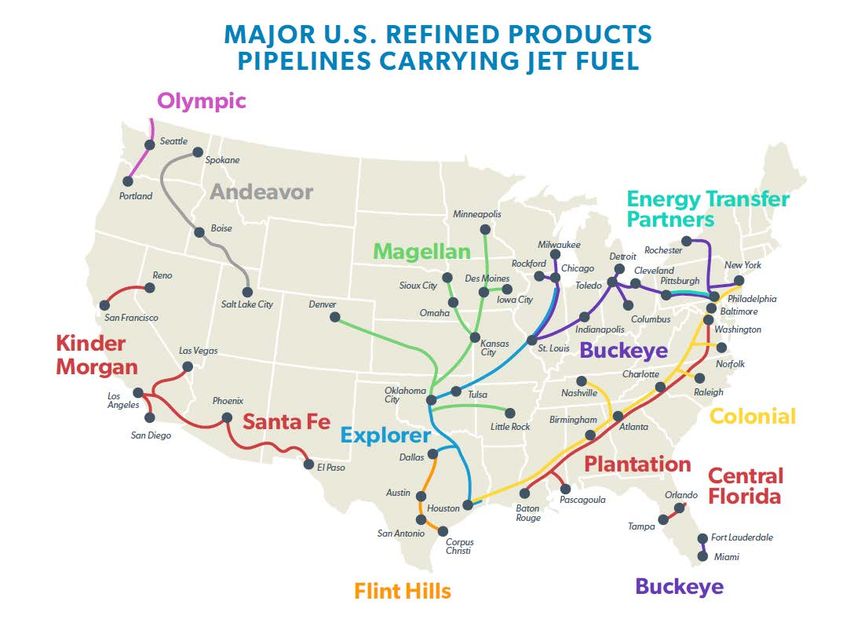
2Major Airports Throughout the US are Heavily Reliant on Refined Product Pipelines
• 16 of the top 30 US airports, measured by passenger volume,
receive most jet fuel requirements by multi-product pipelines,
traveling more than 250 miles.
- Includes 5 of the top 6 airports: Atlanta, Chicago-O’Hare,
Dallas/Fort Worth, Denver, and New York-JFK.
- Without access to a pipeline, it would take ~325 7,800-
gallon tanker trucks consistently traveling between the
Exxon Baton Rouge refinery and Atlanta to supply the
airport.
• This cost would also be 10x the pipeline tariff and
create far more emissions and environmental risk
from spills.
- Given space constraints, airport fuel tanks can typically
only accommodate 5-10 days of supply, so efficient
delivery via pipeline is key to avoiding shortages.
- Airlines have become adept at managing supply
disruptions, but shortages still occur.
Represents top 30 passenger airport that is heavily reliant on interstate or otherwise lengthy pipeline
3Major Airports are Reliant on Jet Fuel Shipped via Pipeline by Airlines
• Many of the largest US airports are far from the major refining
Major US Airports Not Always Located by Refining Centers centers, with half of the US production in the Gulf Coast region,
creating greater risk of supply issues.
• Self-supply, airline-shipped jet fuel, via pipeline has become an
integral part of the airlines overall supply strategies, which have
evolved over the years.
- Individual airlines are often the largest consumer shippers
on the various pipelines.
PADD2 – PADD1 –
- Ensures security of supply with a focus on hub airports.
PADD4 – 99kbpd
274kbpd
31kbpd - Enables airlines to contract directly with producers and
reduce costs.
PADD5 –
452kbpd
• The airlines have established considerable and incredibly
valuable pipeline shipping history .
- This line history allows airlines to continue to access
PADD3 –
pipelines in the future.
940kbpd
• However, line history is calculated based upon a trailing twelve-
month time period.
Source: EIA - The Covid19 pandemic has made it nearly impossible to
EIA PADD regions including daily jet production levels maintain this shipping history.
4Covid19 Has Created an Unprecedented Impact on Airlines
TSA Traveler Throughput: 7-Day Moving Average (in Thousands)
2,750
2,500
2,250
2,000
1,750 January 5.5%
1,500 February 2.1%
March (50%)
1,250
April (95%)
1,000 May (90%)
750 Jun 1-29 (81%)
500 575
250
0
13-May
20-May
27-May
11-Mar
18-Mar
25-Mar
6-May
10-Jun
17-Jun
24-Jun
3-Jun
15-Jul
22-Jul
29-Jul
12-Feb
19-Feb
26-Feb
1-Jul
8-Jul
15-Jan
22-Jan
29-Jan
4-Mar
1-Jan
8-Jan
5-Feb
5-Aug
12-Aug
19-Aug
26-Aug
2-Sep
9-Sep
16-Sep
23-Sep
30-Sep
15-Apr
22-Apr
29-Apr
1-Apr
8-Apr
2019 2020
• The magnitude and the swiftness of the passenger decline is unprecedented, far worse than after the September 11,
2001 attacks.
Source: Transportation Security Administration * U.S. and foreign carrier customers traversing TSA checkpoints; 2019 is year-ago same weekday
5COVID-19 Has Turned a Promising Year Into a Financial Disaster
Note: Cash Flow Excludes All CARES Act Proceeds
YOY Change (%) in Operating Revenues, 2020 YOY Change ($ Mils) in Operating Cash Flow, 2020*
5.6
5.4
864
(851)
(6,842)
(7,766)
(54.4)
(10,917)
May (88.2)
Apr (91.9)
Feb
Jul
Jun
Jan
Aug
Sep
Mar
Oct
Nov
Dec
Feb
Jul
Jun
Jan
Apr
Aug
Sep
Mar
May
Oct
Nov
Dec
• Airlines have made historic route cuts, parking and/or retiring older aircraft to stems losses, but with revenue down
~90% in April and May, the airlines are burning billions of dollars each month.
• The CARES grant was a huge support for the industry, but does not solve the cash flow issue for the airlines.
Sources: A4A member passenger airlines as reported to A4A on a consolidated company basis (including branded code share partners) * Jan-Mar include 2019 profit-sharing payouts; 2Q and 3Q exclude CARES Act receipts
6The Extreme Passenger Reduction Has Led to Significant Jet Fuel Demand Destruction
Kerosene-Type Jet Fuel2 (4-Week Moving Average, Thousand Barrels per Day)
2,250
2,000
1,750
1,500
1,250
1,000
750
500
250
0
10-Jan
17-Jan
24-Jan
31-Jan
6-Mar
3-Apr
10-Jul
17-Jul
24-Jul
31-Jul
2-Oct
12-Jun
19-Jun
26-Jun
13-Mar
20-Mar
27-Mar
10-Apr
17-Apr
24-Apr
1-May
8-May
7-Aug
4-Sep
7-Feb
15-May
22-May
29-May
14-Aug
21-Aug
28-Aug
11-Sep
18-Sep
25-Sep
3-Jan
14-Feb
21-Feb
28-Feb
3-Jul
5-Jun
1Jet fuel supplied within the United States to all users (i.e., U.S. and foreign airlines, recreational and business aviation, civilian government, military)
2Approximates consumption by measuring the disappearance of these products from primary sources (i.e., refineries, natural gas processing plants, blending plants, pipelines, bulk terminals). Generally computed as: field
production + renewable fuels and oxygenate plant net production + refinery and blender net production + imports + net receipts + adjustments - stock change - refinery and blender net inputs - exports.
Source: U.S. Energy Information Administration (EIA)
• Consistent with flying levels, the consumption of jet fuel has been significantly reduced, down approximately 70% in
May 2020 versus May 2019. While there has been a slight uptick in June, it has been minimal.
7Due to Sharply Reduced Demand for Air Travel, Jet-Fuel Use is Down Disproportionately
U.S.-Based Fuel Demand (Index: 2019 Average = 100)
120
100
86.1
80 79.9
60
40 38.7
20
0
1/4/19
2/1/19
3/1/19
1/3/20
1/1/21
3/29/19
4/26/19
5/24/19
6/21/19
7/19/19
8/16/19
9/13/19
11/8/19
12/6/19
1/31/20
2/28/20
3/27/20
4/24/20
5/22/20
6/19/20
7/17/20
8/14/20
9/11/20
10/9/20
11/6/20
12/4/20
Gasoline 10/11/19 Diesel Jet
• On sharply reduced flying levels, most recent jet fuel consumption remains 61% below 2019 levels, whereas gasoline
and diesel are down 14% and 20%, respectively.
8U.S. Airline Traffic Is Not Expected to Return to 2019 Levels Until 2023
Revenue Passenger Miles (Billions)
1,200 ~90% of
2019
1,000 ~75% of
2019
800
600 ~45% of
2019
400
200
0
2020F
2021F
2022F
2023F
2010
2011
2012
2013
2014
2015
2016
2017
2018
2019
Source: U.S. Bureau of Transportation Statistics (T1 systemwide for U.S. airlines – all services) and Wolfe Research
• While there have been some recent improvements in passenger numbers, it is commonly held that a full recovery will
take at least 2-3 years.
• A risk to even this slow recovery is a second wave of virus outbreak which could send passenger demand down again.
9Airline Recovery Requires Undisrupted Jet Fuel Supply
• The return to pre-Covid demand for jet fuel will lag other refined products – gasoline demand has begun to return, and diesel
demand was not materially affected by the pandemic.
- Calendar year 2020 jet fuel consumption projected at 40-50% of 2019 levels.
- Calendar year 2021 is projected at 75% of 2019 levels.
• After a short period off allocation, other products have taken the place of jet fuel on vital, multi-product pipelines.
• The lack of available line space threatens incremental jet fuel shipments required for the airline industry as demand for jet fuel
returns.
• The valuable shipping history that the airlines have developed over decades is now evaporating leaving concerns over ability
for airlines to transport product to their hubs.
- Without line history, there is no confidence that airlines will be able to access pipelines in the future which puts airlines
recovery in jeopardy.
- Unlike refineries or trading companies, most airlines cannot transport gasoline or diesel to protect line space.
- The purchase of line space on the secondary market could create significant costs for the airlines.
- Airlines are not new shippers so cannot take advantage of new shipper status.
- Other solutions need to be considered and discussed.
Airlines for America requests consideration from the FERC on protecting line history to help ensure the airlines’ healthy recovery.
10Appendix 11
The Extreme Passenger Reduction Has Led to Significant Jet Fuel Demand Destruction

            U.S.-Based Fuel Demand (Four-Week Moving Average, Thousand Barrels per Day)
12,000

10,000

 8,000

 6,000

 4,000

 2,000

        0
            1/4/19
                     2/1/19
                              3/1/19

                                                                                                                                             1/3/20

                                                                                                                                                                                                                                                                              1/1/21
                                       3/29/19
                                                 4/26/19
                                                           5/24/19
                                                                     6/21/19
                                                                               7/19/19
                                                                                         8/16/19
                                                                                                   9/13/19

                                                                                                                        11/8/19
                                                                                                                                  12/6/19

                                                                                                                                                      1/31/20
                                                                                                                                                                2/28/20
                                                                                                                                                                          3/27/20
                                                                                                                                                                                    4/24/20
                                                                                                                                                                                              5/22/20
                                                                                                                                                                                                        6/19/20
                                                                                                                                                                                                                  7/17/20
                                                                                                                                                                                                                            8/14/20
                                                                                                                                                                                                                                      9/11/20
                                                                                                                                                                                                                                                10/9/20
                                                                                                                                                                                                                                                          11/6/20
                                                                                                                                                                                                                                                                    12/4/20
                                                                                                             10/11/19
                                                                                                      Gasoline                              Diesel                 Jet
    •       Consistent with flying levels, the consumption of jet fuel has been significantly reduced, down approximately 70% in
            May 2020 versus May 2019.

                                                                                                                                   12
Line Space Allocation Example – Theoretical Calculation
2019 Levels - Pre Covid 2020 Levels - Covid191 2021 - Max Based upon 2020 Line History
Jet ULSD Gas Total Jet ULSD Gas Total Jet ULSD Gas Total
Jan 150,000 450,000 400,000 1,000,000 149,187 394,127 387,536 930,850 94,730 482,439 422,830 1,000,000
Feb 150,000 450,000 400,000 1,000,000 141,687 432,782 404,147 978,616 94,730 482,439 422,830 1,000,000
Mar 150,000 450,000 400,000 1,000,000 125,480 425,693 376,524 927,697 94,730 482,439 422,830 1,000,000
Apr 150,000 450,000 400,000 1,000,000 50,168 359,174 241,679 651,021 94,730 482,439 422,830 1,000,000
May 150,000 450,000 400,000 1,000,000 46,891 389,699 309,975 746,565 94,730 482,439 422,830 1,000,000
Jun 150,000 450,000 400,000 1,000,000 56,240 371,769 329,903 757,911 94,730 482,439 422,830 1,000,000
Jul 150,000 450,000 400,000 1,000,000 49,500 405,000 360,000 814,500 94,730 482,439 422,830 1,000,000
Aug 150,000 450,000 400,000 1,000,000 49,500 405,000 360,000 814,500 94,730 482,439 422,830 1,000,000
Sep 150,000 450,000 400,000 1,000,000 49,500 405,000 360,000 814,500 94,730 482,439 422,830 1,000,000
Oct 150,000 450,000 400,000 1,000,000 75,000 405,000 360,000 840,000 94,730 482,439 422,830 1,000,000
Nov 150,000 450,000 400,000 1,000,000 75,000 405,000 360,000 840,000 94,730 482,439 422,830 1,000,000
Dec 150,000 450,000 400,000 1,000,000 75,000 405,000 360,000 840,000 94,730 482,439 422,830 1,000,000
Total 1,800,000 5,400,000 4,800,000 12,000,000 943,152 4,803,244 4,209,765 9,956,161 1,136,766 5,789,272 5,073,962 12,000,000
% of Total Shipped 15% 45% 40% 100% 9% 48% 42% 100% 9% 48% 42% 100%
Percentage versus 2019 63% 107% 106%
¹ Based upon the year-over-year demand for each product utilized as an example proxy for pipeline movements.
• The above table details how an allocated pipeline would calculate line history for 2021, based upon 2020 shipping levels
considering the impact on product demand from Covid19.
• The disproportionate demand destruction for jet fuel in 2020 yields insufficient space in 2021, 63% of 2019, to transport
the needed jet fuel to airports with 2021 consumption expected to be at 75% of 2019.
- In this example, gasoline and diesel has secured the needed space for jet fuel.
- This also sets the line space beyond 2021.
13Toby Rice
Chief Executive Officer
EQT Corporation
Toby Z. Rice was named EQT’s President and Chief Executive Officer in July 2019, when he also was
elected to the company’s Board of Directors. Since May 2018, Toby has served as a Partner at Rice
Investment Group, a multi-strategy fund investing in all verticals of the oil and gas sector. From
October 2013 until its acquisition by EQT in November 2017, Toby was President, Chief Operating
Officer and a member of the Board of Directors of Rice Energy.
Previously, he served in a number of positions with Rice Energy, its affiliates and predecessor entities –
beginning in February 2007 – including President and Chief Executive Officer of a predecessor entity
from February 2008 through September 2013.Opening Statement of Toby Rice, CEO of EQT Corporation
FERC COVID‐19 Technical Conference
July 9, 2020 – Panel 3
Good morning, and thank you for hosting today’s Technical Conference.
My name is Toby Rice, and I am the CEO of EQT Corporation. Based in Pittsburgh and operating in the
core of the Appalachian Basin, EQT is the largest producer of natural gas in the country.
The combination of COVID‐19 and the OPEC+ price war has fundamentally changed the trajectory of the
American oil and gas industry. Over the past two decades, the shale revolution has powered our economy,
supported good jobs, improved our environment and strengthened our national security. The principal
drivers behind these positive steps were not “big oil”, they were the independent oil and gas producers,
which today account for over 80% of U.S. natural gas production. Competition led to drastic improvement
in operational performance, ultimately reversing the decades long status of the U.S. as a net energy
importer.
Today, it is anticipated that numerous public independent oil and gas producers will go bankrupt in the
next few years. The value of the approximately 80 public independent oil and gas producers is roughly
the same as the value of the four largest midstream companies as well as the two largest utilities. EQT
alone provides the feedstock for nearly 2% of the country’s power – effectively powering one out of every
60 homes, offices, hospitals and yes Teslas in the country – and yet we are valued at approximately 1/4th
and 1/20th the values of the midstream companies represented on today’s panel.
The reason for this value disconnect is simple – the combination of cheap capital and significant
productivity improvements drastically increased domestic production and significantly reduced the cost
of the products we sell. The price at which we sell natural gas is less than half what it was in the early
2000s, while many of our most significant midstream costs remain the same.
That reduction in price is a good thing. It is a good thing for the American Citizens, who see lower power
bills. It is a good thing for the environment, lower natural gas prices have replaced coal fired generation
with clean burning natural gas in our power plants, and this is the primary reason why CO2 emissions have
dropped to their lowest levels in a generation. And it is a good thing for the United States, allowing for
the development of a competitive LNG export industry that is a critical piece of expanding U.S. energy
influence around the globe rather than relying on a handful of other countries that may not share our
nation’s values.
While the topic of today is the impact of COVID‐19, it is important to not lose sight of the significance of
the OPEC+ price war. What was made clear to me, and what should be on top of mind for all of us, is that
just as outside influencers can drive the price of oil to $20 per barrel, they can also drive the price to $100
per barrel absent a competitive U.S industry. We cannot allow that to happen.
I am excited to offer a voice for the upstream industry on today’s panel. It is difficult as an upstream
company to decouple the impacts of COVID‐19 and the OPEC+ price war, as the results are the same. We
are going to be entering a world where there are fewer of the companies that drove the country to the
place of strength that it sits in today. For the Commission, it is our opinion that heavy consideration of
the strength of the upstream industry is needed when assessing the actions that it takes going forward.Just this week we saw the cancellation of another major newbuild long‐haul pipeline in the Atlantic Coast
Pipeline. Regardless of one’s views on whether that is a good or bad thing, the reality is that many believe
that we will soon be wrapping up some of the last completed oil and natural gas pipelines in the country.
Additionally, a change in investor sentiment over the last couple of years is resulting in an expectation
that the days of growing domestic supply are behind us as well.
So what does that mean? In my opinion, if the subsidization of supply growth is behind us, the only
manner in which we can continue to provide economically efficient energy to consumers is for the system
to transition its focus away from supporting supply growth and instead focus on supporting efficiencies.
In our opinion, the best way for the FERC to support efficiencies is to maintain the competitive dynamic
that bolstered improvements of the past. That means maintaining a level playing field among operators,
and avoiding propping up underperforming operators by providing arbitrary competitive advantages. It
also means assessing how the policies of the FERC result in value allocation across the entire energy
lifecycle, and how that value allocation affects the health of the system as a whole.
The benefits of a competitive market are real, and we have seen this in our company. In just the last year
since taking control of EQT, we have reduced well costs by approximately 40%. That improvement has
transitioned EQT – again, the largest producer of natural gas in the US – from a financially distressed
company to a sustainable and thriving company. In a world where supply growth is no longer in demand,
only efficient development allows for sustainable businesses. If we do not have a market that drives
efficiencies, the benefits of the shale revolution felt over the past two decades will be at risk of reversal.
Thank you again for the opportunity to join today’s discussion.
2You can also read


