TELLING THE WEATHER STORY - PREPARED BY THE INSTITUTE FOR CATASTROPHIC LOSS REDUCTION (ICLR)
←
→
Page content transcription
If your browser does not render page correctly, please read the page content below
Telling the
WEATHER Story

                   Prepared by
the Institute for Catastrophic Loss Reduction (ICLR)
       for Insurance Bureau of Canada (IBC)

                      June 2012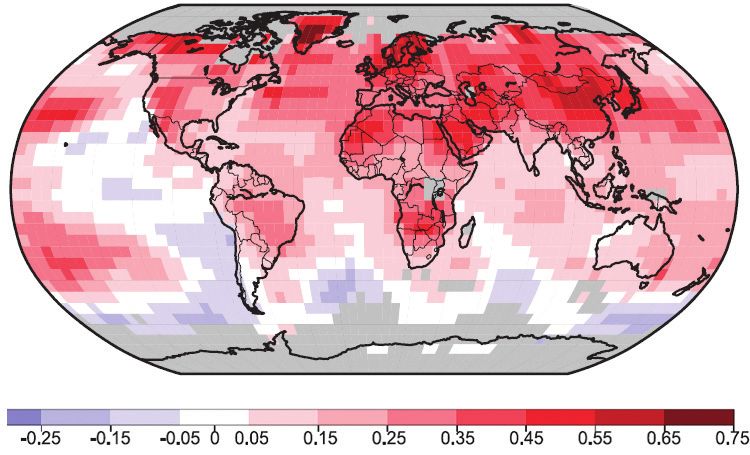
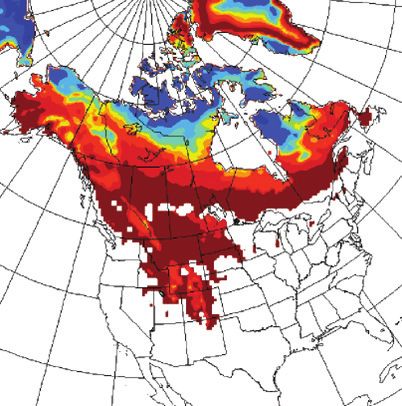
Table of Contents

1. Executive Summary______________________________________________________ 3

2. Introduction____________________________________________________________ 6

3. Methodology___________________________________________________________ 7

4. Climate Change_________________________________________________________ 9

5. Weather/Climate-Related Hazards and Disasters
   and Their Impacts Around the World_______________________________________ 14

6. Weather/Climate-Related Hazards and Disasters
   and Their Impacts in Canada______________________________________________ 16

7. Why Is the Climate Changing?_____________________________________________ 18

8. Projecting the Future____________________________________________________ 20

9. Review_______________________________________________________________ 33

10. Regional Syntheses______________________________________________________ 34

11. Conclusion____________________________________________________________ 52

Appendix: Glossary of Terminology____________________________________________ 53

Endnotes_________________________________________________________________ 62

                          June 2012   Telling the Weather Story | 3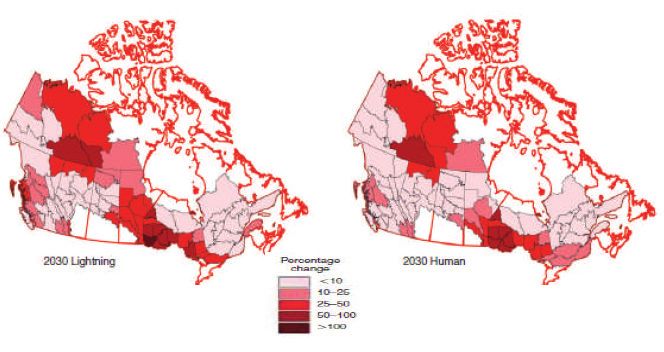
1. Executive Summary

Public and private sector leaders need information about regional climate trends
in order to adapt for the future.
There is increasing evidence around the world that the frequency and severity of severe
weather is on the rise. In Canada, the recent spike in extreme weather-related events has
resulted in social and economic consequences for individuals, governments, and home and
business insurers around the country. Yet little research has been undertaken to investigate
historical and projected changes in weather trends in this country at the regional level.

                                                The purpose of this report is to provide a greater
                                                understanding, based on the best available peer-
Adaptation
                                                reviewed science, about how weather patterns have
Adaptation refers to initiatives                changed in the past and how they are expected to
and measures to reduce the                      change in the future. In doing so, the report aims to
vulnerability of natural and
                                                provide decision makers with the information they
human systems against actual or
                                                need to better adapt public and private infrastructure
expected climate change effects.
Various types of adaptation
                                                to the realities of the changing climate, while allowing
exist (e.g., anticipatory and                   home and business insurers to plan for future claims
reactive, private and public, and               scenarios.
autonomous and planned).
                                        This report has been prepared by Professor
                                        Gordon McBean and colleagues at the Institute for
                                        Catastrophic Loss Reduction (ICLR). It is mainly
based on internationally reviewed climate science as summarized by the Intergovernmental
Panel on Climate Change (IPCC). Canada-specific information has been added based on
Environment Canada publications, reviewed articles and a special report prepared by James
P. Bruce commissioned by ICLR (Climate Change Information for Adaptation). Regional
projections are provided within specific ranges due to the varying availability of reliable
historical weather data and the challenges associated with projecting future changes in
weather at the local level.

Canada’s climate is changing.
This analysis reveals that the warming of the world’s climate system is unequivocal based
on observed increases in global average air and ocean temperatures. The year 2010 ranked,
together with 2005 and 1998, as the warmest on record.

                                    June 2012         Telling the Weather Story | 4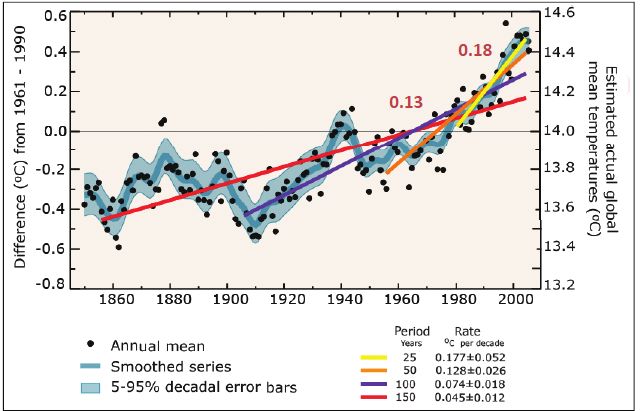
In Canada, on average, temperatures warmed by more than 1.3°C between 1948 and 2007, a
rate of warming that was about twice the global average. The national average temperature
for the year 2010 was 3.0°C above normal, which makes it the warmest year on record since
nationwide records began in 1948. Canada has also become wetter during the past half
century, with mean precipitation across the country increasing by about 12%. On average,
Canada now experiences 20 more days of rain compared with the 1950s. These changes to the
climate are likely responsible, at least in part, for the rising frequency and severity of extreme
weather events in Canada, such as floods, storms and droughts, because warmer temperatures
tend to produce more violent weather patterns.

These weather trends are already affecting Canadians.
People around the world, including Canadians, are already seeing the impact of severe
weather in terms of lost lives and injuries, families displaced from their homes, and towns that
are devastated. The personal and social costs of these losses are incalculable.

Insurers have seen first-hand the financial impacts of severe weather, as insured losses from
natural catastrophes have ranged between $10B and $50B a year internationally over the
past decade. In Canada, catastrophic events cost roughly $1.6B in 2011 and almost $1B in
each of the two previous years. The majority of these insured losses were caused by extreme
weather events, but Canada’s home and business insurers are also seeing an increase in claims
resulting from smaller weather events that nevertheless result in significant property damage
for consumers. These losses are driven in part by Canada’s aging sewer infrastructure, which
is often incapable of handling the new, higher levels of precipitation, while the fact that
homeowners are investing more in costly basement upgrades also has an impact on claims.
As a result, water claims have now surpassed fire as the number one cause of home insurance
losses in many parts of the country.

The climate will continue to change, with varying impacts across Canada’s regions.
The earth is projected to warm by another 1.5°C by 2050. This change in the climate is
expected to have varying impacts on temperature, precipitation and extreme weather trends
throughout Canada, depending on the region of the country and the season.

By 2050, northern Canada is expected to warm the greatest amount during the winter, while
southwestern Canada is likely to warm the most during the summer. Over this same period,
seasonal average precipitation is projected to decline over parts of western and Atlantic
Canada in the summer, while average precipitation is likely to increase over all of Canada in
the winter. Region-specific information on the projected weather trends is provided in the
Regional Syntheses section of this report.

                                June 2012      Telling the Weather Story | 5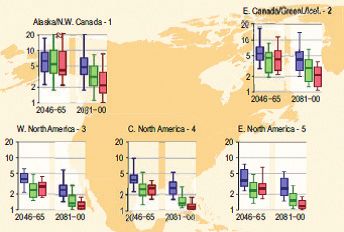
Severe weather is projected to increase over the next 40 years.
Future trends in the frequency and severity of extreme weather will have a significant impact
on the ability of individuals, governments and insurance companies to prepare for future
catastrophic events. This is a concern given that the IPCC has concluded that it is very likely
that extreme weather such as hot extremes, heat waves and heavy precipitation events will
become more frequent over the next 50 years.

The frequency with which Canada experiences events such as heavy rainfall of a given
intensity (known as the return period), is projected to increase such that an event that
occurred on average once every 50 years will be likely to occur about once every 35 years by
2050. Even in regions of the country where average rainfall is projected to decrease in the
summer, the frequency at which severe precipitation events occur is expected to increase over
the next 40 years.

Changes to Canada’s climate will also have implications for climate effects other than
changing precipitation patterns. The occurrence of forest fire activity is projected to increase
by 25% by 2030, with major regional variations as certain parts of the country become hotter
and drier than others. Recent observations have led to projections of global mean sea level
rises of 1 metre or more over the next century, with tangible impacts for Canada’s coastal
regions. Where information is available, this report also provides projected changes to severe
wind/thunderstorms, hail, and freezing rain events.

Canada must adapt to this new reality.
These historical and projected trends point to the need for Canada to adapt its existing
infrastructure now in order to minimize the social and economic costs associated with severe
weather. Given the real threat of climate change, governments, communities, and individual
home and business owners can use the information contained within this report to help make
targeted decisions about how to adapt existing public and private impacts to manage the risks
associated with these events.

                               June 2012      Telling the Weather Story | 6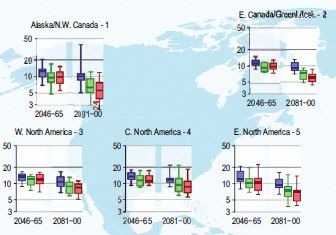
2.	Introduction

Globally and in Canada, there is increasing evidence that the climate is changing. Every day,
international news outlets publish stories about the impact of extreme weather around the
world – from floods in Bangkok to drought in Sudan. In Canada, a recent spike in severe
weather-related events – including severe rainstorms, tornadoes, flooding and forest fires –
has resulted in social and economic consequences for individuals and governments across the
country. As a result of these trends, water losses have now surpassed fire as the number one
cause of home insurance claims in many parts of the country.

This increase in severe weather has raised questions among the public, governments and
insurers about regional changes to the climate: How have weather patterns changed over the
past 40 years, and how are they expected to change in the future? Little research has yet been
undertaken to investigate regional changes in severe weather patterns and projected changes.

The purpose of this report is to tell the story of regional-specific changes in the frequency,
severity and duration of weather events across Canada. This report focuses on both the
observed trends in climate and severe weather over the past 30 to 50 years and projected
trends for the next 40 years, until 2050. The goal is to provide consumers and governments
with information to help them better adapt public and private infrastructure to the realities
of the changing climate, while allowing home and business insurers to plan for future claims
scenarios.

                               June 2012      Telling the Weather Story | 7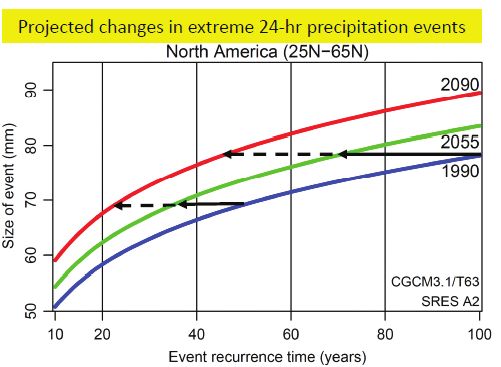
3.	Methodology

This report is based on internationally reviewed climate science, generally as summarized
by the Intergovernmental Panel on Climate Change (see IPCC description in box) and
specifically its Fourth Assessment Report presented to governments in 20071 and its 2012
special report on climate extremes.2 Since the IPCC produces global assessments, specific
information on Canada and its regional variations has been added from publications of
Environment Canada, reviewed scientific articles and a special report prepared by James
P. Bruce3 and commissioned by the Institute for Catastrophic Loss Reduction (ICLR).4 A
narrative summary for each of the seven regions across Canada is provided below in the
Regional Syntheses section.

   IPCC
   The Intergovernmental Panel on Climate Change (IPCC) was established by the United Nations
   Environment Program (UNEP) in 1988 and is responsible for assessing and compiling the most
   recent and best scientific research on climate change. The IPCC is considered the world authority
   on climate change information and periodically releases comprehensive change reports, which
   are used as the basis for climate change policy making worldwide. In 2007, the IPCC was jointly
   awarded the Nobel Peace Prize with Al Gore “for their efforts to build up and disseminate greater
   knowledge about man-made climate change, and to lay the foundations for the measures that are
   needed to counteract such change.”

   Confidence
   The level of confidence in the correctness of a result is expressed in the 2007 IPCC report, using
   a standard terminology defined as follows:

    TERMINOLOGY                              DEGREE OF CONFIDENCE IN BEING CORRECT
    Very high confidence                       At least 9 out of 10 chance of being correct
    High confidence                                      About 8 out of 10 chance
    Medium confidence                                    About 5 out of 10 chance
    Low confidence                                       About 2 out of 10 chance
    Very low confidence                                Less than 1 out of 10 chance

                                 June 2012       Telling the Weather Story | 8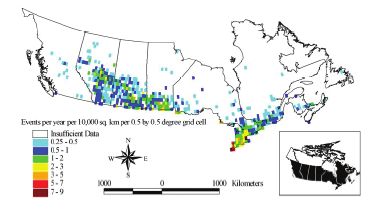
The rate of global climate warming for the next 25 years is projected to be approximately
0.2°C per decade under all scenarios. This rate of change is approximately the same as the
observed global warming rate for the past 25 years of 0.18°C per decade, and is due to the
slow response of the climate system to rising greenhouse gas concentrations. Through to 2050,
the differences among the most likely scenarios of greenhouse gas emissions remain small,
although the rate of global warming is projected to increase slightly as the accumulating
emissions have more effect. There is a scientific basis for extrapolating potential changes
in climate from past records where there is appropriate quality data – including changes to
specific climate parameters, such as rainfall and sea level rise.

There are challenges with any approach that aims to provide specific projections of smaller-
scale climate changes. These include limited past observations of relatively rare occurrences of
extreme events, non-linearities in the climate system and the limited ability of climate models
to provide small-scale details, due to their necessarily global nature. The sources of data and
other information, as well as any specific limitations, are identified throughout this report.

                               June 2012      Telling the Weather Story | 9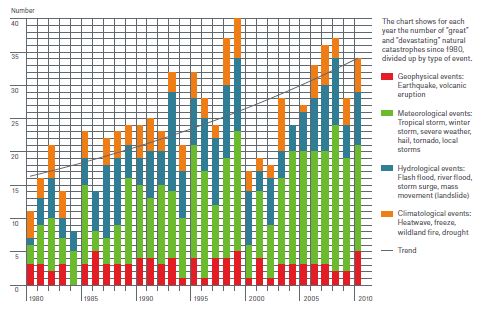
4. Climate Change

4.1       Scientific background
Climate is a complex phenomenon with many facets and variations in both space and time.
What is happening in one place may or may not be an indicator of what is happening in
another. Similarly, last year’s or month’s climate may not be an indicator of the next. Current
understanding of this complex climate system is based on centuries of scientific study, and
the time scales of the climate system are important for understanding projected changes to
the climate. The atmosphere adjusts quickly to changes, but the oceans respond very slowly,
on a time scale of decades. These phenomena influence the response time and magnitude of
change in the climate system as a whole when it is disturbed. Climate and climate change refer
to changes averaged over decades, not year-to-year variations. For the purposes of this report,
“normal” climate is defined as that over a 30-year period.

      Climate
      Climate in a narrow sense is usually defined as the average weather, or more rigorously, as the
      statistical description in terms of the mean and variability of relevant quantities over a period of
      time ranging from months to thousands or millions of years. The classical period for averaging
      these variables is 30 years, as defined by the World Meteorological Organization. The relevant
      quantities are most often surface variables such as temperature, precipitation and wind. Climate in
      a wider sense is the state of the climate system, including a statistical description.

      Atmosphere
      This is the gaseous envelope surrounding the Earth. The dry atmosphere consists almost entirely of
      nitrogen (78.1% of the volume) and oxygen (20.9%), together with a number of trace gases, such
      as argon (0.93%), helium and radiatively active greenhouse gases such as carbon dioxide (0.039%,
      which corresponds to 390 parts per million) and ozone. In addition, the atmosphere contains
      greenhouse gas water vapour, whose amounts are highly variable but typically present around 1%
      of volume. The maximum amount of water vapour that the atmosphere can hold, corresponding
      to 100% relative humidity, depends strongly on its temperature – warm air can hold more water
      vapour. The atmosphere also contains clouds (water in its liquid phase) and aerosols.

      Weather
      Weather includes short-term changes in the atmosphere, and can change over very short periods
      of time. Weather can change from minute to minute, day to day and month to month.

                                   June 2012       Telling the Weather Story | 10
4.2 How is the climate changing globally?
The knowledge about climate change comes from careful analysis of literally thousands of
observations from across the globe over decades, coupled with knowledge of how the climate
system works. Figure 1 shows the global average temperatures since the mid-1800s to 2005.
Over the last 100 years, the best linear fit to the data shows a warming of 0.074°C per decade.
Around 1940, the globe was relatively warm, compared to this trend, and then cooled relative
to the previous decades in the 1950s and 1960s due to a period of active volcanic eruptions.
Climate change
(a) The Intergovernmental Panel on Climate Change (IPCC) defines climate change as “a change in
the state of the climate that can be identified (e.g., by using statistical tests) by changes in the
mean and/or the variability of its properties, and that persists for an extended period, typically
decades or longer. Climate change may be due to natural internal processes or external forcings
or to persistent anthropogenic changes in the composition of the atmosphere or in land use.”
(b) The United Nations Framework Convention on Climate Change (UNFCCC) defines climate
change as “a change of climate which is attributed directly or indirectly to human activity that
alters the composition of the global atmosphere and which is in addition to natural climate
variability observed over comparable time periods.”
Figure 1. Annual global mean temperatures (black dots) with linear fits to the data. The left-hand axis shows
temperature anomalies relative to the 1961 to 1990 average and the right-hand axis shows estimated actual
temperatures, both in °C. Linear trends are shown for the last 25 (yellow), 50 (orange), 100 (magenta) and 150
(red) years. The smooth blue curve shows decadal variations with the decadal 90% error range shown as a pale
blue band about that line. The total temperature increase from the period 1850 to 1899 to the period 2001 to
2005 is 0.76°C ± 0.19°C. The numbers in red show the linear trends in °C per decade for the past 50 years (0.13)
and last 25 years (0.18).6
June 2012 Telling the Weather Story | 11Over the past 50 years, the trend is higher than it was during the past 100 years, doubling to
0.13°C per decade, and for the last 25 years of the record, mean temperature rose by 0.18°C
per decade. Note also that the trend is much more consistent when averaged over a few years,
and the most recent rate of warming approaches being three times higher than over the
century as a whole.
Based on this and other analyses, the IPCC in its 2007 full assessment concluded that the
“warming of the climate system is unequivocal, as is now evident from observations of increases
in global average air and ocean temperatures, widespread melting of snow and ice, and rising
global average sea level.”7
The warming has not stopped. The World Meteorological Organization confirmed the Earth’s
significant long-term warming trend in noting that “2010 ranked as the warmest year on
record, together with 2005 and 1998”... “The ten warmest years on record have all occurred since
1998. Over the ten years from 2001 to 2010, global temperatures have averaged 0.46°C above the
1961–1990 average, and are the highest ever recorded for a ten-year period since the beginning
of instrumental climate records.”8 But the rate of warming is not uniform over the globe
(Figure 2). The Arctic is warming most rapidly, with northern land areas warming more than
the tropics, and oceanic areas generally warming the least.
Figure 2. Patterns of linear global temperature trends from 1979 to 2005 estimated at the surface in °C per decade.
Grey areas indicate incomplete data. 9
June 2012 Telling the Weather Story | 124.3 How is the climate changing in Canada?
Over the period from 1948 to 2010, Canada warmed at an average rate of 0.24°C per decade,
about twice the global average.10 For the far north, the rate was up to three times faster. Over
the past 25 years, the rate of change has approximately doubled (Figure 3 top). The winters
are warming more than the summers although there is large variability from year to year and
within a given year (Figure 3 bottom).
Figure 3.
Annual temperatures
averaged over Canada,
as departures from
1951–1980 average,
from 1948 to 2010 (top).
Seasonal mean
temperatures from 1990
to 2010 (bottom).11
The national average temperature for the year 2010 was 3.0°C above normal, which makes it
the warmest year on record since nationwide records began in 1948 (Figure 3 top and Figure
4 top). All of the country experienced above normal temperatures in 2010, with most of
Nunavut and northern Quebec at least 4°C above normal.12
June 2012 Telling the Weather Story | 13Variations in precipitation are much larger than those for temperature; in addition, there are
inconsistencies in the data across the country and over time. In 2010, for example, there were
significant variations in precipitation across the country (Figure 4 bottom). The variations in
the extremes in temperature and precipitation, and some other variables, are discussed below
in the Regional Syntheses section.
Figure 4. Spatial variations average in
temperature (top) and precipitation
(bottom) changes for 2010,
as departures from 1951–1980 average.13
Nevertheless, it is clear that Canada has, on average, become wetter during the past half
century, with mean precipitation across the country increasing by about 12%.14 Annually
averaged, the largest percentage increase in precipitation has occurred in the high Arctic,
while parts of southern Canada, and particularly the Prairies, have seen little change or a
decline. These trends have led to more transpiration, resulting in decreases in stream flows in
southern Canada by about 8%.15
June 2012 Telling the Weather Story | 145. Weather/Climate-Related Hazards and Disasters
and Their Impacts Around the World
The United Nations International Strategy
Exposure for Disaster Reduction defines a hazard
as a “potentially damaging physical event,
Exposure refers to the people, property,
systems or other elements present in
phenomenon and/or human activity that
hazard zones that are thereby subject to may cause the loss of life or injury, property
potential losses. damage, social and economic disruption
or environmental degradation.”16 Thus, a
Vulnerability windstorm, flood or hot day may be defined
Vulnerability is the degree to which a
as a hazard. A major impact occurs when
system is susceptible to, and unable to the hazard affects an exposed and vulnerable
cope with, adverse effects of climate community, structure and person, where
change, including climate variability and vulnerability depends on the physical, social,
extremes. Vulnerability is a function of the economic and environmental factors or
character, magnitude and rate of climate processes that together make the affected
change and variation to which a system entity vulnerable.
is exposed, its sensitivity and its adaptive
capacity. Averaged over the past 10 years, there have
been 785 natural catastrophes in the world
For example, a flooded river, per se, is not a per year. In 2010, there were a total of 950
disaster. However, a disaster occurs when natural catastrophes, nine-tenths of which
a flood interacts with a vulnerable system, were weather-related events such as storms
such as an exposed community located in
and floods.17 Munich Re defines a great
a flood plain.
natural catastrophe as any one or more of
the following four situations: (1) number
of fatalities exceeds 2,000; (2) number of
homeless exceeds 200,000; (3) the country’s Gross Domestic Product (GDP) is severely hit;
and/or (4) the country is dependent on international aid.18 As shown in Figure 5, over the past
25 years there has been an upward trend in the number of great natural catastrophes, with
meteorological and hydrological events being the main drivers.
Climate change is likely responsible, at least in part, for the rising frequency and severity of
extreme weather events, such as floods, storms and droughts, since warmer temperatures tend
to produce more violent weather patterns.19 As a result, weather events that used to happen
once every 40 years are now happening once every six years in some regions in the country.20
M. Wahlström, the UN Assistant Secretary-General for Disaster Risk Reduction, stated in
2008, “Over the last two decades (1988–2007), 76% of all disaster events were hydrological,
meteorological or climatological in nature; these accounted for 45% of the deaths and 79% of the
economic losses caused by natural hazards. The real tragedy is that many of these deaths can be
avoided.”21 In this context, “hydrological, meteorological or climatological” events are climate
June 2012 Telling the Weather Story | 15Figure 5. The number of “great” and “devastating” natural catastrophes (as defined by Munich Re) since 1980,
indicated by type of event.
Extreme weather event
An extreme weather event is an event that is rare at a particular place and time of year. Definitions
of “rare” vary, but an extreme weather event would normally have less than a 1 in 10 chance of
occurring. By definition, the characteristics of what is called extreme weather may vary from place
to place in an absolute sense. Single extreme events cannot be simply and directly attributed to
anthropogenic climate change, as there is always a finite chance the event in question might have
occurred naturally. When a pattern of extreme weather persists for some time, such as a season, it
may be classed as an extreme climate event, especially if it yields an average or total that is itself
extreme (e.g., drought or heavy rainfall over a season).
and weather and related events (heat waves, freezes, wildland fires, drought, tropical storms,
winter storms, severe weather, hail, tornado and local storms, flash floods, river floods, storm
surges and mass movements/landslides).
Citizens rely on the property and casualty insurance industry to help carry the costs of
property damage resulting from severe weather-related events. Over the past decade, global
insured losses from natural catastrophes ranged between $10B and $50B a year.22 Relative to
climate risk and its disclosure by insurers, S. Leurig notes in a Ceres report, “This changing
climate will profoundly alter insurers’ business landscape, affecting the industry’s ability to
price physical perils, creating potentially vast new liabilities and threatening the performance
of insurers’ vast investment portfolios.”23
June 2012 Telling the Weather Story | 166. Weather/Climate-Related Hazards and Disasters
and Their Impacts in Canada
Within Canada, recent trends have seen an increase in property insurance claims resulting
from catastrophic weather-related events. Catastrophic events over the past three years have
cost roughly $1B a year. Most of these insured losses were caused by extreme weather events.
In 2010 and 2011, storms in both summer and winter resulted in major claims for Insurance
Bureau of Canada’s (IBC’s) member companies. For example:
• On June 5 to 6, 2010, the southern Ontario town of Leamington and surrounding
areas experienced a wind and thunderstorm event that resulted in estimated insured
losses of $120M to both residential and commercial properties.24
• From July 12 to 13, 2010, Calgary and other areas in southern Alberta were
pummelled with a brutal thunderstorm in which homes, businesses and automobiles
were damaged, resulting in estimated insured losses of $500M.25
• On September 20 to 21, 2010, strong winds and sewer backup from Hurricane Igor
resulted in an estimated $70M in insured damage to Newfoundland and Labrador
homes and businesses.26
• Over the month of December 2010, it is estimated that IBC’s member companies
paid a total of $50.7M in home, business and auto claims as a result of winter storms
throughout Atlantic Canada.27
• In 2011, after a cool spring, much of Canada was under oppressive heat for most
of the summer, with new record temperatures set in many locations. While arson
is suspected to be the cause of the May forest fires in Slave Lake, Alberta, high
temperatures may have contributed to the spread of the fire, which resulted in
approximately $700M in insured losses.
• On August 21, 2011, an F3 tornado struck Goderich, Ontario, killing one, injuring
37 and costing insurers an estimated $110M in insured losses.28
• Between August 28 and 30, 2011, flooding and windstorms from Hurricane Irene
resulted in insured losses estimated at approximately $130M in New Brunswick,
Ontario and Quebec.29
June 2012 Telling the Weather Story | 17Canada’s home and business insurers are also seeing an increase in claims resulting from
weather-related events that fall below the threshold for the definition of “catastrophe,” but
nevertheless result in significant property damage for consumers. For example, on March 5,
2011, Ontario and Quebec saw record rainfall. In the aftermath, Crawford & Company claims
adjusters saw a 300% increase in claims volume for branches and local contractors.30
Infrastructure failure is linked to much of the damage caused to homes and businesses by
these severe weather events.31 A significant long-term deficit in infrastructure improvement
has left sanitary/surface water systems vulnerable as, in some areas of the country, the
storm and sanitary sewer infrastructure is simply unable to handle the increasing levels of
precipitation.
June 2012 Telling the Weather Story | 187. Why Is the Climate Changing?
There are many reasons why the climate can change, including variations in the Earth’s orbit
around the sun, which has been the principal cause of the ice ages of the past. Volcanic
eruptions can cause short-term cooling of the climate, usually lasting a few years. Impact
by asteroids from outer space can also change the climate. Within the climate system, there
are variations, such as changes in ocean temperature, that can alter the climate for years or
decades. The concern now is that human activities are aggravating changes to the natural
greenhouse effect, which is a phenomenon that for the last 10,000 years or more has warmed
our climate by about 33°C, allowing human life to develop as it has.
The most important greenhouse gas is water vapour.
The water content of the atmosphere is almost at
Greenhouse gases
capacity most of the time. If more water is added,
Greenhouse gases are those it precipitates out. However, if the climate warms,
gaseous constituents of the
the atmosphere can hold more water vapour, which
atmosphere, both natural and
increases the greenhouse effect, causing more
anthropogenic, that absorb
warming; this is called a positive feedback effect.
and emit radiation at specific
wavelengths within the spectrum Carbon dioxide, the next most important greenhouse
of thermal infrared radiation gas, is now less than 0.04% of the atmosphere. Carbon
emitted by the Earth’s surface, dioxide on Earth has, on average, a lifetime in the
the atmosphere itself, and by atmosphere of about 100 years (range: 50–200 years),
clouds. This property causes the with the oceans largely determining the amount and
greenhouse effect (IPCC definition). lifetime through their uptake, storage and release of
carbon dioxide. Methane, the third most important
The main greenhouse gases are
gas, has a lifetime of about 10 years in the Earth’s
water vapour, carbon dioxide,
atmosphere. Because it takes only a few years for a
nitrous oxide, methane and ozone.
greenhouse gas to mix around the globe, emissions in
one location affect the global climate.
For most of the past 10,000 years, the atmospheric carbon dioxide concentration was about
280 parts per million (ppm) by volume. Human-generated greenhouse gases (mainly carbon
dioxide and, to a lesser extent, methane) really started as land was cleared for agriculture,
followed by urban development and industrialization, and the use of fossil fuels (coals, oil,
gas) for energy beginning in the 1800s. The atmospheric concentration passed 300 ppm in
1900, reached about 325 ppm by the mid-1950s, and is now about 390 ppm. Atmospheric
methane concentrations have more than doubled in the last 100 years. These additional
greenhouse gases cause the climate to warm at a greater rate as it adjusts to the additional
energy being retained. Because of the time it takes for the oceans to heat up, the atmospheric
climate is always lagging behind the increased greenhouse concentrations. Global carbon
June 2012 Telling the Weather Story | 19dioxide emissions, mainly from use of fossil fuels, are increasing now more rapidly than
before: For the period 1990–1999, the average year-to-year increase was 0.9%. For the period
2000–2007, the rate of growth increased almost four fold to 3.5%.
Based on a careful analysis of climate of the past few decades and consideration of all possible
causes for the changes, the IPCC (2007) concluded that “Most of the observed increase in
global average temperatures since the mid-20th century is very likely due to the observed increase
in anthropogenic (man-made) greenhouse gas concentrations.”32 Variations in the sun and other
“natural” occurrences do not explain the warming over the past few decades.
June 2012 Telling the Weather Story | 208. Projecting the Future
Section 4, Climate Change, described the past climate, and Section 7, Why is the Climate
Changing?, described and explained the changes over the past 50 years. This section presents
estimates for the future based on future emissions scenarios and projections from the
historical trends. Plausible future emissions scenarios depend on future development of the
activities that affect atmospheric concentrations of greenhouse gases (e.g., population growth,
production, consumption of fossil-fuel-based energy and government policies to reduce the
net emissions of greenhouse gases into the atmosphere). A range of such emissions scenarios
was prepared by the Intergovernmental Panel on Climate Change and has been used in its
reports to project future climate change.
Emissions scenarios
An emissions scenario is a plausible representation of the future development of emissions of
substances that are potentially radiatively active (e.g., greenhouse gases, aerosols), based on a
coherent and internally consistent set of assumptions about driving forces (such as demographic
and socio-economic development, technological change) and their key relationships. Four
emissions scenario “family storylines” set out distinct directions for global development through the
year 2100. The storylines and associated population, GDP and emissions scenarios – associated with
the Special Report on Emissions Scenarios (SRES) – were developed by the IPCC to assist in climate
change projections. Illustrations and key themes of the four family storylines are provided below.
A1: Rapid, globalized economic development; global population rising and peaking mid-century
and subsequently declining; rapid introduction of new and more efficient technologies. Key
themes: global, economic development. A commonly used variation on this scenario, called
A1B, incorporates more aggressive assumptions with respect to the growth utilization of non-
fossil fuels.
A2: Slower, regionally oriented economic development; continuously growing global population;
slower per capita economic growth and technological change than in the other storylines. Key
themes: regional, economic development.
B1: Same population scenario as in A1, but with a rapid shift toward service and information
economies; reduced material consumption complimented with introduction of clean and
resource efficient technologies; global emphasis on solutions to economic, social and
environmental sustainability. Key themes: global, sustainable development.
B2: Continually increasing population, at a lower rate than A2; less rapid economic and
technological development than in A1 and B1; emphasis on regional/local solutions to
economic, social and environmental sustainability. Key themes: regional, sustainable
development.
June 2012 Telling the Weather Story | 21This report uses the IPCC scenarios described in the box above, coupled with historical
trends, to discuss future climate projections for each of seasonal average temperatures,
seasonal average precipitation, extreme events and other relevant climatic parameters. To
the extent possible, scenario A2 is used as the basis for the projections, insofar as it appears
to be the most realistic, in view of recent emissions increases and the lack of progress in
negotiations to reduce the drivers of climate change.
The primary focus of the projections in this report is on the period to 2050, or the next 40
years of climate. Note that for some indicators, adjustments have had to be made to the
available scientific analyses in order to fit within this time frame. The starting point for
projections is 2010.
8.1 Projections of seasonal average temperatures
For the next two decades, a global warming rate of at least 0.2°C per decade is projected,
regardless of the scenario, due to the slow response of the climate system. In fact, even if the
concentrations of all greenhouse gases and aerosols are assumed to remain constant at year
2000 levels, a further warming of about 0.1°C per decade would be expected.33 For the A2
scenario, the globe is projected to be 1.5°C warmer in 2050 and 3.8°C in 2100, with a 2000–
2050 warming rate of 0.3°C per decade.
The changes in temperature and other climate
variables will not be uniform over the globe and
will also change by season. The broad geographical Climate isotherms
patterns of change will be similar to those observed Isotherms refer to boundary lines
over the past several decades, with the warming placed on a map to delineate
greatest over land and at most high northern between geographic areas that
latitudes, and least over the Southern Ocean and share average yearly temperatures.
parts of the North Atlantic Ocean. Climate isotherms provide the
same function as contour lines on
With the warming, there will be a general shift an elevation map. A poleward shift
poleward in the mean climate isotherms (lines of the in mean climate isotherms means
same temperature in full degrees Celsius), and by that northerly areas will experience
2050, these isotherms will move about half the way warmer average temperatures that
northward toward the next northerly isotherm. This are normally associated with more
means that mid-latitude westerly weather flows will southerly areas.
be displaced northward and strengthen, this being
most pronounced in the autumn and winter. For
most of Canada, the winters will warm more than summers, a trend that has already been
happening. In the summer, southern Canada will generally warm more than the north, due
to the cooling influence of the open waters of the Arctic regions. At this time of year, the
largest warming will be centred in the U.S. west, extending north into southwestern Canada.
In the winter, the opposite is true – northern Canada will warm more than the southern parts
of the country.
June 2012 Telling the Weather Story | 228.2 Projections of seasonal average precipitation
The IPCC also stated that “Increases in the amount of precipitation are very likely in high-
latitudes, while decreases are likely in most subtropical land regions (by as much as about 20%
in the A1B scenario in 2100...), continuing the observed patterns in recent trends.”34
In the summer, there will be reductions in average precipitation in southwestern Canada and
about the same in eastern Canada. In the winter, average precipitation will increase over all
of Canada but more of it will fall as rain than snow. As a result of the warming, there will be
changes in snow cover (Figure 6) such that over much of Canada the March snow cover will
decrease by mid-century by over 50%. In the far north, the snow cover will increase due to the
increased precipitation with warmer, but not above freezing, conditions.
Figure 6. Percent changes in snow depth in March for
mid-century (averaged over the period 2041 to 2070)
under IPCC A2 emissions scenario, compared to the
1961 to 1990 period. The calculation is only done where
climatological snow amounts exceed 5 mm of water
equivalent. From IPCC.35
There will be more frost-free days as the winter shortens and the summer lengthens.
Approximately half of the extensive permafrost regions in northern Canada are projected to
disappear eventually with climate warming. Many areas of now permanent permafrost will
shift to discontinuous permafrost.36 These changes, along with increases in the number of
freeze-thaw cycles, will have major impacts on roads, bridges and other infrastructure in the
north, including the northern parts of many provinces.
June 2012 Telling the Weather Story | 238.3 Projections of changes in extreme events
Although changes in mean temperature are important, the changes in extremes are more
important in consideration of severe events. The IPCC 2012 special report on climate
extremes notes, “A changing climate leads to changes in the frequency, intensity, spatial extent,
duration, and timing of extreme weather and climate events, and can result in unprecedented
extreme weather and climate events.”37 The possibility of “unprecedented” extreme events
is important in terms of strategies for risk reduction. The report also concluded that “The
severity of the impacts of climate extremes depends strongly on the level of the exposure and
vulnerability to these extremes” and that “Extreme and non-extreme weather or climate events
affect vulnerability to future extreme events, by modifying resilience, coping capacity, and
adaptive capacity.”
With respect to extremes, note that even if there is no change in distribution of variations
around the mean, the frequency of occurrence of values above a set threshold increases
(Figure 7).
Figure 7. Schematic showing the effect on extreme temperatures when the mean temperature increases, for a
normal temperature distribution. From IPCC.38
Based on scientific analysis of climate model projections, the IPCC assessed the likelihood
of future trends in climate extremes (see Table 1) and concluded that “It is very likely that hot
extremes, heat waves and heavy precipitation events will become more frequent.”39
June 2012 Telling the Weather Story | 24LIKELIHOOD OF FUTURE
LIKELIHOOD THAT TREND TREND FOR 21 ST CENTURY
PHENOMENON AND OCCURRED IN 20 TH CENTURY BASED ON PROJECTIONS
DIRECTION OF TREND (TYPICALLY POST-1960) USING IPCC SCENARIOS
Warmer and fewer cold
days and nights over most Very likely Virtually certain
land areas
Warmer and more frequent
hot days and nights over Very likely Virtually certain
most land areas
Warm spells/heat waves:
frequency increases over Likely Very likely
most land areas
Heavy precipitation events:
frequency increases over Likely Very likely
most areas
Area affected by droughts Likely in many regions
Likely
increases since 1970s
Intense tropical cyclone Likely in some regions
Likely
activity increases since 1970s
Increased incidence of
extreme high sea level Likely Likely
(excludes tsunamis)
Table 1. Climate extremes modified from IPCC Summary for Policy Makers.40 In this table, recent trends, assessment of
human influence on trends, and projections of extreme weather and climate events for which there is evidence of an
observed late 20th-century trend are presented.
Notes: Changes in frequency of coldest and hottest days and nights refer to the coldest or hottest 10%. Extreme high
sea level depends on average sea level and on regional weather systems. It is defined here as the highest 1% of hourly
values of observed sea level at a station for a given reference period. Changes in observed extreme high sea level closely
follow the changes in average sea level.
June 2012 Telling the Weather Story | 258.4 Projections of changes in hot days and heat waves
A “return period,” also known as a recurrence interval, is an estimate of the likelihood of
events such as exceeding a maximum daily temperature. “Return values” are thresholds that
will be exceeded on average once every return period.
The IPCC has projected that the number of hot days will increase. The projected return
periods for the maximum daily temperature that previously was exceeded on average once
during a 20-year period in the late 20th century (1981–2000) will decrease, implying that hot
days will happen more frequently (Figure 8). For example, for western North America (region
3 on Figure 8), a hot day temperature that occurred only once in 20 years in the period 1981–
2000, for the period 2046–2065 will occur every three to four years with an uncertainty of
occurring between 1.5 and six years, depending on the emissions scenario.
Figure 8. Projected return periods for the maximum
daily temperature that was exceeded on average
once during a 20-year period in the late 20th
century (1981–2000). The box plots show results
for regionally averaged projections for two time
horizons, 2046 to 2065 and 2081 to 2100, compared
to the late 20th century, and for three different
emissions scenarios (from the IPCC’s Special Report
on Emissions Scenarios, or SRES) (B1, blue; A1B,
green; A2, red). The boundaries of the regions are
shown in the lower right. From IPCC.41
Environment Canada’s Canadian Centre for Climate Modelling and Analysis has conducted
scientific simulations of future climates. The number of hot days (days with a maximum
temperature over 30°C) is projected to increase across Canada (Figure 9). For example, these
model simulations show that Toronto would go from about 12 hot days in the period 1961–
1990, to about 37 in the period 2041–2069, which implies that the increase in hot days will
escalate over the period.
Figure 9. The number of hot days
(days with a maximum temperature over 30°C)
projected for several Canadian cities
by Environment Canada.
June 2012 Telling the Weather Story | 268.5 Projections of changes in precipitation intensity
As it did for heat waves, the IPCC examined the projected changes in return periods for a
daily precipitation event that was exceeded in the late 20th century on average once during a
20-year period (1981–2000) (see Figure 10). For example, for western North America (region
3), a daily precipitation event that occurred once every 20 years before is projected to occur
every 12 years, with an uncertainty of 7 years to 17 years. Thus there will be less time between
heavy precipitation events on average.
Figure 10. Projected return periods for a daily precipitation event that was exceeded in the late 20th century
on average once during a 20-year period (1981–2000). The box plots show results for regionally averaged
projections for two time horizons, 2046 to 2065 and 2081 to 2100, compared to the late 20th century, and
for three different SRES emissions scenarios (B1, blue; A1B, green; A2, red). The boundaries of the regions are
shown in the lower right of Figure 8. From IPCC. 42
The Canadian Centre for Climate Modelling and
Return period Analysis has also conducted scientific simulations of
A return period is the average projected changes in 24-hour extreme precipitation
time between occurrences of a events (Figure 11) for the projections of the event
defined event. The return value recurrence time (in years) for events of a given
is the highest (or, alternatively, magnitude.
lowest) value of a given variable, on
This return period analysis is used to project changes
average occurring once in a given
period of time (e.g., in 10 years). in future return values of extreme rainfall events for
a number of return periods. Scientific information
on changes to future return values of extreme rainfall
events is needed to be able to take into account
climate change impacts on infrastructure and to develop adaptation strategies and policies.
For example, the design criteria for storm water infrastructure are constrained by the largest
precipitation event anticipated during a fixed design period (e.g., 20, 50 or 100 years).
June 2012 Telling the Weather Story | 27Figure 11. Projections of the event recurrence time (in years) for extreme precipitation events of a given
magnitude (Environment Canada, based on the IPCC A2 scenario).
Figure 11 demonstrates that an event of, for example, 70 mm of rain over 24 hours (which has
occurred on average about once every 50 years averaged across North America in the latitude
band 25N to 65N) would occur statistically about once every 25 years
by 2090.
A 2011 paper published in the Journal of Climate on projected changes in extreme
precipitation characteristics over Canada found quite similar results in comparing two
methods: the 20-year return level of one-day precipitation extremes for the 2041–2070
period increases between 3 and 10 mm when compared to the 1961–1990 period; and the
20-year return level of seven-day precipitation extremes increases between 9 and 20 mm. The
conclusions of this paper include the statement that “an increase in magnitude of short (i.e.,
1-day) and longer (i.e., 7-day) duration precipitation extremes will have severe implications for
various water resource–related development and management activities such as combined sewer
systems, flood control in fast responding areas, and water storage systems, etc.”43
June 2012 Telling the Weather Story | 288.6 Projections of changes in large-scale extreme winds
Because there have been few studies of storm-related extreme winds and because of the
difficulty of simulating wind events in climate models, it is not possible to say with high
confidence how extreme winds will change in the future. However, a new study projects
average changes in the means of the daily averaged wind speeds (for the height of 10 m above
ground) for the period 2081–2100 relative to 1981–2000, based on the results from 19 global
climate models.44 For the period December to February, winds are projected to increase by
more than 10% along the west coast of British Columbia; across most of northern Canada;
in areas across eastern Manitoba and northern Ontario; and extending south over parts of
the Great Lakes and northwestern Quebec. For the June to August season, wind speeds are
projected to increase across northwestern Canada, the upper Great Lakes, most of Quebec
and Atlantic Canada.
An area where there is greater confidence is the mean tropical cyclone maximum wind speed,
which appears likely to increase, although increases may not occur in all ocean basins. As the
sea surface temperatures increase in the Atlantic Ocean, tropical cyclones – called hurricanes
in the Atlantic oceanic areas – will likely gain in energy, bringing impacts on eastern and
especially Atlantic Canada that are a concern.
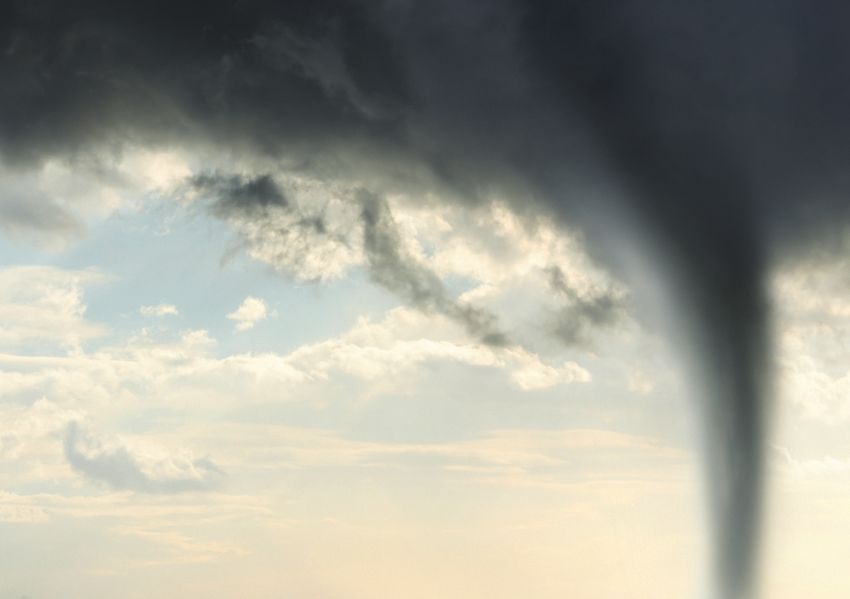
8.7 Projections of changes to tornadoes, hailstorms
and other small-scale extreme events
In Canada, tornadoes are currently observed (Figure 12) mainly in Ontario (19 per year),
Saskatchewan (15) and Alberta (13),45 with the most deaths coming from tornadoes in
Ontario and Saskatchewan. The Maritime provinces rarely experience the severe types of
thunderstorms that can spawn tornadoes, mainly because they don’t have the dry conditions
high in the atmosphere that are needed to create the necessary unstable conditions. Tornadoes
are most common in flat terrain and in areas with little water. Mountainous terrain tends
to break up the circulation that creates tornadoes, and the cooling effect of water tends to
stabilize the atmosphere. The conditions that create tornadoes occur mostly during warm
months, with more than three-quarters occurring in June, July and August.
Figure 12. Observed tornado frequencies in Canada.46
June 2012 Telling the Weather Story | 29In Canada, most tornadoes are relatively weak on the Fujita Scale (see table below) – over 50%
are either in the F0–F2 range or of unknown scale because the scale can only be determined
if the tornado impacts a structure or community. About 2% are F3 and 0.3% are F4; the first
observed F5 tornado occurred in Elie, Manitoba, on June 22, 2007. The United States receives
on average over 1,000 tornadoes each year and about 20 are F5 tornadoes.47 The two tornado
“alleys” in Canada – southwestern Ontario, and across the southern parts of the Prairies – are
both extensions of tornado alleys in the United States.
Fujita Tornado Scale
Maximum
wind
speed
Rating Event type (km/h) Type of damage done
F0 Gale tornado 64–116 Some damage to chimneys; breaks branches
off trees; pushes over shallow-rooted trees;
damages sign boards.
F1 Moderate tornado 117–180 The lower limit is the beginning of hurricane
wind speed; peels surface off roofs; mobile
homes pushed off foundations or overturned;
moving autos pushed off the roads; attached
garages may be destroyed.
F2 Significant tornado 181–252 Roofs torn off frame houses; mobile homes
demolished; boxcars pushed over; large trees
snapped or uprooted; light object missiles
generated.
F3 Severe tornado 253–330 Roofs and some walls torn off well-constructed
houses; trains overturned; most trees in forest
uprooted.
F4 Devastating tornado 331–417 Well-constructed houses levelled; structures
with weak foundations blown off some distance;
cars thrown and large missiles generated.
F5 Incredible tornado 418–509 Strong frame houses lifted off foundations and
carried considerable distances to disintegrate;
automobile-sized missiles fly through the air
in excess of 100 metres; trees debarked; steel
reinforced concrete structures badly damaged.
For small-scale extreme events such as tornadoes, hailstorms and thunderstorms, there are
considerable difficulties in making specific projections. There are several reasons for this,
including the fact that climate models do not simulate these small-scale phenomena, as well as
competing physical processes that may affect future trends. As the IPCC 2012 special report
concluded, “There is low confidence in observed trends in small spatial-scale phenomena such as
tornadoes and hail because of data inhomogeneities and inadequacies in monitoring systems.”48
June 2012 Telling the Weather Story | 30Reported tornado and thunderstorm occurrences in the United States over the past 50 years
show an increasing trend, but this is thought mainly to reflect increased population density
and increased numbers of people in remote areas49,50 making it more likely that these storms
will be observed. A warming climate creates unstable atmospheric conditions that lead to
these kinds of extreme events, but it also reduces the pole-to-equator temperature gradient,
somewhat offsetting this risk. As yet, the scientific literature has been limited in resolving
these issues.51
Following a major tornado outbreak in April 2011, the U.S. National Oceanic and
Atmospheric Administration issued a report that ends with the statement, “So far, we have
not been able to link any of the major causes of the tornado outbreak to global warming.
Barring a detection of change, a claim of attribution (to human impacts) is thus problematic,
although it does not exclude that a future change in such environmental conditions may occur as
anthropogenic greenhouse gas forcing increases.”52
In view of the deficiencies in the observational base and noting the concluding part of the
preceding quote, it is appropriate to undertake a risk analysis of tornado risk in Canada in
the context of a changing climate. This analysis leads to the conclusion that risk-management
strategies should assume that there will be more frequent events in the future.53
In view of the distribution of tornadoes in Canada, it is important to note the impacts of
tornadoes in the United States over the past 30 years in terms of their economic costs. Almost
all the severe weather events where economic losses were greater than $1B (mostly tornados)
have been located within a region from Texas–Oklahoma, across Kansas–Missouri and into
Illinois. Although climate warming does not simply transfer weather elements poleward,
translating this region of extreme events northward would put it into southwestern Ontario.
June 2012 Telling the Weather Story | 318.8 Projections of changes in wildland fires
As was tragically demonstrated this year in Alberta and Ontario, wildland fires can have great
impacts on Canadians. Several studies have been conducted to project the changes in wildland
fires across Canada. This section relies mostly on the most recent research by Wotton et al.,
2010.54 A wildland fire model was developed and tested with two global climate models, and
then projections of future fire occurrence levels across Canada were made for 2030 and 2100
with the Canadian model, and for 2100 with the United Kingdom model. The study shows
that most fires are started either by lightning or human activities. While fire activity increases
across all of the studied forested regions in Canada, there are major regional variations. The
Canadian simulations suggest an increase in overall fire occurrence of 25% by 2030 and 75%
by the end of the century, while the United Kingdom model projected an increase of 150% by
the end of the century. (See Figure 13.)
At present, through active forest fire management, fires in Canada are suppressed and, in most
cases, kept to a very small size. Notably, it is the 3% of fires that escape initial containment
and lead to large fires with area burned greater than 200 hectares that account for over 97% of
the total area burned. Studies have shown that in Canada, there is approximately 100,000 km2
more area burned per degree Celsius of temperature increase.
Figure 13. Relative change (% increase) in fire occurrence between future and baseline scenarios for the
Canadian model due to lightning (left) and human activities (right). Relative change is given as the percentage
increase in the number of fires predicted divided by the total number of fires in baseline. For the 2030 period,
the largest percentage changes in the total number of fires are in Ontario and the Northwest Territories, both
at 46%.
June 2012 Telling the Weather Story | 32You can also read