Tesla's Entry into the U.S. Auto Industry - MIT Sloan
←
→
Page content transcription
If your browser does not render page correctly, please read the page content below
18-188
May 1, 2019
Tesla’s Entry into the U.S. Auto Industry
Donald Sull and Cate Reavis
In March 2016, CEO Elon Musk unveiled the company’s latest electric car, the Model 3, in front of an
audience of 800 Tesla owners and fans. Musk enthusiastically explained how Tesla’s earlier electric
vehicles (EVs) – the Roadster, Models S and X – had paved the way for the company to design and
manufacture an EV “for the masses.” The baseline $35,000 Model 3 could accelerate from 0 to 60 miles
per hour in six seconds, and its 75-kilowatt hour (kWh) battery had a range of 220 miles (the range
increased to 310 miles with a long-range battery option). Deliveries of the car would begin at the end
of 2017. Musk boasted to the audience that the company had already secured 115,000 pre-ordered cars
at $1,000 per car (a number that would grow to 500,000 pre-orders by 2018).1
By August 2018, Musk’s enthusiasm had turned to misery, laid bare in a New York Times article entitled
“Elon Musk Details ‘Excruciating’ Personal Toll of Tesla Turmoil.”2 Working up to 120 hours a week
and sleeping on the factory floor, Musk was closely supervising the production of the Model 3. He
described Tesla as being in a state of “production hell.” The company had paused production in late
February and again in April to work out bottlenecks in its highly automated factory, staffed with over
1,000 robots.3
During a call with equity analysts in May 2018, Musk’s misery was palpable. He became testy,
characterizing a question about the company’s capital requirements as “boring.”4 But it was a legitimate
question. In the second quarter of 2018, the company recorded a net loss of $743 million on revenue of
$4 billion. Analysts estimated that the company needed to produce at least 5,000 units a week to turn a
profit in 2018.5 Some wondered whether Tesla would run out of cash by the end of the year.6 (See the
Tesla Financials tab in the Tesla case workbook for additional financial data.)
This case was prepared by Senior Lecturer Donald Sull and Cate Reavis, Associate Director, Curriculum Development.
Copyright © 2019, Donald Sull. This work is licensed under the Creative Commons Attribution-Noncommercial-No Derivative
Works 3.0 Unported License. To view a copy of this license, visit http://creativecommons.org/licenses/by-nc-nd/3.0/ or send a
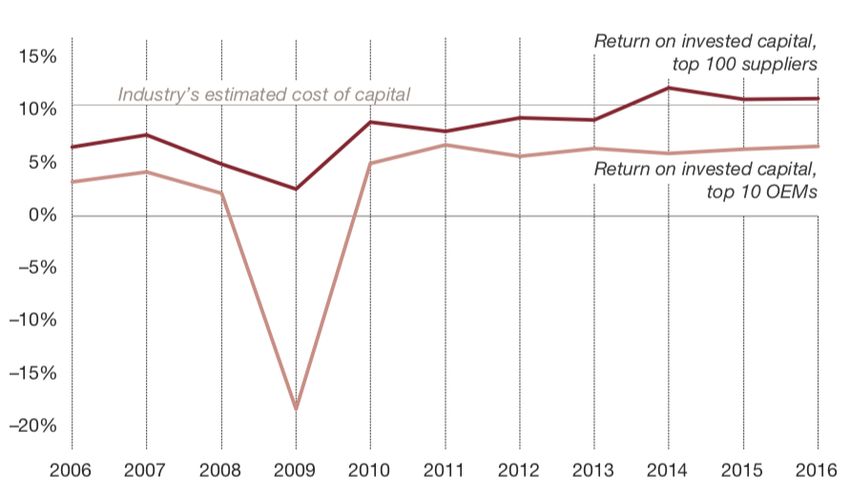
letter to Creative Commons, 171 Second Street, Suite 300, San Francisco, California 94105, USA.TESLA’S ENTRY INTO THE U.S. AUTO INDUSTRY Donald Sull and Cate Reavis In The New York Times article, Musk remarked, “The worst is over from a Tesla operational standpoint.”7 The company was finally producing 5,000 Model 3s a week after missing the original production goal by more than six months.8 As he worked to get production ramped up before the company’s cash ran out, Musk admitted on Twitter to one mistake: “Yes, excessive automation at Tesla was a mistake. To be precise, my mistake. Humans are underrated.”9 Investors and auto industry experts were split on Tesla’s future. Some believed that Tesla would create value by disrupting the traditional automobile industry, all while achieving its stated mission to accelerate the world’s transition to sustainable energy. Skeptics disagreed. “Tesla,” according to one prominent investor, “without any doubt, is on the verge of bankruptcy.”10 The Traditional Automobile Industry Industry Overview The new passenger car marketa in the United States was worth about $270 billion at the retail level in 2016.11 While the industry experienced a sharp downturn during the 2008 Great Recession, sales had rebounded by 2013 as the U.S. economy swung into recovery. With higher disposable incomes and easier access to credit, Americans, including Millennials born after 1980, flocked to dealerships. By 2016, the market’s momentum had slowed. Sales (by value and volume) were expected to remain flat until 2021 (Exhibits 1a and 1b). The average sales price of a new car was $35,500 (Exhibit 2). Americans were buying big cars. Of the nearly 7 million new cars sold in the United States in 2016, 60% were pickups and SUVs.12 However, industry analysts expected demand for small cars to comprise 20% of new car model launches by 2023, compared to 15% between 2008 and 2017 (Exhibit 3). Some also predicted that by 2025 nearly 60% of new vehicles (trucks and buses included) sold in the United States would offer some form of alternative propulsion (e.g., EVs, hybrids, and fuel cellb cars).13 Automakers In 2018, three U.S. automakers accounted for nearly 46% of the U.S. car industry’s market share by volume. General Motors (GM) led the market with a 17.9% share, followed by Ford with 14.7%, and Chrysler with 12.9% (Exhibit 4).14 Toyota was the leading non-U.S. manufacturer with 13.5% by volume. Tesla held a 0.2% market share. (See the Competitors tab in the Tesla case workbook for additional financial data.) Automakers, who were sometimes referred to as original equipment manufacturers or OEMs, had historically earned low returns on their investments. The operating margins (operating income as a percentage of sales) of GM, Ford, and Chrysler were 7.4%, 6.4%, and 3.2%, respectively. a Passenger cars include sedans, hatchbacks, SUVs, 4x4s, and other related vehicles that have four wheels and have no more than eight seats in addition to the driver’s seat. b A fuel cell car is a type of electric vehicle that uses a fuel cell instead of or together with a battery. A fuel cell uses hydrogen and oxygen to produce electricity. May 1, 2019 2
TESLA’S ENTRY INTO THE U.S. AUTO INDUSTRY
Donald Sull and Cate Reavis

OEMs faced significant barriers to exit. The automotive sector employed nearly 3 million people in the
United States – nearly 1 million in manufacturing and 2 million in retail – and politicians at the federal,
state, and local levels were keen to protect those jobs.15 The automakers’ resources, including factories
and brands, were highly specialized and could not be easily redeployed to other uses. Not one of the
“Big Three” U.S. manufacturers had left the market, even during the 2008 Great Recession when their
manufacturing capacity utilization fell below 33% (Exhibit 5). Both Chrysler and GM declared
bankruptcy in 2009. The federal government rescued GM, and Chrysler was acquired by Italy-based
Fiat. Within two years, GM had returned to profitability, although it continued to earn low returns on
investment.

Customers demonstrated little brand loyalty when it came to the cars they bought. Eighty percent
switched brands when trading in a car and buying a new one. Customers of Toyota’s luxury brand
Lexus were the most loyal; but even among Lexus owners, only 30% replaced their trade-in with
another Lexus. Replacement rates for other luxury brands were lower, considerably so for some:
Mercedes-Benz, 28%; BMW, 24%; Porsche, 22%; Audi, 16%; and Jaguar, 12%.16

Wall Street was not convinced that the traditional automotive OEMs were well positioned to respond
to significant industry shifts brought on by startups like Tesla and technology companies with deep
financial pockets like Google and Apple. New entrants were investing heavily in EVs, autonomous
driving, and mobility services – technologies and services that enabled goods and people to move
around more freely.17 As the industry moved from selling cars to providing mobility services, the
sources of industry revenues and profits were projected to shift (Exhibits 6a and 6b).18

New Entrants
The barriers to entering the auto industry were high. New entrants had to contend with creating brand
loyalty, building manufacturing capabilities and factories, developing a dealer network, and attaining
the capital requirements to develop and build a new car, which could be as much as $6 billion and take
up to six years.19 Research and development (R&D) expenditure for OEMs based in the United States
was about 5% of revenue. Six automakers were among the world’s most valuable brands, including
Toyota with an estimated brand value of $45 billion, Mercedes-Benz ($34 billion), BMW ($31 billion),
Honda ($26 billion), Audi ($14 billion), and Ford ($14 billion).20 Exhibit 7 shows how much the ten
largest OEMs spent on capital expenditure, R&D, and acquisitions between 2006 and 2016.

While there had been no domestic entrants at scale in the United States since the 1920s, there had been
entry by non-US manufacturers. Japanese (Toyota, Honda) followed by Korean (Hyundai, Kia)
automakers entered at the lower end of the market in price starting in the early 1980s and moved up to
higher-end brands (e.g., Lexus) once they had established a firm foothold. In 2018, OEMs
headquartered outside the United States were producing more cars in the United States than GM, Ford,
and Chrysler combined.21 Companies like Toyota, Daimler, BMW, and Nissan were building and

May 1, 2019                                                                                               3
TESLA’S ENTRY INTO THE U.S. AUTO INDUSTRY
Donald Sull and Cate Reavis

expanding factories and workforces across the southern and southwestern regions of the United States.
Daimler was investing $1 billion in its Alabama-based plant, which produced 286,000 cars in 2017,
and BMW was spending $600 million to expand its South Carolina plant, which produced 370,000
cars.22 Toyota’s four U.S. factories, which together produced nearly 2 million cars in 2017, were about
to become five after the company announced in January 2018 that it would be building a $1.6 billion
shared factory with Mazda in Alabama, which would result in 4,000 new jobs.23

Suppliers
Globally, over 11,000 companies supplied automobile manufacturers with parts (tires, batteries) and
systems (braking, electrical). These suppliers ran 60,000 production facilities and employed 7 million
people worldwide. The $2.2 trillion global automotive supply business was highly fragmented. The top
five players - Robert Bosch, Continental, Magna, Denso, and ZF Friedrichshafen - accounted for 8.1%
of revenue.24 (See the Suppliers tab in the Tesla case workbook for additional data on suppliers.)

There were three tiers of suppliers. Tier 1 suppliers (e.g., Robert Bosch) sold components and sub-
systems that integrated multiple parts, such as a steering system, directly to OEMs.25 Tier 1 suppliers
had deep technical capabilities that allowed them to diversify beyond the automotive industry.26 More
than 40% of Bosch’s revenue, for example, came from the company’s non-automotive business. The
company sold solutions that integrated smoke detectors, climate control, and appliances into what it
called a “smart home” system.

Tier 2 suppliers sold parts such as interior trim, bumpers, wires, and cables to Tier 1 suppliers. Like
their Tier 1 counterparts, many Tier 2 suppliers sold to customers in multiple industries.27 Tier 3
suppliers sold undifferentiated raw materials such as steel or rubber to OEMs and to Tier 1 and Tier 2
suppliers. On average, a car manufacturer had hundreds of suppliers. Ford, for example, purchased 80%
of its parts from 100 suppliers.28 Automotive suppliers were typically more profitable than automakers
(Exhibit 8).

Tier 1 suppliers were investing in new technologies in preparation for a future dominated by electric
vehicles, which would require far fewer parts. An internal combustion car consisted of up to 30,000
discrete parts while an EV had about one-third as many components.29 This contrast was clearly evident
when comparing the engines. An internal combustion engine (ICE) required hundreds of moving parts
while the induction engine used in EVs had only a few. ICE cars had anywhere from six to 10 gears
while EVs had one.30

Tier 1 suppliers were expected to capture a larger portion of a vehicle’s value by selling subsystems,
such as advanced driver assistance systems and infotainment systems that enhanced safety and the
driver’s experience.31 Suppliers of new technology and software were predicted to capture 11% of
profits by 2030, up from 4% in 2015.32 In addition, because they provided the majority of fuel-saving
technology in R&D and production capacity, Tier 1 suppliers were reaping the benefits of new fuel

May 1, 2019                                                                                           4
TESLA’S ENTRY INTO THE U.S. AUTO INDUSTRY
Donald Sull and Cate Reavis

economy standards and renewable fuel standards. One industry analyst predicted that between 2014
and 2025, automakers would spend $110 billion on fuel-saving technology, of which $90 billion would
be paid to suppliers. 33

Customers
Car Buyers     In 2018, there were 113 million registered passenger cars in the United States.34
Average vehicle retention was at an all-time high of 11.6 years.35 Most of these cars spent 95% of their
time parked. Approximately 75% of workers in the United States commuted alone by car.36

Millennials, a generation of 75 million people, had a lower rate of car ownership than previous
generations at their age. One study found that 92% of 20–24 year-olds had a driver’s license in 1983, a
rate that had dropped to 77% by 2014.37 While the 2008 Great Recession delayed their entrance into
the car-buying market, Millennials were the fastest-growing segment of car buyers, and J.D. Powers
predicted that by 2020 they would make up 40% of new car purchases. Compact cars and some
crossovers were their cars of choice. Before entering a dealership, they spent significant time on the
internet researching makes and models, and conferring with acquaintances on social media.38
According to a study by Autotrader, they spent an average of 17 hours researching vehicles before
making a purchase.39 As one industry observer noted: “Millennials buy cars more pragmatically. Maybe
they missed that moment when you deeply fall in love with cars, or a car, or personal autonomous
transportation. And they are forever going to be more on the pragmatic car-as-commodity, car-as-
appliance part of the equation.”40

Millennials’ parents were also starting to think differently about car ownership. According to a 2015
Zipcar study, Baby Boomers - those born between 1946 and 1964 - were moving to the city in large
numbers to take advantage of shorter commutes and the cultural experiences urban life offered.41 Eighty
seven percent of the study’s respondents said that having a shorter commute was an important part of
urban life while 65% said that getting around without a car was a key attribute of urban living.42 Many
relied on ride-hailing services as customers as well as a source of income. A 2015 Uber study
determined that 39% of its drivers who drove over 30 hours per week were 50 years and older.43

In making purchasing decisions, a survey of over 2,000 car buyers ages 18–64 found that safety, fuel
efficiency, and high quality were the most important buying factors, whereas spaciousness, price, and
brand were ranked least important (Exhibit 9). For Millennials, the top five desired features when
looking for a car were navigation systems, satellite radio, Bluetooth, MP3 players, and mobile
integration.44

Dealerships     In 2018, there were over 18,000 new car dealerships in the United States, down from
nearly 22,000 in 2007.45 Sales of new cars accounted for roughly 30% of a dealership’s profits (dealers
earned approximately 2% of the purchase price of a new car in profit).46 Dealerships made between
45% and 60% of their profits through servicing cars and supplying replacement parts, although those

May 1, 2019                                                                                            5
TESLA’S ENTRY INTO THE U.S. AUTO INDUSTRY
Donald Sull and Cate Reavis

profits were expected to decrease significantly with EVs that required less service and fewer repairs.47
A 2016 study found that dealers steered customers away from EVs by not displaying them
prominently, not having an EV available for a test drive, not mentioning available tax credits and
rebates, or not having basic knowledge about EVs.48

Dealers were losing their allure with car buyers. The majority of American car buyers disliked going
to the dealer and having to negotiate price with well-trained salespeople. A survey of 100,000 car
consumers by Accenture found that 75% would consider buying their car online, thereby bypassing the
dealer altogether.49 Cox Automotive, an automotive industry marketer and research provider, predicted
that up to 10% of cars would be purchased online in 2019.50 Millennials were being credited with
moving the car-buying process online.51 In addition to their reluctance to buy a car from a dealership,
Millennials were also reluctant to work at one because of long hours, unstable pay, and the haggling
with consumers that was required - auto dealers experienced a 50% annual turnover among their
Millennial employees.52

The Changing Face of Mobility
In 2018, several changes were fundamentally reshaping the automobile industry. These trends included
a shift toward EVs due to climate change concerns; a growing number of people moving to cities and
choosing to be carless; the rapid growth of autonomous driving; and the rise of alternative
transportation, including car-sharing and car-hailing services (Zipcar, Uber, Lyft), urban bike rentals
(Zagster, Lime), and electric scooter-sharing services (Bird, Lime). Some consumers viewed a car less
as a mode of transportation, and more as a “computer on wheels.”53 Automakers, in response, were
attempting to recast themselves as software-fueled “experience providers.”54

Electrification In 2017, roughly 200,000 EVs were sold in the United States, a 25% increase over
2016 sales, putting the total number on the road at roughly 760,000.55 The Nissan LEAF was the first
mass-market electric vehicle to be sold in the United States. It debuted in late 2010 with a price tag of
$32,780, or $25,280 after a $7,500 federal income tax credit. The car’s 24-kilowatt hour (kWh) battery
had a range of 100 miles. The LEAF experienced a bumpy rollout, and missed sales projections - 2012
sales were half of the projected 20,000 units56 - which led Nissan to lower prices to boost sales.

Government subsidies to consumers were helping to drive EV adoption, which provided the scale
required for EVs to become economically viable for manufacturers.57 Buyers of EVs were entitled to a
$7,500 federal tax credit up until December 31, 2018. Between January 1 and June 30, 2019, the credit
would decrease to $3,750 and then to $1,875 until December 2019. A number of states offered
additional tax credits or rebates to EV buyers, including California ($2,500), Connecticut ($3,000), and
New York ($500 for EVs over $60,000 and $2,000 for those under $60,000).58

The most expensive part of an EV is the lithium-ion battery. The battery pack on Chevrolet’s Bolt EV
cost $10,000–$12,000, accounting for 33% of the final price of the car.59 Fortunately for EV

May 1, 2019                                                                                             6
TESLA’S ENTRY INTO THE U.S. AUTO INDUSTRY
Donald Sull and Cate Reavis

manufacturers, battery prices had fallen 80% between 2010 and 2017 (Exhibit 10). Batteries on EV
models varied in their capacity (based on kWh), the time it took to charge the battery (about 35 hours
to completely charge a Nissan LEAF using 110V and 7.5 hours with 220V), and range (how many
miles could be driven per charge).60 The price of electricity in the United States averaged $0.11 per
kWh.61 Over 60% of battery sales were shared by three companies: Panasonic (Japan), BYD (China),
and LG Chem (South Korea).62

GM and Ford were preparing to introduce multiple EV models. GM entered the EV market with the
Chevy Bolt in early 2017, six years after launching the hybrid Chevy Volt. GM planned to offer a fleet
of 20 electric vehicle models by 2023, including electric SUV/light trucks, a segment which Tesla was
also expected to enter.63 The company, in partnership with Honda, was also investing in proprietary
battery and fuel cell technologies.64

Ford entered the EV market in 2012 with an electric version of the Focus. In early 2018, the company
announced that, over the following four years, it would be phasing out most of its passenger internal
combustion models to focus on light trucks and EVs.65 It was investing $11 billion and planned to roll
out 24 hybrids and 16 EVs, including a 300-mile range Mustang-inspired SUV, by 2022.66

Toyota, which lagged behind its competitors in rolling out EVs, planned to have 10 EV models by the
early 2020s. In late 2017, the company announced it was in talks with battery maker Panasonic to form
a joint venture in Japan to make batteries for EVs.67 BMW launched its first EV, the i3, in 2015. Its EV
crossover, the iX3, with a range of 250 miles, would arrive in 2021. Recognizing a future need for easy
access to batteries, in 2018, the company signed a $1.1 billion contract with China-based CATL, to
build a battery factory in Europe.68

With electrification came the need for public charging stations. In order for consumers to feel
comfortable about switching to EVs and avoid “range anxiety,” they needed reassurance that the public
charging infrastructure was in place when away from their home charging outlet. There were 16,000
public charging stations and 43,000 individual charging connectors in the United States compared to
112,000 gas stations.69 Building and maintaining charging stations was unprofitable, and different
stakeholders, including automakers, power companies, third-party charging companies, and
governments, debated who should be responsible for these stations.70

Since 2015, BMW and Nissan had partnered with EVgo, the nation’s largest public direct current (DC)
fast-charging operator, to build a network of fast-charging stations, which were publicly available for
all EV drivers. A fast-charging station could add 60 to 100 miles of range in just 20 minutes.71 As part
of its diesel emissions settlement with the U.S. government, Volkswagen would be installing 2,000
fast-charging stations in 17 U.S. cities by 2019.

Utilities were beginning to eye the EV charging infrastructure market, and several were running pilots
and experimenting with different business models. As industry watchers noted, it was the duty of

May 1, 2019                                                                                            7
TESLA’S ENTRY INTO THE U.S. AUTO INDUSTRY
Donald Sull and Cate Reavis

utilities to serve the public interest.72 Industry experts warned about the stress EVs might put on the
electric grid if owners charged their cars at home during peak hours (early evening). Some believed
additional fossil fuel-fired plants would need to be built to meet the demand unless drivers could charge
their cars during off-peak hours or by using renewable power sources such as solar.73

Autonomous Driving There was debate about how long it would take until the first fully automated,
self-driving vehicle would be on the road. (See Exhibit 11 for five autonomous levels ranging from
“hands on” to “steering wheel optional.”) Some industry observers believed driverless cars, which were
equipped with either LiDAR, a laser technology that uses light waves, or radio wave technology to
transmit information on a car’s surroundings, would become fairly commonplace by 2020.74 Others
weren’t as optimistic and believed it could be decades before consumers trusted autonomous vehicles
and were ready to replace their current cars.75

Several companies were testing different levels of autonomous vehicles with mixed success. Tesla,
Uber, and Waymo (a subsidiary of Google’s parent company Alphabet Inc.) had all experienced crashes
that resulted in serious injuries and, in some cases, fatalities.76 While Tesla experimented on its own
cars, Uber and Waymo tested their self-driving technology on Toyotas and Fiat Chryslers.77 Like
Waymo and Uber, Apple looked to OEMs to supply the vehicles for their autonomous vehicle initiative.
Apple was equipping Lexus SUVs with LiDAR, radar sensors, and many cameras. By May 2018, Apple
was testing 45 cars, more than the number being tested by Waymo and Uber.78

GM, which received a $2.3 billion investment from SoftBank for its self-driving division GM Cruise
Holdings, was the most active of the car manufacturers in testing autonomous vehicles. The company’s
test fleet of 180 autonomous EVs was providing taxi-like services for company employees in San
Francisco. (A human was on board in all vehicles during the testing phase.) Industry observers predicted
that either GM or Waymo would win the race to bring the first fully autonomous vehicle to market.79

Self-driving cars, many believed, would make traveling by car safer by eliminating human error and
distraction.80 In addition to safer roads, driverless cars would enable ride sharing, thereby reducing
private car ownership. As one industry observer noted, “In the past, cars were primarily about driving
and secondarily about content consumption. With autonomous cars, that prioritization will be reversed.
Fully automatic cars will be battery-powered living rooms on wheels.”81 The speed of adoption to self-
driving cars would depend on regulations - only 6% of the largest cities had language about
autonomous vehicles in their long-term transportation plans82 - and consumer acceptance.83

Connectivity With a growing segment of society craving continual connection with the world around
them, car manufacturers were investing in digital connectivity. As defined by the automotive practice
of consulting firm PricewaterhouseCooper (PwC), a “connected car” had access to the internet and a
variety of sensors that were able to send and receive signals, sense the environment around them, and
interact with other vehicles or entities, such as in-home virtual assistants like Alexa.84 The key elements
of a connected car were adaptive driver assistance systems, infotainment, human-machine interfaces

May 1, 2019                                                                                               8
TESLA’S ENTRY INTO THE U.S. AUTO INDUSTRY
Donald Sull and Cate Reavis

(e.g., touchscreen or any device enabling continuous communication between driver/passengers and
the car/outside world85), and vehicle services (e.g., safety and vehicle management services, over-the-
air software updates).86

As cars became more connected, R&D investment by OEMs was expected to move from hardware (the
car itself) to software solutions integrated into the vehicle, a shift that would require automakers to hire
more software engineers.87 A McKinsey & Company report estimated that the United States alone
would require up to 100,000 additional software engineers to work in its automotive industry.88

The profits automakers reaped in the future would depend on the type of connectivity “packages” that
OEMs sold with their cars.89 The CEO of LeEco, a Chinese conglomerate, noted in an interview that
he would eventually be able to offer his company’s electric car, the LeSEE, for free, earning money
from the myriad services the company sold to customers.90 How OEMs would profit from connected
cars, and whether they would try to do so by building, buying, or partnering, was not clear. As PwC put
it, “The risk is that they [OEMs] will become mere manufacturers of increasingly commoditized
vehicles - dumb pipes on wheels - through which the truly valuable connected and mobility services
pass.”91

Connected car revenue was expected to surge from $53 billion in 2017 to $156 billion by 2022 (Exhibit
12). In 2017, premium models captured nearly two-thirds of the connected car revenue. But a shift was
expected to take place and by 2022 the mass-market vehicles, such as the Ford Focus and Honda
Accord, were expected to account for 50% of revenue. Seventy-five percent of connected car packages
would be sold as part of smaller, less expensive cars, and the prices for the packages would be lower.92

Prices and services included in connected car packages varied considerably among OEMs as did the
level of price transparency. GM’s OnStar Safety and Security Plan, which included automatic crash
response, stolen vehicle assistance, and navigation, was $24.99 a month after a six-month free trial.93
Toyota’s Safety Connect – a standard feature on all models that provided emergency assistance, stolen
vehicle locator, and crash notification – was $8 a month after a three-year free trial. Navigation services
were sold separately with the basic service costing $24.99 a year after a free trial.94

Alternatives to Private Car Ownership Some industry observers believed that electrification,
autonomous driving, and connectivity would alter, but not fundamentally change, the traditional
business model of selling cars that OEMs had pursued for decades. Others argued that consumers’
views of transportation were fundamentally shifting. Owning cars would give way to a “mobility-as-a-
service” model, whereby consumers would purchase the mobility they needed, when they needed it. In
this scenario, consumers would buy miles rather than vehicles.95 A 2017 transportation study by a
Stanford University economist predicted that by 2030, 95% of U.S. passenger miles could be served by
on-demand autonomous electric vehicles and that there would be an 80% drop in private car ownership
in the United States by the same year.96

May 1, 2019                                                                                                9
TESLA’S ENTRY INTO THE U.S. AUTO INDUSTRY
Donald Sull and Cate Reavis

The shift to mobility-as-a-service was expected to be most pronounced for consumers living in cities,
while private car ownership would remain the preferred means of mobility in rural areas.97 Private car
ownership would become less important than the flexibility to choose the best transportation solution
for a given purpose.98 In the future, through a mobile app, someone in need of transportation might be
able to “order” a small car to commute to work, an SUV to take the family and dog hiking on the
weekends, and a van to transport multiple kids to a soccer game. PwC predicted there would be 22%
fewer vehicles on U.S. roads by 2030 and those that were in use would drive more miles and have
shorter lifecycles. As an industry analyst from McKinsey & Company put it: “The bad news is that the
traditional business models and the traditional technologies have peaked. The good news is that for
players who are able to move successfully into this new world, there is a whole new world of revenues
and profit pools.”99

The shift away from private car ownership was already being seen in certain cities.100 Between 2015
and 2016, the number of households without a car in Chicago rose from 26.5% to 27.5% and in Atlanta
from 15.2% to 16.4%.101 Many people in urban areas were opting to get from point A to point B via
public transportation, car-sharing services, and bike (including electric bikes) and electric scooter (e-
scooter) sharing. Investors were betting that these alternative modes of transportation would continue
to grow. In May 2018, e-scooter startup Bird, founded in mid-2017, raised $300 million at a $2 billion
valuation.102 Bird charged riders $1 to unlock a scooter and $0.15 a minute to ride. Bike and scooter
rental operator Lime, founded in January 2017 and also valued at $2 billion,103 charged $1 ($0.50 for
students) to rent a pedal bicycle for half an hour, and their e-bikes and e-scooters cost $1 to unlock and
$0.15 a minute to ride. Both Bird and Lime faced operational setbacks in the spring and summer of
2018 when they received cease and desist orders from the City of San Francisco and clashed with
officials in smaller urban centers like Denver and Nashville after they started operating without
obtaining the proper permits.104

A number of OEMs were acquiring or working with entities that catered to consumers who did not
want to buy a car. GM acquired a 9% share in Lyft with its $500 million investment in January 2016 in
hopes of creating an autonomous, on-demand vehicle network. Toyota was collaborating with Uber to
create new leasing options for Uber drivers.105 Meanwhile, Alphabet and Uber were both investors in
Lime’s latest round of funding,106 and in late June 2018, Lyft acquired Motivate, operator of New
York’s City Bike, Boston’s Blue Bikes, among others, for an undisclosed sum.107

Tesla Enters the Automotive Industry
Engineering entrepreneurs Martin Eberhard and Marc Tarpenning founded Tesla in 2003 in Palo Alto,
California. Elon Musk, who had earned $165 million from the sale of his stake in PayPal in October
2002, led the Series A round of funding of $7.5 million in 2003 and became chairman of the board in
2004. None of the company’s original leadership team had a background in the automotive industry. In
2007, Tesla experienced cost overruns on its first EV, the Roadster, and by the end of the year had had
three CEOs, including co-founder Eberhard. Musk, who by that point had invested $55 million in Tesla,

May 1, 2019                                                                                             10
TESLA’S ENTRY INTO THE U.S. AUTO INDUSTRY
Donald Sull and Cate Reavis

appointed himself CEO in October 2008 saying, “That’s part of the reason I decided to take over as
CEO. I have so many chips on the table. I need to steer the boat completely.”108

Tesla’s nine-person board included several members with close ties to Musk’s various business
interests: the CEO of Solar City (Musk’s cousin), the CFO of Solar City, and two directors of Musk’s
rocket company SpaceX.109 The company had witnessed the departure of several key managers in 2018,
including the VP of engineering and two high-ranking engineers who worked on the company’s
automated production line. Tesla had roughly 34,000 employees worldwide, including 10,000 who
worked in the company’s manufacturing plant in Fremont, California, and 1,000 at its battery and motor
Gigafactory in Nevada.

The company went public in June 2010 at a price of $17 per share, and by August 2018, the stock was
trading at $335 share, putting its market capitalization higher than GM’s. (There had been no stock
splits.) Tesla recorded its first profitable quarter ($11 million in net income) in March 2013 and booked
profits a second time in October 2016, but posted losses for every other quarter. (See the Tesla financial
tab in the Tesla case workbook.) Many investors were skeptical of Tesla’s long-term viability, and bet
that its stock would drop in price.110

Tesla’s Master Plan
Tesla’s strategy was spelled out in the Master Plan that Musk posted on the company’s website in 2006,
which included the following: “Almost any new technology initially has high unit cost before it can be
optimized and this is no less true for electric cars.... The strategy of Tesla is to enter at the high end of
the market, where customers are prepared to pay a premium, and then drive down market as fast as
possible to higher unit volume and lower prices with each successive model.”

Tesla entered the car market by focusing on a niche market – luxury electric vehicles that traditional
automakers had ignored, and succeeded in winning market share from other luxury gas-fueled models.
(See the Luxury car tab in the Tesla case workbook.) Each Tesla model, however, was late to market,
experienced various technology glitches and quality issues, and missed sales projections.111

The two-seat Roadster was Tesla’s first car. As described by Car and Driver, the Roadster was “not
just a car, but one of the strongest automotive statements on the road.”112 Retailing for $100,000 and
able to hit 60 miles per hour in just four seconds, the electric sports car made its retail debut two years
later than promised due to production delays. Tesla outsourced key components of the car to a couple
of global suppliers, but struggled to manage the suppliers and integrate the components. By the time
Tesla stopped making the Roadster in 2012, it had sold 2,500 units.

For the Model S sedan, which launched in 2013 and won that year’s Motor Trend’s car of the year
award, Tesla kept design and assembly in-house and produced a large number of components as well,
rather than sourcing them from suppliers. Two years after its launch, the Model S was declared “the

May 1, 2019                                                                                                11
TESLA’S ENTRY INTO THE U.S. AUTO INDUSTRY
Donald Sull and Cate Reavis

best-performing car that Consumer Reports has ever tested.” In 2017, the Model S sales nearly matched
the combined sales of the BMW 6 and 7 series and the Mercedes-Benz CLS and S class. By early 2018,
nearly 225,000 Model S sedans had been sold.113 Tesla claimed that the lifetime costs of operating a
Model S were lower than for a comparable vehicle. One analysis comparing the five year cost of owning
a Model S to a BMW 6 Series found the Tesla required $3,000 in fuel versus $8,000 for the BMW, was
more expensive to insure ($14,000 versus $10,000 for the BMW), and that the maintenance cost for
both cars was approximately $3,000.114

In 2015, the company introduced the $80,000 Model X, a midsize luxury crossover with falcon wing
doors that opened upward. Nearly 81,000 Model X crossovers had been sold by early 2018.

The Model 3 was Tesla’s first attempt at scaling to mass production. The lowest priced model, which
had a range of 220 miles, cost $27,500 (after deducting a $7,500 federal tax credit); an upgraded model
with a battery range of 310 miles started at $44,000. The Model 3’s competitors included the Nissan
LEAF ($29,990, battery range of 151 miles) and the Chevy Bolt ($37,495, battery range of 238
miles).115 By summer 2017, Musk announced over 500,000 customers had put down $1,000 to reserve
a Model 3.116 However, by mid-2018, nearly 25% of these deposits had reportedly been refunded.117
By the first week of September 2018, Tesla had manufactured almost 85,000 Model 3s, and was
estimated to be producing over 4,800 per week.118

“Production Hell”
The Model 3 was designed to be easy to manufacture, with 8,000 parts, or 25% fewer components than
its predecessors. While the typical automaker outsourced the majority of its components, Tesla, by
some accounts, made up to 80% of the Model 3’s components in-house in a dedicated casting foundry
in California, a tool and die plant in Michigan, the Gigafactory, and the second floor of the Fremont
plant.119 According to Tesla’s former VP of production, the company made its own battery, power
electronics, drive-train systems, cables, displays, and fuses, and was “more vertically integrated than
any car company since the heyday of the Ford [River] Rouge plant in the late 1920s.”120

Tesla’s decision to vertically integrate was in part due to the hard lessons learned during the
manufacturing process of previous models. Seat production, which had originally been outsourced for
the Models S and X to an Australian seat manufacturer, was one example. Musk was dissatisfied with
the seats’ quality and comfort. In addition, voluntary recalls involving the seat belts on the Model S
and a faulty locking mechanism on the second-row seats on the Model X led the carmaker to move seat
manufacturing in-house.121 Tesla’s move perplexed some analysts. “Is that really the core competency
of an auto company?” one asked.122 Most OEMs outsourced seat manufacturing to specialists due to
high labor and design costs.123

The Model 3’s battery and motor were manufactured at Tesla’s Gigafactory, which opened in 2016.
The idea behind the factory came to CTO JB Straubel back in 2012 upon realizing that Tesla’s plan to
sell 500,000 cars a year by 2020 would require the world’s entire 2012 output of lithium-ion batteries.124
May 1, 2019                                                                                             12
TESLA’S ENTRY INTO THE U.S. AUTO INDUSTRY
Donald Sull and Cate Reavis

To scale, Tesla would need to produce its own batteries. Located in the Nevada desert, the $5 billion
factory, which was built in partnership with Panasonic, was the largest manufacturing plant in the world
with a footprint of 5.5 million square feet, equivalent to 35 Costco stores. The plant was manufacturing
3,000 battery packs a week. Each battery pack contained 2,170 cylindrical cells (each one slightly
longer and thinner than a C battery) in a pack weighing 1,054 pounds.125 Musk noted that the company
had reduced the time it took to make a battery pack from seven hours to less than 17 minutes.126 He
also indicated in early June 2018 that the company expected to achieve a battery cell cost of $100 per
kWh by the end of the year. GM was spending $145 per kWh for batteries purchased from LG Chem
for the Bolt.127

The Model 3 was manufactured 240 miles to the west of the Gigafactory at Tesla’s 5.3 million square
foot manufacturing plant in Fremont, California. The 50-year-old plant was previously run by GM and
then by a joint venture between GM and Toyota. At its height, the plant produced up to 500,000 cars a
year. Tesla bought the factory from Toyota in 2010 for $42 million and invested nearly $1.3 billion in
expanding its footprint for the Model 3 production and in creating a highly automated production line.
Musk envisioned an “alien dreadnought” factory that used artificial intelligence and robots to build cars
faster than any human assembly line.128 Workers would be used to maintain and fix the robots and
machines. Ninety-five percent of the Model 3’s production line was automated.129 Musk explained:
“The true problem, the true difficulty, and where the greatest potential is, is building the machine that
makes the machine. In other words, it’s building the factory. I’m really thinking of the factory like a
product.”130

When introducing new car models, automakers spent up to six months testing the production line by
building vehicles with lower-grade equipment and prototype tools designed to be scrapped once all the
manufacturing kinks were worked out.131 For the Model 3, Tesla chose to skip “beta” production in an
attempt to save time and money.132 When production began, the automated line was not complete. Some
Model 3 parts were being assembled by hand, off of the automated assembly line, including the welding
of huge pieces of steel.133 There were issues with the quality of components, and one Tesla engineer
estimated that 40% of parts made or received at the Fremont plant required rework.134 The company
was making tweaks to the production process even as cars were “rolling off the line.” Musk’s desire
for full automation before perfecting the production process first was puzzling to some. One industry
consultant noted, “The Japanese style of production is to try and limit automation initially as it is
expensive and statistically inversely correlated to quality. The approach is to get the process right first,
then bring in the robots.”135

Sales and Service
Tesla not only had to make the Model 3, but also had to sell them, ensure that customers had places to
charge, and service them when required. Unlike other car manufacturers that relied on independent
dealers to sell and service their cars, Tesla sold its cars through company-owned stores where
salespeople earned a salary instead of a commission. According to its website, the company owned 111

May 1, 2019                                                                                               13
TESLA’S ENTRY INTO THE U.S. AUTO INDUSTRY
Donald Sull and Cate Reavis

stores in 26 states and Washington, D.C. The company’s ability to expand its store footprint had been
hampered by the dealership lobby, which argued Tesla was breaking decades-old franchise laws that
prevented car makers from selling directly to consumers. Independent dealers had succeeded in at least
partially banning Tesla’s direct sales model in several states, including Connecticut, Wisconsin, Texas,
and Michigan.136

In early 2019, Tesla owned and operated over 1,300 charging stations and nearly 11,000
“Superchargers” (charge points) exclusively for drivers of Tesla vehicles to recharge their batteries
when on the road. A driver could get 170 miles of range after 30 minutes of using the Supercharger at
a cost of $0.24 per kWh ($0.06 a mile for a Model 3).137 In comparison, a Nissan LEAF driver, using
an alternative fast-charging station (known as CHAdeMO), would get between 75 and 100 miles of
range in the same amount of time.138 According to Musk, thousands of new stations were in the
permitting or construction phase, and the company was “open” to letting other automakers use the
supercharging network so long as they shared in the cost of usage.139

Tesla had 76 service centers across the United States and about half of them were co-located with stores.
Because Tesla’s EVs had fewer parts, there was less need for physical repairs. A lot of fixes and
improvements could be done without having to find a service center. Tesla updated its vehicles via Wi-
Fi, and could continually improve a vehicle’s performance post-sale (e.g., improving acceleration and
braking capabilities). Indeed, by sending periodic software updates, Tesla planned to incrementally
transition its cars to become increasingly more autonomous, eventually not requiring a driver at all.140

Master Plan, Part Deux
In 2016, Musk unveiled his Master Plan, Part Deux, which included the development of a completely
self-driving (Level 5) vehicle that, when not in use, could be used by others. Musk explained: “So there
will be a shared autonomy fleet where you buy your car and you can choose to use that car exclusively.
You can choose to have it used only by friends and family… or other drivers who are rated five star.
You can choose to share it sometimes but not other times. That’s 100 percent what will occur. It’s just
a question of when.”141

On a May 2018 earnings call, Musk said that the autonomous ride-sharing platform would probably be
ready to launch by the end of 2019 and that getting regulatory approval would be the company’s biggest
challenge.142 One automotive analyst speculated that it could add somewhere between $2 billion and
$6 billion in revenue for Tesla and that a Tesla owner could make up to $6,900 a year, after paying
Tesla a 10% cut, and factoring in energy, insurance, maintenance, and non-cash depreciation.143

Conclusion
Many believed Musk had succeeded in spurring innovation in what had been a traditionally slow-to-
change industry. In imagining a world without Tesla, one board member mused, “What would the world
look like? I have this sinking suspicion it wouldn’t look that different than 10 years ago. A bunch of

May 1, 2019                                                                                            14
TESLA’S ENTRY INTO THE U.S. AUTO INDUSTRY
Donald Sull and Cate Reavis

hybrid cars. A bunch of noise about hydrogen vehicles. You know, I don’t think the world would look
anything like today – where entire nations are saying, ‘We’re going to stop making gas cars.’”144

But the question remained: Could Tesla not only survive but also thrive in the automotive industry over
the next few years?

May 1, 2019                                                                                          15
TESLA’S ENTRY INTO THE U.S. AUTO INDUSTRY
Donald Sull and Cate Reavis

Exhibit 1a U.S. New Cars Market by Value

                                  $250                                                                        10%
                                  $245                                                                        8%
                                  $240                                                                        6%
                                  $235
                                                                                                              4%
                                  $230
                                                                                                              2%
                                  $225
                 US$ billion

                                                                                                              0%
                                  $220
                                                                                                              -2%
                                  $215
                                  $210                                                                        -4%

                                  $205                                                                        -6%

                                  $200                                                                        -8%
                                           2012 2013 2014 2015 2016 2017 2018 2019 2020 2021
                       Revenue ($ billion) $219 $237 $244 $247 $233 $234 $236 $239 $242 $245
                       % Growth                 8%     3%     1%     -6%     0%    1%     1%     1%     1%

Exhibit 1b U.S. New Cars Market by Volume

                               7,800                                                                          6%

                               7,600                                                                          4%

                                                                                                              2%
                               7,400
                                                                                                              0%
          thousand units

                               7,200
                                                                                                              -2%
                               7,000
                                                                                                              -4%
                               6,800
                                                                                                              -6%
                               6,600                                                                          -8%

                               6,400                                                                          -10%
                                       2012   2013   2014   2015   2016    2017   2018   2019   2020   2021
                       Thousand Units 7,242 7,585 7,689 7,517 6,873 6,882 6,908 6,952 7,014 7,093
                       % Growth              5%    1%    -2% -9%     0%    0%    1%    1%    1%

Source: “New Cars in the United States,” MarketLine, September 2017.

May 1, 2019                                                                                                          16
TESLA’S ENTRY INTO THE U.S. AUTO INDUSTRY Donald Sull and Cate Reavis Exhibit 2 Price of Cars in U.S. Market Segment July 2018 Transaction Price (Avg.) Compact Car $20,412 Compact SUV/Crossover $28,365 Electric Vehicle $36,948 Entry-Level Luxury Car $42,211 Full-Size Car $35,038 Full-Size Pickup Truck $48,644 Full-Size SUV/Crossover $61,557 High-Performance Car $92,798 High-End Luxury Car $98,360 Hybrid/Alt. Energy Car $26,969 Luxury Car $59,519 Luxury Compact SUV/Crossover $44,524 Luxury Full-Size SUV/Crossover $88,038 Luxury Mid-Size SUV/Crossover $55,118 Mid-Size Car $25,424 Mid-Size Pickup Truck $33,125 Mid-Size SUV/Crossover $37,844 Minivan $34,635 Sports Car $31,650 Subcompact Car $15,026 Subcompact SUV/Crossover $24,008 Van $34,902 Average Price $35,359 *Kelley Blue Book average transaction prices do not include applied consumer incentives. Source: Kelley Blue Book. May 1, 2019 17
TESLA’S ENTRY INTO THE U.S. AUTO INDUSTRY
Donald Sull and Cate Reavis

Exhibit 3                    U.S. New Car Market by Segment, 2008–2023

                            40%
                            35%
                            30%
     % of New Car Models

                            25%
                            20%
                            15%
                            10%
                             5%
                             0%
                                                                                                                   Luxury/sports
                                       Crossover       Light truck           Small car       Mid/large car
                                                                                                                        car
                  2008-2017              34%                26%                   15%            17%                    7%
                  2018-2023              29%                20%                   20%            21%                   10%

Sources: https://www.statista.com/statistics/287744/new-car-model-launches-on-the-us-market-by-segment/; Merrill Lynch;
Bank of America.

Exhibit 4                    U.S. Car Manufacturer Market Share (by %, March 2018)

            17.9

                             14.7
                                    13.5 12.9

                                                9.8
                                                      8.6

                                                             3.7     3.5    3.1    2.3   2    1.9   1.9      1.2     0.9   0.2
                                            ru

                                                                                                              sla
                                                                                                               hi
                                             i
                                           an
                             rd

                                                                                           a

                                                                                          en

                                                                                          da

                                                                                          nz

                                                                                                               di
                                            ta

                                    Hy a

                                                                                          W
    GM

                                           up

                                           da
                                          nd

                                                                                        Ki

                                                                                                             is
                                ry oyo

                                                                                                            Au
                                                                                     BM
                                        ba
                           Fo

                                                                                      Be
                                         ss

                                                                                       az
                                                                                       ag
                                        ro

                                                                                                            Te
                                       un

                                                                                                           ub
                                      Ho
                                      Ni

                                      Su

                                                                                    M
                                                                                   sw
                                     rG

                                                                                    s-
                                      T

                                                                                                        its
                                                                                 de
                                                                                 lk
                                  sle

                                                                                                       M
                                                                               ce
                                                                             Vo

                                                                            er
                              Ch

                                                                           M

Source: http://www.wsj.com/mdc/public/page/2_3022-autosales.html#autosales (accessed June 12, 2018).

May 1, 2019                                                                                                                        18
TESLA’S ENTRY INTO THE U.S. AUTO INDUSTRY
Donald Sull and Cate Reavis
Exhibit 5 Automobile Manufacturing Capacity Utilization
100
90
80
70
60
50
40
30 32.6%
20
10
0
1
01
01
01
01
01
01
01
01
01
01
01
01
01
01
-0
4-
4-
4-
4-
4-
4-
4-
4-
4-
4-
4-
4-
4-
4-
04
-0
-0
-0
-0
-0
-0
-0
-0
-0
-0
-0
-0
-0
-0
-
04
05
06
07
08
09
10
11
12
13
14
15
16
17
18
20
20
20
20
20
20
20
20
20
20
20
20
20
20
20
Source: Board of Governors of the Federal Reserve System (https://fred.stlouisfed.org/series/CAPUTLG33611SQ#0, accessed
July 7, 2018).
Exhibit 6a Car Market Value Chain, 2015–2030
Percent of Revenue
60%
50%
40%
30%
20%
10%
0%
Supplier Supplier
Shared Digital
Vehicle Sales Aftermarket Insurance (new tech/ (traditional/ Financing
Mobility Services
software) hardware)
2015 49% 14% 0% 12% 3% 14% 8% 0%
2030 (scenario) 44% 13% 10% 10% 7% 7% 7% 2%
May 1, 2019 19TESLA’S ENTRY INTO THE U.S. AUTO INDUSTRY
Donald Sull and Cate Reavis
Exhibit 6b Car Market Value Chain, 2015–2030
Percent of Profits
45%
40%
35%
30%
25%
20%
15%
10%
5%
0%
Supplier Supplier
Shared Digital
Vehicle Sales (new tech/ Insurance Financing Aftermarket (traditional/
Mobility Services
software) hardware)
2015 41% 0% 4% 14% 11% 16% 0% 14%
2030 (scenario) 29% 20% 11% 11% 10% 10% 5% 4%
Source: Richard Vierecki, Dietmar Ahlemann, et al. “Connected Car Report 2016,” Strategy& (PwC), September 26, 2016.
Exhibit 7 Combined Capital Spending, R&D, and M&A of Top 10 OEMs (in US$ billions)
$250
3.6% CAGR $195
$200 $183 $186
$178
$170
$146 $145 $147
$150 $137 $134 $130
$100
$50
$0
2006 2007 2008 2009 2010 2011 2012 2013 2014 2015 2016
Source: Rich Parkin, Reid Wilk, et al., “2017 Automotive Trends,” Strategy& (PwC).
May 1, 2019 20TESLA’S ENTRY INTO THE U.S. AUTO INDUSTRY
Donald Sull and Cate Reavis
Exhibit 8 Return on Invested Capital, Top 100 Suppliers vs. Top 10 OEMs
Source: Rich Parkin, Reid Wilk, et al., “2017 Automotive Trends,” Strategy& (PwC).
Exhibit 9 Car-Purchasing Decisions Survey, November 2017–January 2018
70%
60% 65% 64%
50% 56%
40% 47% 47% 47% 45% 44%
30% 37%
20% 29%
10%
0%
r…
…
e
y
ty
ad
gn
e
ss
ity
rt
fo
ic
ak
nc
fo
fe
ne
si
al
pr
y
y
ie
m
om
Sa
De
nt
Qu
us
lit
fic
w
d
ra
bi
io
gc
re
Lo
Ef
gh
ar
ita
ac
er
in
Hi
el
w
Sp
Su
ef
iv
Fu
od
pr
dr
Go
y
gh
M
Hi
Source: Statista Global Consumer Survey 2018 (https://www.statista.com/chart/13075/most-important-factors-when-buying-a-
car/, accessed July 14, 2018).
May 1, 2019 21TESLA’S ENTRY INTO THE U.S. AUTO INDUSTRY
Donald Sull and Cate Reavis
Exhibit 10 Price of Lithium-ion Batteries
Lithium-ion Battery Prices
1200
1000
800
600
$/kWh
400
200
0
2010 2011 2012 2013 2014 2015 2016 2017 2025
Series1 1000 800 642 599 540 350 273 209 100
Size of batteries: Nissan LEAF = 40 kWh, Chevrolet Bolt = 60 kWh, Tesla = 85 kWh
Source: Nicolas Zart, “Batteries Keep on Getting Cheaper,” CleanTechnica, December 11, 2017.
May 1, 2019 22TESLA’S ENTRY INTO THE U.S. AUTO INDUSTRY Donald Sull and Cate Reavis Exhibit 11 Five Levels of Automation Level 0: No Automation System capability: None. • Driver involvement: The human at the wheel steers, brakes, accelerates, and negotiates traffic. • Examples: A 1967 Porsche 911, a 2018 Kia Rio. Level 1: Driver Assistance (aka “hands on”) System capability: Under certain conditions, the car controls either the steering or the vehicle speed, but not both simultaneously. • Driver involvement: The driver performs all other aspects of driving and has full responsibility for monitoring the road and taking over if the assistance system fails to act appropriately. • Example: Adaptive cruise control. Level 2: Partial Automation (aka “hands off”) System capability: The car can steer, accelerate, and brake in certain circumstances. • Driver involvement: Tactical maneuvers such as responding to traffic signals or changing lanes largely fall to the driver, as does scanning for hazards. The driver may have to keep a hand on the wheel as a proxy for paying attention. • Examples: Audi Traffic Jam Assist, Cadillac Super Cruise, Mercedes-Benz Driver Assistance Systems, Tesla Autopilot, Volvo Pilot Assist. Level 3: Conditional Automation (aka “eyes off”) System capability: In the right conditions, the car can manage most aspects of driving, including monitoring the environment. The system prompts the driver to intervene when it encounters a scenario it cannot navigate. • Driver involvement: The driver must be available to take over at any time. • Example: Audi Traffic Jam Pilot. Level 4: High Automation (aka “mind off”) System capability: The car can operate without human input or oversight but only under select conditions defined by factors such as road type or geographic area. • Driver involvement: In a shared car restricted to a defined area, there may not be any driver involvement. But in a privately owned Level 4 car, the driver might manage all driving duties on surface streets and then become a passenger as the car enters a highway. • Example: Google’s now-defunct Firefly pod-car prototype, which had neither pedals nor a steering wheel and was restricted to a top speed of 25 miles per hour. Level 5: Full Automation (aka “steering wheel optional”) System capability: The driverless car can operate on any road and in any conditions a human driver could negotiate. • Driver involvement: Entering a destination. • Example: None yet, but Waymo – formerly Google’s driverless-car project – is now using a fleet of 600 Chrysler Pacifica hybrids to develop its Level 5 technology for production. Source: “Path to Autonomy,” Car and Driver, October 2017. May 1, 2019 23
TESLA’S ENTRY INTO THE U.S. AUTO INDUSTRY
Donald Sull and Cate Reavis

Exhibit 12 Estimated Connected Car Revenues by Product Package

                 $180
                                                                                        $156 billion
                 $160

                 $140
                                                                                             $43
                 $120
                                                                           es
   US$ billion

                 $100
                                                                      r vic
                                                                     e
                  $80                                           teds           ivin
                                                                                   g         $55
                                       $53 billion           ec             d r
                                                           nn       m  ous
                  $60
                                                         Co        o
                                                               ton
                  $40                      $21              Au
                                                                          y
                                           $14                     Safet                     $58
                  $20
                                           $18
                   $0
                                          2017                                               2022

                        Connected services (e.g., mobility/vehicle management, entertainment, navigation)
                        Autonomous driving (e.g., distance/park/road assistant, traffic sign detection)
                        Safety (e.g. automatic collision detection/prevention)

Source: Dietmar Ahlemann, Alex Koster, et al., “Growth in a Commoditizing Market,” Strategy& (PwC), September 26, 2016.

May 1, 2019                                                                                                               24
TESLA’S ENTRY INTO THE U.S. AUTO INDUSTRY
Donald Sull and Cate Reavis
Endnotes
1
“Tesla Unveils Model 3,” YouTube, May 31, 2016 (https://youtu.be/Q4VGQPk2Dl8m, accessed May 4, 2018).
2
David Gelles, James B. Stewart, et al., “Elon Musk Details ‘Excruciating’ Personal Toll of Tesla Turmoil,” The New York Times, August
16, 2018.
3
Neal E. Boudette, “Inside Tesla’s Audacious Push to Reinvent the Way Cars Are Made,” The New York Times, June 30, 2018.
4
John Melloy, “Highlights of Elon Musk’s Strange Tesla Earnings Call,” CNBC, May 3, 2018.
5
Paulo Santos, “Tesla: The Model 3 at 5,000/Week Is Not Enough for Profitability,” Seeking Alpha, May 3, 2018.
6
Matthew DeBord, “Tesla’s Second Quarter Earnings Are Expected to Be Terrifyingly Bad…,” Business Insider, July 28, 2018.
7
David Gelles, James B. Stewart, et al., “Elon Musk Details ‘Excruciating Personal Toll of Tesla Turmoil,” The New York Times, August
16, 2018.
8
Chris Isidore, “Tesla Races to Fulfill Its Model 3 Promise,” CNN, June 29, 2018.
9
Leon Poultney, “Hey Tesla, How Hard Can It Be to Actually Make a Car?” Wired UK, April 22, 2018.
10
Grace Donnelly, “Why This Chief Investment Officer Thinks Tesla Is ‘on the Verge of Bankruptcy,’” Fortune, March 27, 2018.
11
“New Cars in the United States,” MarketLine, September 2017.
12
Ibid.
13
Ray Telang and Brandon Mason, “All Eyes on Shared Mobility,” Strategy& (PwC), November 9, 2017.
14
http://www.wsj.com/mdc/public/page/2_3022-autosales.html#autosales, accessed July 12, 2018.
15
Bureau of Labor Statistics (https://www.bls.gov/iag/tgs/iagauto.htm#about, accessed August 17, 2018).
16
“Which Car Brands Have the Most (and Least) Loyal Owners?” Priceonomics, July 16, 2018.
17
Ted Serbinski, “Defining Mobility for the Automotive Industry,” Techstars, April 14, 2016.
18
Dietmar Ahlemann, Evan Hirsh, et al., “Connected Car Report, 2016,” Strategy& (PwC), September 26, 2016.
19
Terry Shea, “Why Does It Cost So Much for Automakers to Develop New Models?” AutoBlog, July 27, 2010; Don Sherman, “How a Car
Is Made,” Car and Driver, November 18, 2015.
20
“The World’s Most Valuable Brands,” Forbes (https://www.forbes.com/powerful-brands/list/#tab:rank, accessed September 2, 2018).
21
Ken Roberts, “Insult to Injury: Foreign Manufacturers Now Making More Cars in U.S. than U.S. Companies,” Forbes, January 22, 2018.
22 “
Daimler to Invest $1 Billion in Alabama Plant, Create over 600 Jobs, Reuters, September 21, 2017; Anna B. Mitchell, “Tariffs Rattle
South Carolina’s Manufacturing Supply Chain,” Greenville News, June 25, 2018.
23
Adrienne Roberts and John D. Stoll, “Toyota Plant Puts Foreign Car Makers on Path to Pass Detroit in U.S. Production,” The Wall Street
Journal, January 11, 2018.
24
Ediz Ozelkan, “Global Auto Parts & Accessories Manufacturing,” IBISWorld, April 2018.
25
David Silver, “The Automotive Supply Chain, Explained,” Medium, May 30, 2016.
26
Rich Parkin, Reid Wilk, et al., “2017 Automotive Industry Trends: The Future Depends on Improving Returns on Capital,” Strategy&
(PwC), 2017.
27
“OEMs, Tier 1, 2 & 3 – The Automotive Supply Chain,” Amatech (https://www.amatechinc.com/resources/blog/tier-1-2-3-automotive-
industry-supply-chain-explained, accessed August 2, 2018).
28
J.B. Maverick, “Who Are Ford’s Main Suppliers?” Investopedia, December 12, 2017.
29
“Global Auto Parts & Accessories Manufacturing,” IBISWorld, April 2018.
30
“EV vs ICE: The Technicalities,” Teq Charging, August 4, 2017.
31
“Automotive Revolution – Perspective Towards 2030,” McKinsey & Company, January 2016.
32
Richard Vierecki, Dietmar Ahlmann, et al. “Connected Car Report 2016,” Strategy& (PwC), September 26, 2016.
33
Alan Baum, “What’s Driving the U.S. Auto Industry’s Financial Performance,” Ceres, August 7, 2017.
34
https://www.statista.com/statistics/192998/registered-passenger-cars-in-the-united-states-since-1975/, accessed May 22, 2018.
35
Jeremy Gelbart, “You May Not Live Long Enough to Ride a Driverless Car,” Newsweek, April 1, 2017.
36
“New Cars in the United States,” MarketLine, September 2017.
May 1, 2019 25You can also read