THAILAND CLIMATE RISK COUNTRY PROFILE - ReliefWeb
←
→
Page content transcription
If your browser does not render page correctly, please read the page content below

CLIMATE RISK COUNTRY PROFILE

       THAILAND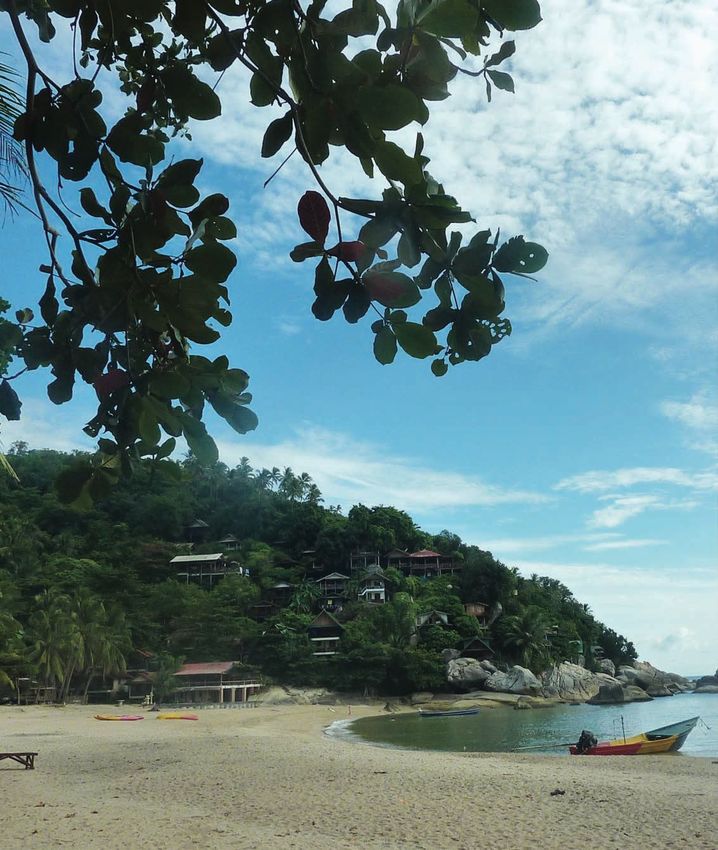
COPYRIGHT
© 2021 by the World Bank Group
1818 H Street NW, Washington, DC 20433
Telephone: 202-473-1000; Internet: www.worldbank.org

© 2021 Asian Development Bank
6 ADB Avenue, Mandaluyong City, 1550 Metro Manila, Philippines
Tel +63 2 8632 4444; Fax +63 2 8636 2444
www.adb.org

This work is a product of the staff of the World Bank Group (WBG) and the Asian Development Bank (ADB) and with external
contributions. The opinions, findings, interpretations, and conclusions expressed in this work are those of the authors’ and do not
necessarily reflect the views or the official policy or position of the WBG, its Board of Executive Directors, or the governments
it represents or of ADB, its Board of Governors, or the governments they represent.

The WBG and ADB do not guarantee the accuracy of the data included in this work and do not make any warranty, express or
implied, nor assume any liability or responsibility for any consequence of their use. This publication follows the WBG’s practice
in references to member designations, borders, and maps. ADB, however, recognizes “China” as the People’s Republic of China.
The boundaries, colors, denominations, and other information shown on any map in this work, or the use of the term “country” do
not imply any judgment on the part of the WBG or ADB, their respective Boards, or the governments they represent, concerning
the legal status of any territory or geographic area or the endorsement or acceptance of such boundaries.

The mention of any specific companies or products of manufacturers does not imply that they are endorsed or recommended
by either the WBG or ADB in preference to others of a similar nature that are not mentioned.

RIGHTS AND PERMISSIONS
The material in this work is subject to copyright. Because the WB and ADB encourage dissemination of their knowledge, this
work may be reproduced, in whole or in part, for noncommercial purposes as long as full attribution to this work is given. This
work is licensed under the Creative Commons Attribution-NonCommercial 3.0 IGO License. To view a copy of this license, visit
http://creativecommons.org/licenses/by-nc/3.0/igo/ or send a letter to Creative Commons, PO Box 1866, Mountain View,
CA 94042, USA.

This CC license does not apply to WBG or non-ADB copyright materials in this publication. If the material is attributed to another
source, please contact the copyright owner or publisher of that source for permission to reproduce it. WBG or ADB cannot be
held liable for any claims that arise as a result of your use of the material.

Please cite the work as follows: Climate Risk Country Profile: Thailand (2021): The World Bank Group and the Asian
Development Bank.

Any queries on rights and licenses, including subsidiary rights, should be addressed to World Bank Publications, The World Bank
Group, 1818 H Street NW, Washington, DC 20433, USA; fax: 202-522-2625; e-mail: pubrights@worldbank.org.

Cover Photos: © doronko, “Thailand” March 4, 2009 via Flickr, Creative Commons CC BY-NC-ND 2.0. © Sanchez Jalapeno,
“Thailand” August 17, 2011 via Flickr, Creative Commons CC BY-NCND 2.0.

Graphic Design: Circle Graphics, Inc., Reisterstown, MD.

CLIMATE RISK COUNTRY PROFILE: THAILAND                                                                                           ii
ACKNOWLEDGEMENTS
This profile is part of a series of Climate Risk Country Profiles that are jointly developed by the World Bank Group (WBG) and the
Asian Development Bank (ADB). These profiles synthesize the most relevant data and information on climate change, disaster
risk reduction, and adaptation actions and policies at the country level. The profile is designed as a quick reference source for
development practitioners to better integrate climate resilience in development planning and policy making. This effort is co-led
by Veronique Morin (Senior Climate Change Specialist, WBG), Ana E. Bucher (Senior Climate Change Specialist, WBG) and
Arghya Sinha Roy (Senior Climate Change Specialist, ADB).

This profile was written by Alex Chapman (Consultant, ADB), William Davies (Consultant, ADB) and Ciaran Downey (Consultant).
Technical review of the profiles was undertaken by Robert L. Wilby (Loughborough University). Additional support was provided
by MacKenzie Dove (Senior Climate Change Consultant, WBG), Jason Johnston (Operations Analyst, WBG), Yunziyi Lang
(Climate Change Analyst, WBG), Adele Casorla-Castillo (Consultant, ADB), and Charles Rodgers (Consultant, ADB). This profile
also benefitted from inputs of WBG and ADB regional staff and country teams.

Climate and climate-related information is largely drawn from the Climate Change Knowledge Portal (CCKP), a WBG online
platform with available global climate data and analysis based on the latest Intergovernmental Panel on Climate Change (IPCC)
reports and datasets. The team is grateful for all comments and suggestions received from the sector, regional, and country
development specialists, as well as climate research scientists and institutions for their advice and guidance on use of climate
related datasets.

CLIMATE RISK COUNTRY PROFILE: THAILAND                                                                                         iii
CONTENTS

FOREWORD  .  .  .  .  .  .  .  .  .  .  .  .  .  .  .  .  .  .  .  .  .  .  .  .  .  .  .  .  .  .  .  .  .  .  .  . 1

KEY MESSAGES .   .   .   .   .   .   .   .   .   .   .   .   .   .   .   .   .   .   .   .   .   .   .   .   .   .   .   .   .   .   .   .   .   .  2

COUNTRY OVERVIEW .   .   .   .   .   .   .   .   .   .   .   .   .   .   .   .   .   .   .   .   .   .   .   .   .   .   .   .   .   .   .  2

CLIMATOLOGY  .   .   .   .   .   .   .   .   .   .   .   .   .   .   .   .   .   .   .   .   .   .   .   .   .   .   .   .   .   .   .   .   .   .   5
   Climate Baseline .  .  .  .  .  .  .  .  .  .  .  .  .  .  .  .  .  .  .  .  .  .  .  .  .  .  .  .  .  .  .  .  .  .  .  .  .  .  .  .           5
      Overview  .  .  .  .  .  .  .  .  .  .  .  .  .  .  .  .  .  .  .  .  .  .  .  .  .  .  .  .  .  .  .  .  .  .  .  .  .  .  .  .  .  .         5
      Key Trends .  .  .  .  .  .  .  .  .  .  .  .  .  .  .  .  .  .  .  .  .  .  .  .  .  .  .  .  .  .  .  .  .  .  .  .  .  .  .  .  .           6
   Climate Future .  .  .  .  .  .  .  .  .  .  .  .  .  .  .  .  .  .  .  .  .  .  .  .  .  .  .  .  .  .  .  .  .  .  .  .  .  .  .  .  .          7
      Overview  .  .  .  .  .  .  .  .  .  .  .  .  .  .  .  .  .  .  .  .  .  .  .  .  .  .  .  .  .  .  .  .  .  .  .  .  .  .  .  .  .  .         7

CLIMATE RELATED NATURAL HAZARDS .   .   .   .   .   .   .   .   .   .   .   .   .   .   .   .   .   .   .   .   .   . 13
       Heatwaves .  .  .  .  .  .  .  .  .  .  .  .  .  .  .  .  .  .  .  .  .  .  .  .  .  .  .  .  .  .  .  .  .  .  .  .  .  .  .  .  .           13
       Drought  .  .  .  .  .  .  .  .  .  .  .  .  .  .  .  .  .  .  .  .  .  .  .  .  .  .  .  .  .  .  .  .  .  .  .  .  .  .  .  .  .  .         15
       Flood .  .  .  .  .  .  .  .  .  .  .  .  .  .  .  .  .  .  .  .  .  .  .  .  .  .  .  .  .  .  .  .  .  .  .  .  .  .  .  .  .  .  .  .      16
       Cyclones and Storm Surge  .  .  .  .  .  .  .  .  .  .  .  .  .  .  .  .  .  .  .  .  .  .  .  .  .  .  .  .  .  .  .  .  .  .                17

CLIMATE CHANGE IMPACTS .   .   .   .   .   .   .   .   .   .   .   .   .   .   .   .   .   .   .   .   .   .   .   .   .   .   .   . 18
   Natural Resources  .  .  .  .  .  .  .  .  .  .  .  .  .  .  .  .  .  .  .  .  .  .  .  .  .  .  .  .  .  .  .  .  .  .  .  .  .  .  . 18
     Water .  .  .  .  .  .  .  .  .  .  .  .  .  .  .  .  .  .  .  .  .  .  .  .  .  .  .  .  .  .  .  .  .  .  .  .  .  .  .  .  .  .  . 18
     The Coastal Zone  .  .  .  .  .  .  .  .  .  .  .  .  .  .  .  .  .  .  .  .  .  .  .  .  .  .  .  .  .  .  .  .  .  .  .  .  .  . 18
     Land and Soil  .  .  .  .  .  .  .  .  .  .  .  .  .  .  .  .  .  .  .  .  .  .  .  .  .  .  .  .  .  .  .  .  .  .  .  .  .  .  . 20
   Economic Sectors  .  .  .  .  .  .  .  .  .  .  .  .  .  .  .  .  .  .  .  .  .  .  .  .  .  .  .  .  .  .  .  .  .  .  .  .  .  .  . 21
     Agriculture .  .  .  .  .  .  .  .  .  .  .  .  .  .  .  .  .  .  .  .  .  .  .  .  .  .  .  .  .  .  .  .  .  .  .  .  .  .  .  .  . 21
     Urban and Energy  .  .  .  .  .  .  .  .  .  .  .  .  .  .  .  .  .  .  .  .  .  .  .  .  .  .  .  .  .  .  .  .  .  .  .  .  . 22
   Communities  .  .  .  .  .  .  .  .  .  .  .  .  .  .  .  .  .  .  .  .  .  .  .  .  .  .  .  .  .  .  .  .  .  .  .  .  .  .  .  .  . 23
     Poverty, Inequality, and Disaster Vulnerability  .  .  .  .  .  .  .  .  .  .  .  .  .  .  .  .  .  .  .  .  .  .  .  .  . 23
     Human Health .  .  .  .  .  .  .  .  .  .  .  .  .  .  .  .  .  .  .  .  .  .  .  .  .  .  .  .  .  .  .  .  .  .  .  .  .  .  . 24

POLICIES AND PROGRAMS  .   .   .   .   .   .   .   .   .   .   .   .   .   .   .   .   .   .   .   .   .   .   .   .   .   .   .   . 26
       National Adaptation Policies and Strategies .  .  .  .  .  .  .  .  .  .  .  .  .  .  .  .  .  .  .  .  .  .  .  .  .  . 26
       Climate Change Priorities of ADB and the WBG .  .  .  .  .  .  .  .  .  .  .  .  .  .  .  .  .  .  .  .  .  .  .  . 26

CLIMATE RISK COUNTRY PROFILE: THAILAND                                                                                                               iv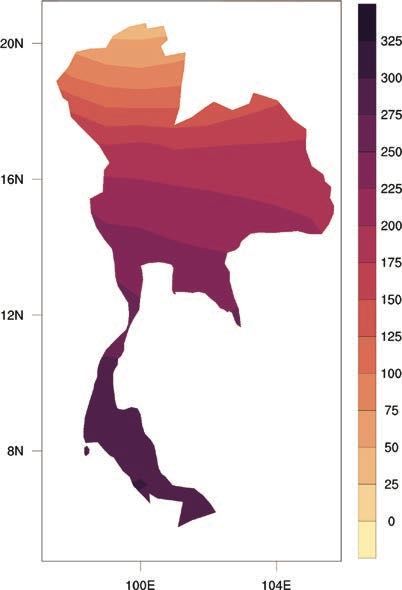
FOREWORD

Climate change is a major risk to good development outcomes, and the World Bank Group is committed to playing an important
role in helping countries integrate climate action into their core development agendas. The World Bank Group (WBG) and the
Asian Development Bank (ADB) are committed to supporting client countries to invest in and build a low-carbon, climate-
resilient future, helping them to be better prepared to adapt to current and future climate impacts.

Both institutions are investing in incorporating and systematically managing climate risks in development operations through
their individual corporate commitments.

For the World Bank Group: a key aspect of the World Bank Group’s Action Plan on Adaptation and Resilience (2019) is to help
countries shift from addressing adaptation as an incremental cost and isolated investment to systematically incorporating climate
risks and opportunities at every phase of policy planning, investment design, implementation and evaluation of development
outcomes. For all International Development Association and International Bank for Reconstruction and Development operations,
climate and disaster risk screening is one of the mandatory corporate climate commitments. This is supported by the World
Bank Group’s Climate and Disaster Risk Screening Tool which enables all Bank staff to assess short- and long-term climate
and disaster risks in operations and national or sectoral planning processes. This screening tool draws up-to-date and relevant
information from the World Bank’s Climate Change Knowledge Portal, a comprehensive online ‘one-stop shop’ for global,
regional, and country data related to climate change and development.

For the Asian Development Bank (ADB): its Strategy 2030 identified “tackling climate change, building climate and disaster
resilience, and enhancing environmental sustainability” as one of its seven operational priorities. Its Climate Change Operational
Framework 2017–2030 identified mainstreaming climate considerations into corporate strategies and policies, sector and
thematic operational plans, country programming, and project design, implementation, monitoring, and evaluation of climate
change considerations as the foremost institutional measure to deliver its commitments under Strategy 2030. ADB’s climate
risk management framework requires all projects to undergo climate risk screening at the concept stage and full climate risk
and adaptation assessments for projects with medium to high risk.

Recognizing the value of consistent, easy-to-use technical resources for our common client countries as well as to support
respective internal climate risk assessment and adaptation planning processes, the World Bank Group’s Climate Change Group
and ADB’s Sustainable Development and Climate Change Department have worked together to develop this content. Standardizing
and pooling expertise facilitates each institution in conducting initial assessments of climate risks and opportunities across sectors
within a country, within institutional portfolios across regions, and acts as a global resource for development practitioners.

For common client countries, these profiles are intended to serve as public goods to facilitate upstream country diagnostics,
policy dialogue, and strategic planning by providing comprehensive overviews of trends and projected changes in key climate
parameters, sector-specific implications, relevant policies and programs, adaptation priorities and opportunities for further actions.

We hope that this combined effort from our institutions will spur deepening of long-term risk management in our client countries
and support further cooperation at the operational level.

Bernice Van Bronkhorst                            Preety Bhandari
Global Director                                   Chief of Climate Change and Disaster Risk Management Thematic Group
Climate Change Group                              concurrently Director Climate Change and Disaster Risk Management Division
The World Bank Group                              Sustainable Development and Climate Change Department
                                                  Asian Development Bank

CLIMATE RISK COUNTRY PROFILE: THAILAND                                                                                              1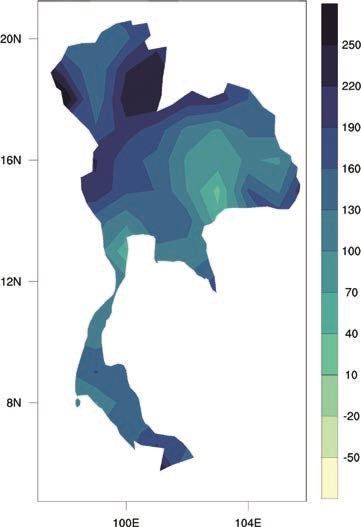
KEY MESSAGES

•     Observations show temperature increases across Thailand since the mid-20th century and an increase in
      annual precipitation. Most of this increase occurs during the wet season.
•     By the 2090s, the average temperature is projected to increase by 0.95°C–3.23°C above the 1986–2005
      baseline, with the rate of warming dependent on the emissions pathway.
•     Projected temperature increases are strongest in the south, and in daily maximum and minimum temperatures.
•     Floods are by far the greatest natural hazard facing Thailand in terms of economic and human impacts.
      Thailand is cited as one of the ten most flood-affected countries in the world. Drought and cyclone impacts
      also represent major hazards. All may intensify in future climate scenarios.
•     The number of people affected by an extreme river flood could grow by over 2 million by 2035–2044, and
      coastal flooding could affect a further 2.4 million people by 2070–2100.
•     Projections suggest that Thailand’s agriculture sector could be significantly affected by a changing climate,
      due to its location in the tropics where agricultural productivity is particularly vulnerable to temperature rises.
•     The combination of rising seas and sinking land, as well as potential cyclone-induced storm surge resulted
      from the climate change impact, place the country’s capital Bangkok in a precarious position when the net, or
      relative, rate of sea-level rise. Large amounts of critical public and private infrastructure are in areas which are
      likely to be exposed under future climate change situation.
•     The aftermath of devastating floods in 2011 provides an example of how climate change can adversely affect
      poorer people in Thailand, with studies showing that post-flood, higher income groups received more government
      compensation than lower income groups.
•     The human impacts of climate change in Thailand remain dependent on the approach to adaptation adopted,
      but there is a significant risk that the poorest and marginalized groups will experience disproportionately
      greater loss and damage.

COUNTRY OVERVIEW

T
        hailand is the 20th most populous country in the world, located at the center of Southeast Asia with a land
        area of 513,120 km2. Thailand is categorized into key areas: the northern region is hilly and mountainous,
        the northeast region is a high plain, with the central region as a large, low plain, the eastern region has
valleys and small hills, with the western region being hilly and mountainous. The southern end of the country is a
peninsula with the Andaman Sea to the west and Gulf of Thailand. Located in the tropical region, Thailand’s climate
is relatively warm all year round.1

By 2030, Thailand’s population is projected to reach about 71–77 million, with an increasing proportion living in urban
areas. Thailand’s economy is 90% based on the industrial and service sector, with the agricultural sector accounting
for only 10% (but 33% of the workforce).2 The latter half of the 20th century witnessed significant economic growth

1
    Thailand (2018). Third National Communication to the UNFCCC. URL: https://unfccc.int/sites/default/files/resource/
    Thailand%20TNC.pdf
2
    CIA (2018). The World Factbook: Thailand. URL: https://www.cia.gov/library/publications/the-world-factbook/geos/th.html

CLIMATE RISK COUNTRY PROFILE: THAILAND                                                                                        2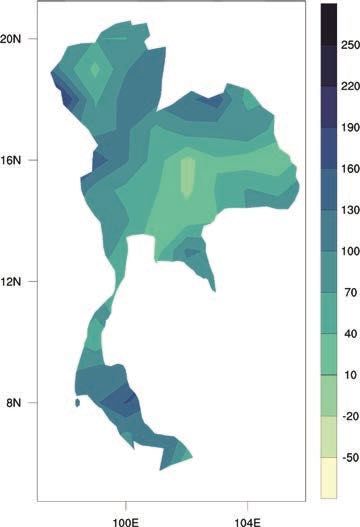
of 7.5% a year between 1960 and 1996, such that Thailand is now considered a newly industrialized country.
As a result, Thailand has reduced poverty significantly, improving the education and health circumstances for
millions of its population. Economic growth has slowed in recent decades due to a number of national and global
economic and political instabilities, and multidimensional poverty and undernourishment persist (Table 1).3 The
country has experienced slower average growth after the 1997 Asian financial crisis and 2008 global sub-prime
crisis. Thailand has experienced negative growth due to the impacts form the COIVD-19 pandemic, which has
adversely affected Thailand’s small, open economy, its export and the country’s tourism sector. To counter this,
Thailand has placed emphasis on self-reliance and resilience to external factors in its economic planning.1

Thailand submitted its Third National Communication to the UNFCCC in 2018, its Initial Nationally Determined
Contribution in 2016 and its Updated Nationally Determined Contribution in 2020. Thailand is recognized as
highly vulnerable to climate variability and change due to increasing natural hazards, such as heavy rainfall, floods,
and droughts, as well as sea level rise impacts the country’s coasts. Thailand is focusing its adaptation efforts key
sectors such as energy, water, transportation, agriculture, human settlements and public health.4

TABLE 1.  Key indicators

     Indicator                                                           Value                                    Source
     Population Undernourished        5                                    9.3% (2017–2019)                       FAO, 2020
     National Poverty Rate   6                                             9.9% (2018)                            ADB, 2020
     Share of Income Held by Bottom 20%7                                   7.2% (2018)                            World Bank, 2019
     Net Annual Migration Rate    8                                        0.03% (2015–2020)                      UNDESA, 2019
     Infant Mortality Rate (Between Age 0 and 1)      9                    0.8% (2015–2020)                       UNDESA, 2019
     Average Annual Change in Urban Population            10               1.7% (2015–2020)                       UNDESA, 2018
     Dependents per 100 Independent Adults11                             42 (2020)                                UNDESA, 2019
     Urban Population as % of Total Population12                         51.4% (2020)                             CIA, 2020
     External Debt Ratio to GNI   13                                     35.1% (2018)                             ADB, 2020
     Government Expenditure Ratio to GDP        14                       20.5% (2019)                             ADB, 2020

3
      World Bank (2018). The World Bank in Thailand URL: https://www.worldbank.org/en/country/thailand/overview [accessed 12/12/2018]
4
      Thailand (2018). Thailand’s Third National Communication. Ministry of Natural Resources and Environment. URL: https://unfccc.int/
      sites/default/files/resource/Thailand%20TNC.pdf
5
      FAO, IFAD, UNICEF, WFP, WHO (2020) The state of food security and nutrition in the world. Transforming food systems for
      affordable healthy diets. FAO. Rome. URL: http://www.fao.org/documents/card/en/c/ca9692en/
6
      ADB (2020). Basic Statistics 2020. URL: https://www.adb.org/publications/basic-statistics-2020 [accessed 27/01/21]
7
      World Bank (2019). Income share held by lowest 20%. URL: https://data.worldbank.org/ [accessed 17/12/20]
8
      UNDESA (2019). World Population Prospects 2019: MIGR/1URL: https://population.un.org/wpp/Download/Standard/Population/
      [accessed 17/12/20]
9
      UNDESA (2019). World Population Prospects 2019: MORT/1-1. URL: https://population.un.org/wpp/Download/Standard/Population/
      [accessed 17/12/20]
10
      UNDESA (2019). World Urbanization Prospects 2018: File 6. URL: https://population.un.org/wup/Download/ [accessed 17/12/20]
11
      UNDESA (2019). World Population Prospects 2019: POP/11-A. URL: https://population.un.org/wpp/Download/Standard/Population/
      [accessed 17/12/20]
12
      CIA (2020). The World Factbook. Central Intelligence Agency. Washington DC. URL: https://www.cia.gov/the-world-factbook/
13
      ADB (2020). Key Indicators for Asia and the Pacific 2020. Asian Development Bank. URL: https://www.adb.org/publications/
      key-indicators-asia-and-pacific-2020
14
      ADB (2020). Key Indicators for Asia and the Pacific 2020. Asian Development Bank. URL: https://www.adb.org/publications/
      key-indicators-asia-and-pacific-2020

CLIMATE RISK COUNTRY PROFILE: THAILAND                                                                                               3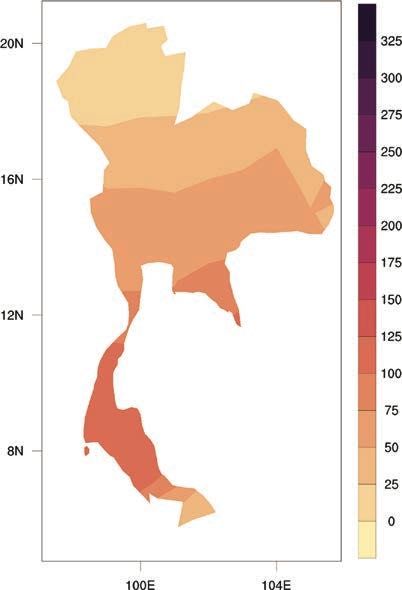
Green, Inclusive and Resilient Recovery
The coronavirus disease (COVID-19) pandemic has led to unprecedented adverse social and economic impacts.
Further, the pandemic has demonstrated the compounding impacts of adding yet another shock on top of
the multiple challenges that vulnerable populations already face in day-to-day life, with the potential to create
devastating health, social, economic and environmental crises that can leave a deep, long-lasting mark. However,
as governments take urgent action and lay the foundations for their financial, economic, and social recovery, they
have a unique opportunity to create economies that are more sustainable, inclusive and resilient. Short and long-
term recovery efforts should prioritize investments that boost jobs and economic activity; have positive impacts on
human, social and natural capital; protect biodiversity and ecosystems services; boost resilience; and advance the
decarbonization of economies.

This document aims to succinctly summarize the climate risks faced by Thailand. This includes rapid onset and
long-term changes in key climate parameters, as well as impacts of these changes on communities, livelihoods and
economies, many of which are already underway. This is a high-level synthesis of existing research and analyses,
focusing on the geographic domain of Thailand, therefore potentially excluding some international influences
and localized impacts. The core data presented is sourced from the database sitting behind the World Bank
Group’s Climate Change Knowledge Portal (CCKP),
incorporating climate projections from the Coupled
Model Inter-comparison Project Phase 5 (CMIP5).            FIGURE 1.  The ND-GAIN Index summarizes a
This document is primarily meant for WBG and ADB           country’s vulnerability to climate change and
staff to inform their climate actions. The document also   other global challenges in combination with its
aims and to direct the reader to many useful sources       readiness to improve resilience. It aims to help
of secondary data and research.                            businesses and the public sector better prioritize
                                                                       investments for a more efficient response to
Due to a combination of political, geographic, and                     the immediate global challenges ahead.
social factors, Thailand is recognized as vulnerable                          59
to climate change impacts, ranked 62nd out of
                                                                              58
181 countries in the 2020 ND-GAIN Index.15 The
ND-GAIN Index ranks 181 countries using a score                               57

which calculates a country’s vulnerability to climate
                                                                      Score

                                                                              56
change and other global challenges as well as their
readiness to improve resilience. The more vulnerable                          55

a country is the lower their score, while the more ready
                                                                              54
a country is to improve its resilience the higher it will
be. Norway has the highest score and is ranked 1st.                           53
                                                                                   1995 1997 1999 2001 2003 2005 2007 2009 2011 2013
Figure 1 is a time-series plot of the ND-GAIN Index                                  Thailand

showing Thailand’s progress.

15
     University of Notre Dame (2020). Notre Dame Global Adaptation Initiative. URL: https://gain.nd.edu/our-work/country-index/

CLIMATE RISK COUNTRY PROFILE: THAILAND                                                                                                 4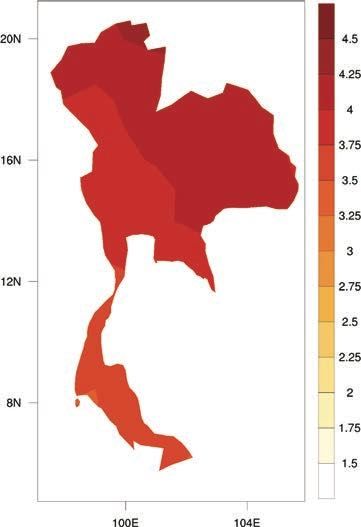
CLIMATOLOGY

 Climate Baseline
 Overview
 Thailand has a tropical climate influenced by seasonal monsoon winds. The southwest monsoon (May) brings a
 stream of warm moist air from the Indian Ocean towards Thailand, causing abundant rain over the country, especially
 the mountainous regions. This phenomenon is intensified by the Inter-Tropical Convergence Zone (ITCZ) in the
 months of May to October and tropical cyclones which produce large amounts of rainfall. The northeast monsoon,
 starting in October, brings cold and dry air from the anticyclone in China over major parts of Thailand, especially the
 northern and northeastern parts which are located at higher latitude areas. In the south, the monsoon causes mild
 weather and abundant rain along the eastern coast.16 Figure 2 provides an overview of Thailand’s seasonal climate
 cycle, but hides sub-national variations, across the latest climatology, 1991–2020. Thailand’s hottest months are
 April and May, with the coldest months experienced during December and January. The mean annual temperature is
 26.3°C, with a seasonal temperature variation of 5.7°C (between lows of 23.2°C and highs of 28.9°C). The months
 with the highest rainfall are August and September, with approximately 255 mm recorded during these months.
 The months with the highest rainfall coincide with Thailand’s monsoon season, May to October. Mean annual rainfall
 is 1,542 mm. Figure 3 shows the spatial differences of observed historical temperature and rainfall in Thailand.

 Annual Cycle

 FIGURE 2.  Average monthly temperature and rainfall in Thailand (1991–2020)17
                    32                                                                                         300
Temperature (°C)

                    28                                                                                         200
                                                                                                                     Rainfall (mm)

                    24                                                                                         100

                    20                                                                                         0
                          Jan    Feb    Mar    Apr    May     Jun    Jul   Aug      Sep   Oct    Nov    Dec

                                                       Rainfall       Temperature

 16
                   Thailand (2018). Third National Communication to the UNFCCC. URL: https://unfccc.int/sites/default/files/resource/
                   Thailand%20TNC.pdf
 17
                   WBG Climate Change Knowledge Portal (CCKP, 2021). Thailand Climate Data: Historical. URL: https://climateknowledgeportal.
                   worldbank.org/country/thailand/climate-data-historical

 CLIMATE RISK COUNTRY PROFILE: THAILAND                                                                                                        5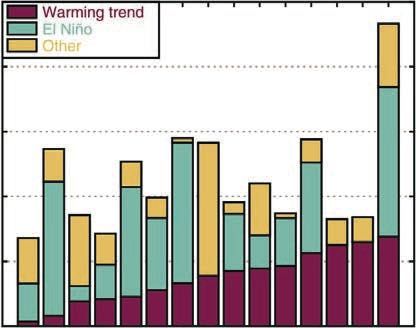
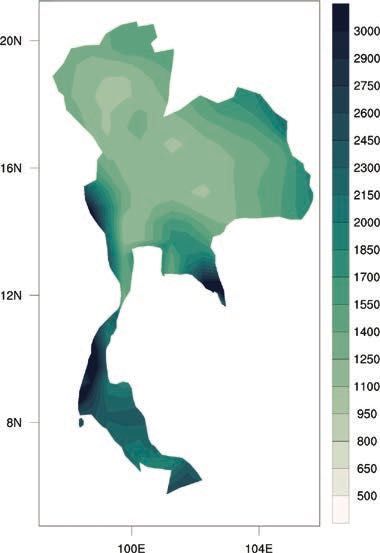
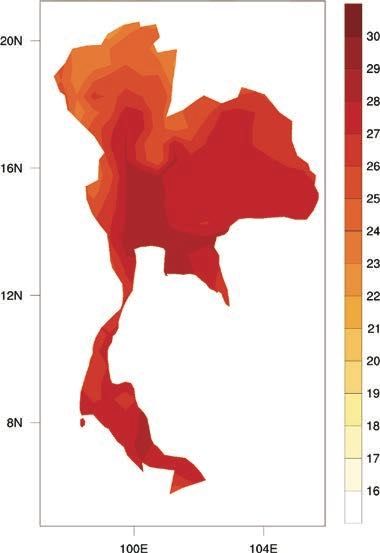
Spatial Variation

FIGURE 3.  (Left) annual mean temperature (°C), and (right) annual mean rainfall (mm) in Thailand
over the period 1991–2020.18

Key Trends
Temperature
Various studies report temperature increases across Thailand since mid-20th century. Manton et al. (2001) report a
significant increase in minimum temperatures at meteorological stations located in Thailand between 1961–1998,
as well as an increase in the number of warm nights.19 Atsamon (2011) observed increases in daily maximum, mean
and minimum temperatures at 65 meteorological stations between 1970–2006 (0.12–0.59°C, 0.10–0.40°C and
0.11–0.55°C per decade, respectively).20

18
     WBG Climate Change Knowledge Portal (CCKP, 2021). Thailand Climate Data: Projections. URL: https://climateknowledgeportal.
     worldbank.org/country/thailand/climate-data-projections
19
     Manton, M.J. & Della-Marta, Paul & Haylock, M.R. & Hennessy, K & Nicholls, Neville & Chambers, Lynda & Collins, D.A. & Daw, G &
     Finet, A & Gunawan, Dodo & Inape, Kasis & Isobe, H & Kestin, T.S. & Lefale, Penehuro & Leyu, C.H. & Lwin, T & Maitrepierre, Luc &
     Ouprasitwong, N & Page, C.M. & Yee, D. (2001). Trends in extreme daily rainfall and temperature in Southeast Asia and The South
     Pacific: 1961–1998. International Journal of Climatology. 21. 269 - 284. URL: https://rmets.onlinelibrary.wiley.com/doi/10.1002/
     joc.610
20
     Limsakul, Atsamon & Limjirakan, Sangchan & Sriburi, Thavivongse & Boochub Suttamanuswong, and. (2011). Trends in Temperature
     and Its Extremes in Thailand. Thai Environmental Engineering Journal. 25. 9–16. URL: https://www.researchgate.net/publication/
     230692853_Trends_in_Temperature_and_Its_Extremes_in_Thailand

CLIMATE RISK COUNTRY PROFILE: THAILAND                                                                                                   6
The Berkeley Earth dataset21 provides historical temperature change estimates for 1° × 1° grid cells, and can be
used to estimate warming over the 20th century. In general, it should be noted that estimates of warming over
grid cells with larger proportions of ocean cover are less reliable, but also generally show less warming. Estimated
warming around Bangkok between 1851 and 2017
(average) is 1°C. Observations show a warming of 1.4°C
over the same period in the southern town of Nakhon A Precautionary Approach
Si Thammarat, while there was an observed increase of
1.2°C in the northern town of Lampang. Studies published since the last iteration
of the IPCC’s report (AR5), such as Gasser
Precipitation et al. (2018), have presented evidence which
Studies observe an increase in annual precipitation, with an suggests a greater probability that earth will
increase in precipitation during the wet season contributing experience medium and high-end warming
most to this increase.22 Variability of precipitation in Thailand scenarios than previously estimated.25 Climate
over the 20th century was driven particularly by El Niño change projections associated with the highest
Southern Oscillation, with years of strong El Niño correlated emissions pathway (RCP8.5) are presented
with moderate and severe drought.23 A 2016 study found here to facilitate decision making which is
that while precipitation events have been less frequent robust to these risks.
across the country, they have intensified.24
Climate Future
Overview
The main data source for the World Bank Group’s Climate Change Knowledge Portal (CCKP) is the Coupled
Model Inter-comparison Project Phase 5 (CMIP5) models, which are utilized within the Fifth Assessment Report
(AR5) of the Intergovernmental Panel on Climate Change (IPCC), providing estimates of future temperature and
precipitation. Four Representative Concentration Pathways (i.e. RCP2.6, RCP4.5, RCP6.0, and RCP8.5) were
selected and defined by their total radiative forcing (cumulative measure of GHG emissions from all sources)
pathway and level by 2100. In this analysis, RCP2.6 and RCP8.5, the extremes of low and high emissions pathways,
are the primary focus where RCP2.6 represents a very strong mitigation scenario and RCP8.5 assumes business-
as-usual scenario. For more information, please refer to the RCP Database.
21
Carbon Brief (2018). Mapped: How every part of the world has warmed – and could continue to. Infographics, Berkeley Dataset.
[26 September 2018]. URL: https://www.carbonbrief.org/mapped-how-every-part-of-the-world-has-warmed-and-could-continue-
to-warm
22
Lacombe, Guillaume & Hoanh, Chu & Smakhtin, Vladimir. (2012). Multi-year variability or unidirectional trends? Mapping long-term
precipitation and temperature changes in continental Southeast Asia using PRECIS regional climate model. Climatic Change. 113.
URL: https://wle.cgiar.org/multi-year-variability-or-unidirectional-trends-mapping-long-term-precipitation-and-temperature-0
23
Lyon, B. (2004). The strength of El Nino and the spatial extent of tropical drought. Advances in Geosciences, 31. URL: https://
agupubs.onlinelibrary.wiley.com/doi/full/10.1029/2004GL020901
24
Limsakul, A. and Singhruck, P. (2016). Long-term trends and variability of total and extreme precipitation in Thailand. Atmospheric
Research, 169, pp. 301–317. URL: https://tdri.or.th/wp-content/uploads/2015/11/1-long-term-trends-main.pdf
25
Gasser, T., Kechiar, M., Ciais, P., Burke, E. J., Kleinen, T., Zhu, D., . . . Obersteiner, M. (2018). Path-dependent reductions in CO2
emission budgets caused by permafrost carbon release. Nature Geoscience. URL: http://pure.iiasa.ac.at/id/eprint/15453/
CLIMATE RISK COUNTRY PROFILE: THAILAND 7For Thailand, these models show a trend of consistent warming, which will increase towards the end of the century.
While rainfall projections are less certain and vary by both RCP scenario as well as models, projected precipitation
trends show a likely slight increase in rainfall. Tables 2 and 3 below, provide information on temperature projections
and anomalies for the four RCPs over two distinct time horizons; presented against the reference period of
1986–2005.
TABLE 2. Projected anomaly (changes °C) for maximum, minimum, and average daily temperatures
in Thailand for 2040–2059 and 2080–2099, from the reference period of 1986–2005 for all RCPs.
The table is showing the median of the CCKP model ensemble and the 10–90th percentiles
in brackets26
Average Daily Maximum Average Daily Minimum
Temperature Average Daily Temperature Temperature
Scenario 2040–2059 2080–2099 2040–2059 2080–2099 2040–2059 2080–2099
RCP2.6 1.0 (−0.6, 2.9) 1.1 (−0.6, 3.0) 1.0 (−0.3, 2.4) 1.1 (−0.2, 2.5) 1.0 (−0.1, 2.2) 1.1 (−0.2, 2.4)
RCP4.5 1.3 (−0.5, 3.3) 1.8 (0.0, 3.9) 1.4 (0.0, 2.8) 1.9 (0.4, 3.5) 1.4 (0.0, 2.7) 2.0 (0.6, 3.5)
RCP6.0 1.2 (−0.7, 3.0) 2.2 (0.4, 4.5) 1.2 (−0.4, 2.5) 2.3 (0.6, 4.1) 1.2 (−0.2, 2.4) 2.4 (0.7, 4.0)
RCP8.5 1.7 (0.0, 3.6) 3.6 (1.6, 6.1) 1.8 (0.4, 3.2) 3.8 (2.0, 5.8) 1.9 (0.5, 3.2) 3.9 (2.2, 5.9)
TABLE 3. Projections of average temperature change (°C) in Thailand for different seasons
(3-monthly time slices) over different time horizons and emissions pathways, showing the median
estimates of the full CCKP model ensemble and the 10th and 90th percentiles in bracket20
2040–2059 2080–2099
Scenario Jun–Aug Dec–Feb Jun–Aug Dec–Feb
RCP2.6 1.0 1.0 1.0 1.1
(0.2, 2.0) (−0.6, 2.6) (0.1, 2.0) (−0.4, 2.6)
RCP4.5 1.4 1.4 1.8 1.9
(0.5, 2.5) (−0.4, 2.8) (0.9, 3.0) (0.2, 3.7)
RCP6.0 1.2 1.0 2.3 2.1
(0.3, 2.3) (−0.8, 2.2) (1.2, 3.7) (0.2, 4.0)
RCP8.5 1.6 1.9 3.5 3.8
(0.6, 2.8) (0.1, 3.4) (2.4, 5.4) (1.4, 6.1)
26
WBG Climate Change Knowledge Portal (CCKP, 2021). Thailand Climate Data: Projections. URL: https://climateknowledgeportal.
worldbank.org/country/thailand/climate-data-projections
CLIMATE RISK COUNTRY PROFILE: THAILAND 8Model Ensemble
Climate projections presented in this document are
derived from datasets available through the CCKP, FIGURE 4. ‘Projected average temperature
unless otherwise stated. These datasets are processed anomaly’ and ‘projected annual rainfall
outputs of simulations performed by multiple General anomaly’ in Thailand. Outputs of 16 models
Circulation Models (GCM) (for further information see within the ensemble simulating RCP8.5
Flato et al., 2013).27 Collectively, these different GCM over the period 2080–2099. Models shown
simulations are referred to as the ‘model ensemble’. represent the subset of models within the
Due to the differences in the way GCMs represent ensemble which provide projections across
the key physical processes and interactions within all RCPs and therefore are most robust for
the climate system, projections of future climate comparison.20 Three outlier models are labelled.
conditions can vary widely between different GCMs, 6
miroc_esm_chem csiro_mk3_6_0
this is particularly the case for rainfall related variables
Average temperature anomaly (°C)
5
and at national and local scales. The range of projections
4
from 16 GCMs for annual average temperature change
and annual precipitation change in Thailand under 3
giss_e2_r
RCP8.5 is shown in Figure 4. Spatial variation 2
of future projections of annual temperature and Median,
1
10th and 90th
precipitation for mid and late century under RCP8.5 Percentiles
are presented in Figure 5. 0
–10% 0% 10% 20% 30% 40% 50%
Average annual precipitation anomaly (%)
27
Flato, G., Marotzke, J., Abiodun, B., Braconnot, P., Chou, S. C., Collins, W., . . . Rummukainen, M. (2013). Evaluation of Climate
Models. Climate Change 2013: The Physical Science Basis. Contribution of Working Group I to the Fifth Assessment Report of the
Intergovernmental Panel on Climate Change, 741–866. URL: http://www.climatechange2013.org/images/report/WG1AR5_ALL_
FINAL.pdf
CLIMATE RISK COUNTRY PROFILE: THAILAND 9Spatial Variation
FIGURE 5. CMIP5 ensemble projected change (32 GCMs) in annual temperature (top) and
precipitation (bottom) by 2040–2059 (left) and by 2080–2090 (right) relative to 1986–2005
baseline under RCP8.5.28
28
WBG Climate Change Knowledge Portal (CCKP 2021). Thailand. Climate Data. Projections. URL: https://climateknowledgeportal.
worldbank.org/country/thailand/climate-data-projections
CLIMATE RISK COUNTRY PROFILE: THAILAND 10Temperature
Projections of future temperature change are presented in three primary formats. Shown in Table 2 are the changes
in daily maximum and daily minimum temperatures over the given time period, as well as changes in the average
temperature. Figures 6 and 7 display the annual and monthly average temperature projections. While similar,
these three indicators can provide slightly different information. Monthly/annual average temperatures are
most commonly used for general estimation of climate change, but the daily maximum and minimum can explain
more about how daily life might change in a region, affecting key variables such as the viability of ecosystems,
health impacts, productivity of labor, and the yield of crops, which are often disproportionately influenced by
temperature extremes.
FIGURE 6. Historic and projected average FIGURE 7. Projected change (anomaly)
annual temperature in Thailand under in monthly temperature, shown by month,
RCP2.6 (blue) and RCP8.5 (red) estimated for Thailand for the period 2080–2099
by the model ensemble. Shading represents under RCP8.5. The value shown represents the
the standard deviation of the model median of the model ensemble with the shaded
ensemble29. areas showing the 10th–90th percentiles23.
32 8
31 7
30 6
Temperature (°C)
Temperature (°C)
29 5
28 4
27 3
26 2
25 1
1980 2000 2020 2040 2060 2080 2100 Jan Feb Mar Apr May Jun Jul Aug Sep Oct Nov Dec
Year
Historical RCP 2.6 RCP 4.5 RCP 6.0 RCP 8.5
Under the RCP8.5 emissions pathway, average temperatures are projected to increase by 3.8°C by the 2080s,
approximately 0.5°C less than the global average, and 1.1°C by the 2080s under the RCP2.6 emissions pathway,
similar to the projected global average. Under all emissions scenarios, annual average of monthly maximum and
monthly minimum temperatures are projected to increase considerably greater than projected increases in the
average temperature (Table 2). For example, under RCP8.5 emissions pathway, by the 2090s annual average
monthly maximum is projected at 3.8°C, minimum at 3.9°C compared to the annual average of 3.2°C.
As shown in Table 3 and Figure 7, there is relatively little seasonal variation in projected temperature rises, across
all emissions pathways. What is evident in Figure 7 is the high degree of uncertainty surrounding these projections.
29
WBG Climate Change Knowledge Portal (CCKP 2021). Thailand. Climate Data. Projections. URL: https://climateknowledgeportal.
worldbank.org/country/thailand/climate-data-projections
CLIMATE RISK COUNTRY PROFILE: THAILAND 11Precipitation
A majority of the ensemble models project increases in
annual precipitation rates (Figure 4 and 8). However, FIGURE 8. Boxplots showing the projected
uncertainty remains high as reflected in the range average annual precipitation for Thailand
of model estimates, and in and between emissions in the period 2080–209923.
pathways (Figure 8). This uncertainty is also seen in 2800
2600
studies applying downscaling techniques to assess
2400
precipitation changes.30 Downscaling studies in the
Precipitation (mm)
2200
upper Ping River Basin in the north of the country 2000
project rainfall extent and frequency to vary across the 1800
1600
catchment, with wet days increasing in frequency and
1400
extent during the wet season for some areas, and in 1200
the dry season for the central areas of the catchment.31 1000
Historical RCP 2.6 RCP 4.5 RCP 6.0 RCP 8.5
For the Bangkok region, one study suggests an increase
in precipitation during the rainy season by 2100.32
Downscaling studies in the upper Ping River Basin in the north of the country project rainfall extent and frequency
to vary across the catchment, with wet days increasing in frequency and extent during the wet season for some
areas, and in the dry season for the central areas of the catchment.
The poor performance of global climate models in consistently projecting precipitation trends has been linked to
their poor simulation of the El Niño phenomenon,33,34 an important area for future development. While considerable
uncertainty surrounds projections of local long-term future precipitation trends (see Figure 8) some global trends
are evident. The intensity of sub-daily extreme rainfall events appears to be increasing with temperature, a finding
supported by evidence from different regions of Asia.35
30
Lacombe, G., Hoanh, C. T., & Smakhtin, V. (2012). Multi-year variability or unidirectional trends? Mapping long-term precipitation
and temperature changes in continental Southeast Asia using PRECIS regional climate model. Climatic Change, 113(2), 285–299.
URL: http://publications.cirad.fr/une_notice.php?dk=593587
31
Saengsawang, S., Pankhao, P., Kaprom, C. and Sriwongsitanon, N., 2017. Projections of future rainfall for the upper Ping River Basin
using regression-based downscaling. Advances in Climate Change Research, 8(4), pp. 256–267. URL: https://www.sciencedirect.
com/science/article/pii/S1674927817300084
32
Vu, M.T., Aribarg, T., Supratid, S., Raghavan, S.V. and Liong, S.Y., 2016. Statistical downscaling rainfall using artificial neural
network: significantly wetter Bangkok?. Theoretical and applied climatology, 126(3–4), pp. 453–467. URL: https://www.tib.eu/en/
search/id/BLSE%3ARN379732731/Statistical-downscaling-rainfall-using-artificial/
33
Yun, K.S., Yeh, S.W. and Ha, K.J. (2016).. Inter-El Niño variability in CMIP5 models: Model deficiencies and future changes. Journal of
Geophysical Research: Atmospheres, 121, 3894–3906. URL: https://ui.adsabs.harvard.edu/abs/2016JGRD..121.3894Y/abstract
34
Chen, C., Cane, M.A., Wittenberg, A.T. and Chen, D. 2017. ENSO in the CMIP5 simulations: life cycles, diversity, and responses to
climate change. Journal of Climate, 30, 775–801. URL: https://journals.ametsoc.org/jcli/article/30/2/775/96236/ENSO-in-the-
CMIP5-Simulations-Life-Cycles
35
Westra, S., Fowler, H. J., Evans, J. P., Alexander, L. V., Berg, P., Johnson, F., Kendon, E. J., Lenderink, G., Roberts, N. (2014). Future
changes to the intensity and frequency of short-duration extreme rainfall. Reviews of Geophysics, 52, 522–555. URL: https://
agupubs.onlinelibrary.wiley.com/doi/full/10.1002/2014RG000464
CLIMATE RISK COUNTRY PROFILE: THAILAND 12CLIMATE RELATED NATURAL HAZARDS
Thailand faces high exposure to natural hazard risks and is ranked 81st out of 191 countries by the 2019 Inform
Risk Index36 (Table 4). Thailand has extremely high exposure to flooding (ranked 9th), including, riverine, flash,
and coastal flooding. Thailand also has exposure to tropical cyclones and their associated hazards (ranked 27th).
Drought exposure is also significant (ranked 29th). Thailand’s overall ranking on the INFORM risk index is somewhat
mitigated by its coping capacity and the levels of social vulnerability in its population, both of which are scored
higher than most other countries in the region. The section which follows analyses climate change influences on
the exposure component of risk in Thailand. The following section focuses on the climate change implications for
the natural hazard exposure component of risk in Thailand. As seen in Figure 1, the ND-GAIN Index presents
an overall picture of a country’s vulnerability and capacity to improve its resilience. In contrast, the Inform Risk
Index identifies specific risks across a country to support decisions on prevention, preparedness, response and a
country’s overall risk management.
TABLE 4. Selected indicators from the INFORM 2019 index for risk management for Thailand.
For the sub-categories of risk (e.g. “Flood”) higher scores represent greater risks. Conversely the
most at-risk country is ranked 1st. Global average scores are shown in brackets.
Lack of Overall
Tropical Coping Inform
Flood Cyclone Drought Vulnerability Capacity Risk Level Rank
(0–10) (0–10) (0–10) (0–10) (0–10) (0–10) (1–191)
8.8 [4.5] 4.9 [1.7] 5.7 [3.2] 3.1 [3.6] 3.9 [4.5] 4.1 [3.8] 81
Heatwaves
Thailand regularly experiences high maximum FIGURE 9. Projected changes in the probability
temperatures, with an average monthly maximum of of observing a heat wave in Thailand for the
around 31.6°C and an average April maximum of period 2080–2099. A ‘Heat Wave’ is defined
35.1°C. The current median probability of a heat wave as a period of 3 or more days where the
(defined as a period of 3 or more days where the daily daily temperature is above the long-term
temperature is above the long-term 95th percentile 95th percentile of daily mean temperature23.
of daily mean temperature) is around 3%23. Under all
0.8
emissions pathways, the likelihood of experiencing a 0.7
heat wave increases considerably by 2080–2099, 0.6
up to 18% under the RCP6.0 pathway and 31%
Daily probability
0.5
under the RCP8.5 pathway (see Figure 9). 0.4
0.3
There is considerable spatial variation in projected 0.2
0.1
likelihood of experiencing heatwave: in the southern
0
areas of the country, the probability of heat wave per Historical RCP 2.6 RCP 4.5 RCP 6.0 RCP 8.5
annum is as high as 73% by the 2090s (under RCP8.5
36
European Commission (2019). INFORM Index for Risk Management. Thailand Country Profile. URL: https://drmkc.jrc.ec.europa.eu/
inform-index/INFORM-Risk/Country-Profile/moduleId/1767/id/386/controller/Admin/action/CountryProfile
CLIMATE RISK COUNTRY PROFILE: THAILAND 13emissions pathway) but as low as 17% in the northern regions under the same scenario (Figure 9). However, these
changes need to be interpreted with regard to the baseline (1986–2005) against which changes are measured.
Historically stable environments, as found in many tropical regions (particularly Southern Thailand), will see more
significant increases in heatwave simply due to long-term warming which moves ambient temperatures away from
the baseline. Another measure of future heat-hazard risk is the number of days each year in which temperatures
reach levels dangerous to human life. By the 2080s, Thailand is projected to experience very significant increases
in the number of days in which Heat Index exceeds 35°C, particularly under higher emissions pathways
(RCP6.0 and 8.5) (Figure 10).
FIGURE 10. Projected changes in the number of days with a Heat Index above 35°C by 2080–2099
under RCP8.5 emissions pathways.20
One study suggests climate change made a 29% contribution to the extreme temperatures experienced across
Southeast Asia in April 2016, while ENSO contributed 49%.37 The contribution of general global warming to
extreme temperatures has been growing (Figure 11), while the contribution of climate change through its impact
on the ENSO process is poorly understood.
37
Thirumalai, K., DiNezio, P. N., Okumura, Y., & Deser, C. (2017). Extreme temperatures in Southeast Asia caused by El Niño and worsened
by global warming. Nature Communications: 8: 15531. URL: https://www.nature.com/articles/ncomms15531
CLIMATE RISK COUNTRY PROFILE: THAILAND 14Drought
Two primary types of drought may affect Thailand,
meteorological (usually associated with a FIGURE 11. Observations: The relative
precipitation deficit) and hydrological (usually contribution of El Niño (green bars) versus the
associated with a deficit in surface and subsurface long-term warming trend (red bars) towards
water flow, potentially originating in the region’s the 15 hottest April SATs (>80th percentile) in
wider river basins). Local soil and land management the GISTEMP record of Southeast Asia (MSA;
practices can also interact with the hydrological 1940–2016) using a regression model. The
conditions to result in agricultural drought. At present residual of the observed anomaly and the
Thailand faces an annual median probability of regression fit is termed as ‘other’ variability
severe meteorological drought of around 4%23, as (yellow bars). The years in red on the x-axis
defined by a standardized precipitation evaporation indicate the eight hottest extreme April events
index (SPEI) of less than −2. This is projected to (>90th percentile), from Thirumalai et al. (2017)30
double by 2080–2099 under RCP6.0 and RCP8.5 a Observations
2.5
emissions pathways, but uncertainty in the model Warming trend
El Niño
estimates is high (see Figure 12). Other
Regression-based contribution to hot
2.0
Naumann et al. (2018) provide a global overview
April SAT anomaly (°C)
of changes in drought conditions under different 1.5
warming scenarios. In comparison to West and
Central Asia, South East Asia is less likely to 1.0
experience extreme increases in drought intensity. 38
Nevertheless, it is likely to experience more 0.5
prolonged periods of drought. In Western Thailand,
39
El Niño-related droughts have become more frequent 0
80
83
90
91
92
95
98
01
03
04
05
10
13
14
16
and severe concurrently with increasing CO2 levels
20
20
20
20
20
20
20
20
19
19
19
19
19
19
19
Year of hot April
and as such likely to increase under all RCP
emissions pathways. 40 With increased drought
conditions, as well as increases in temperature, Thailand is at risk from heightened air pollution, particularly for
major urban areas. These conditions are also likely to increase the country’s risk for forest fires, which will impact
air quality, particularly for harmful particulate matter (PM2.5), population health and can impact revenue from the
tourism sector.
38
Naumann, G., Alfieri, L., Wyser, K., Mentaschi, L., Betts, R. A., Carrao, H., . . . Feyen, L. (2018). Global Changes in Drought Conditions
Under Different Levels of Warming. Geophysical Research Letters, 45(7), 3285–3296. URL: https://agupubs.onlinelibrary.wiley.com/
doi/10.1002/2017GL076521
39
Nock, Charles & Baker, Patrick & Wanek, Wolfgang & Leis, Albrecht & Grabner, Michael & Bunyavejchewin, Sarayudh & Hietz, Peter.
(2011). Long-term increases in intrinsic water-use efficiency do not lead to increased stem growth in a tropical monsoon forest in
Thailand. Global Change Biology. 17(2). pp1049-1063. URL: https://onlinelibrary.wiley.com/doi/full/10.1111/j.1365-2486.2010.02222.x
40
Thailand (2018). Third National Communication to the UNFCCC. URL: https://unfccc.int/sites/default/files/resource/
Thailand%20TNC.pdf
CLIMATE RISK COUNTRY PROFILE: THAILAND 15Flood
The World Resources Institute’s AQUEDUCT Global
Flood Analyzer can be used to establish a baseline FIGURE 12. Annual probability of
level of flood exposure to large-scale river flooding. experiencing a ‘severe drought’ in Thailand
As of 2010, assuming protection for up to a 1 in (−2 SPEI Index) in 2080–2099 under four
25-year event, the population annually affected by emissions pathways23.
river flooding in Thailand is estimated at 1.1 million 0.7
people and expected annual urban damage is 0.6
estimated at $1.6 billion. Development and climate 0.5
Probability
change are both likely to increase these figures. The 0.4
climate change component can be isolated and by 0.3
2030 is expected to increase the annually affected 0.2
population by 500,000 people, and urban damage 0.1
by $6.9 billion under the RCP8.5 emissions pathway 0
Historical RCP 2.6 RCP 4.5 RCP 6.0 RCP 8.5
(AQUEDUCT Scenario B). 41
Paltan et al. (2018) demonstrate that even under lower emissions pathways coherent with the Paris Climate
Agreement almost all Asian countries face an increase in the frequency of extreme river flows. What would historically
have been a 1 in 100-year flow, could become a 1 in 50-year or 1 in 25-year event in most of South, Southeast, and
East Asia.42 There is good agreement among models on this trend.
Floods are by far the major natural hazard facing Thailand in terms of frequency and damage – the country is cited
as one of the ten most flood-affected in the world.43 According to the UNISDR,44 the average annual loss associated
with flooding in Thailand is approximately US$2.6 billion, which represents almost 100% of losses associated with
hazards. Studies suggest flooding incidence across the country are likely to increase as a result of climate change,
with higher frequency of intense rainfall events contributing to irregular riverbank overflow, flash floods in urban
areas and landslides and flash floods in mountain areas. Coastal areas are also likely to experience more flooding
from sea-level rise (see The Coastal Zone section).45,46
41
WRI (2018). AQUEDUCT Global Flood Analyzer. URL: https://floods.wri.org/# [Accessed: 22/11/2018]
42
Paltan, H., Allen, M., Haustein, K., Fuldauer, L., & Dadson, S. (2018). Global implications of 1.5°C and 2°C warmer worlds on extreme
river flows Global implications of 1.5°C and 2°C warmer worlds on extreme river flows. Environmental Research Letters, 13, 094003.
URL: https://iopscience.iop.org/article/10.1088/1748-9326/aad985/meta
43
Loo, Yen Yi & Billa, Lawal & Singh, Ajit. (2014). Effect of climate change on seasonal monsoon in Asia and its impact on the variability
of monsoon rainfall in Southeast Asia. Geoscience Frontiers. 36 (6), 817–823. URL: https://www.sciencedirect.com/science/article/
pii/S167498711400036X
44
UNISDR (2014). PreventionWeb: Basic country statistics and indicators. Available at: https://www.preventionweb.net/countries
45
Lebel, Louis & Manuta, Jesse & Garden, Po. (2010). Institutional traps and vulnerability to changes in climate and flood regimes in
Thailand. Regional Environmental Change. 11. 45–58. URL: https://link.springer.com/article/10.1007/s10113-010-0118-4
46
Promchote, Parichart & Wang, Shih-Yu & Johnson, Paul. (2015). The 2011 Great Flood in Thailand: Climate Diagnostics and
Implications from Climate Change. Journal of Climate. 29 (1) 367–379. URL: https://pdfs.semanticscholar.org/a47b/
2acca30c2039169a040e4583a6cc7467078f.pdf
CLIMATE RISK COUNTRY PROFILE: THAILAND 16Willner et al. (2014)47 suggest that the median increase in the population affected by an extreme (90th percentile)
flood by 2035–2044 is approximately 2.3 million people (this estimation based on fixed present-day distribution of
population) (see Table 5). This represents an increase of 258% from the population exposed to extreme flooding
in 1971–2004.
TABLE 5. Estimated number of people in Thailand affected by an extreme river flood (extreme
flood is defined as being in the 90th percentile in terms of numbers of people affected) in the
historic period 1971–2004 and the future period 2035–2044. Figures represent an average of
all four RCPs and assume present day population distributions.40
Population Exposed Population Exposed Increase
to Extreme Flood to Extreme Flood in Affected
Estimate (1971–2004) (2035–2044) Population
16.7 Percentile 312,568 1,194,555 881,987
Median 886,335 3,177,190 2,290,855
83.3 Percentile 2,184,124 4,941,744 2,757,620
Cyclones and Storm Surge
Climate change is expected to interact with cyclone hazard in complex ways which are currently poorly understood.
Known risks include the action of sea-level rise to enhance the damage caused by cyclone-induced storm surges,
and the possibility of increased windspeed and precipitation intensity. Modelling of climate change impacts
on cyclone intensity and frequency conducted across the globe points to a general trend of reduced cyclone
frequency and increased intensity and frequency of the most extreme events.48 Further research is required to
better understand potential changes in cyclone seasonality and routes, and the potential for cyclone hazards to be
experienced in unprecedented locations.
Studies suggest that the frequency of extreme rainfall events (greater than 100mm in one day) are likely to become
more commonplace as result of climate warming.49 Thailand’s Second National Communication to the UNFCC
expects an increase in typhoons reaching Thailand between 2013 and 2043, while the number of monsoon storms
are projected to stay relatively stable during the same time-period. Higher sea levels and wetter pre-monsoon
conditions increase the risk of large-scale flooding, as experienced in 2011.50
47
Willner, S., Levermann, A., Zhao, F., Frieler, K. (2018). Adaptation required to preserve future high-end river flood risk at present levels.
Science Advances: 4:1. URL: https://advances.sciencemag.org/content/4/1/eaao1914
48
Walsh, K., McBride, J., Klotzbach, P., Balachandran, S., Camargo, S., Holland, G., Knutson, T., Kossin, J., Lee, T., Sobel, A., Sugi, M.
(2015). Tropical cyclones and climate change. WIREs Climate Change: 7: 65–89. URL: https://onlinelibrary.wiley.com/doi/full/
10.1002/wcc.371
49
USAID (2014). Thailand Climate Change Vulnerability Profile. URL: http://cmsdata.iucn.org/downloads/thailand_country_profile___
june2014_press.pdf
50
Promchote, P., Wang, S.Y.S. and Johnson, P.G. (2016). The 2011 great flood in Thailand: Climate diagnostics and implications
from climate change. Journal of Climate, 29(1), pp. 367–379. URL: https://journals.ametsoc.org/jcli/article/29/1/367/35049/
The-2011-Great-Flood-in-Thailand-Climate
CLIMATE RISK COUNTRY PROFILE: THAILAND 17CLIMATE CHANGE IMPACTS
Natural Resources
Water
Thailand’s NC2 describes the country’s water resources: 25 watershed areas, 6.4 million hectares irrigated,
14.6 million hectares rain-fed, with approximately a quarter of its 800 billion m3/year rainfall becoming utilizable
surface water and a total water storage capability of 74 billion cum., of which 90% is made of large and medium-
sized reservoirs. It is predicted water demand could rise to 120 billion m3/year as a result of population and
economic growth, threatening socio-economic development.1
Two river systems account for most water flows over Thailand’s land surface: namely the Mekong River in the east,
and Chao Phraya in the north and central regions. Both systems have been significantly influenced by human
development impacts on land cover. Issues such as deforestation and agricultural intensification have reduced
water retention and increased flood potential. Under climate change, most studies suggest flow volumes are likely
to increase under most emissions pathways and time horizons. One study showed a particularly large increase
(>20%) in runoff in the central province of Nakhon Sawan.51 The net change in runoff from the northeastern
region of Thailand which feeds the Mekong River is less clear, with models disagreeing on the direction of change.
However, there is convincing evidence that peak flows could increase, by 5–10% by 2036–2065.52 Future flows
in the Mekong River are also likely to be affected by the operation of hydropower dams.53
While overall annual precipitation is projected to increase, rainfall during some periods may decrease, such as
between September and October. This, alongside a less stable runoff regime, may have consequences for rice
agriculture, increasing water stress and requiring greater irrigated water requirements54 (see Agriculture section).
The Coastal Zone
Sea-level rise threatens significant physical changes to coastal zones around the world. Global mean sea-level rise
was estimated in the range of 0.44–0.74m by the end of the 21st century by the IPCC’s Fifth Assessment Report
but some studies published more recently have highlighted the potential for greater rises (Table 6).55
51
Kotsuki, S., Tanaka, K., & Watanabe, S. (2014). Projected hydrological changes and their consistency under future climate in the
Chao Phraya River Basin using multi-model and multi-scenario of CMIP5 dataset. Hydrological Research Letters, 8(1), 27–32.
URL: https://www.jstage.jst.go.jp/article/hrl/8/1/8_27/_article
52
Hoang, L. P., Lauri, H., Kummu, M., Koponen, J., Vliet, M. T. H. Van, Supit, I., . . . Ludwig, F. (2016). Mekong River flow and hydrological
extremes under climate change. Hydrology and Earth System Sciences, 20, 3027–3041. URL: https://hess.copernicus.org/articles/
20/3027/2016/
53
Räsänen, T.A., Someth, P., Lauri, H., Koponen, J., Sarkkula, J. and Kummu, M. (2017). Observed river discharge changes due to
hydropower operations in the Upper Mekong Basin. Journal of hydrology, 545, pp. 28–41. URL: https://research.aalto.fi/en/
publications/observed-river-discharge-changes-due-to-hydropower-operations-in-
54
Boonwichai, Siriwat & Shrestha, Sangam & Babel, Mukand & Weesakul, Sutat & Datta, Avishek. (2018). Climate change impacts
on irrigation water requirement, crop water productivity and rice yield in the Songkhram River Basin, Thailand. Journal of Cleaner
Production. 198, 1–1652. URL: https://www.x-mol.com/paper/744044?recommend
55
Church, J. a., Clark, P. U., Cazenave, A., Gregory, J. M., Jevrejeva, S., Levermann, A., . . . Unnikrishnan, A. S. (2013). Sea level change.
In Climate Change 2013: The Physical Science Basis. Contribution of Working Group I to the Fifth Assessment Report of the
Intergovernmental Panel on Climate Change (pp. 1137–1216). Cambridge, United Kingdom and New York, NY, USA: Cambridge
University Press. URL: https://www.ipcc.ch/site/assets/uploads/2018/02/WG1AR5_Chapter13_FINAL.pdf
CLIMATE RISK COUNTRY PROFILE: THAILAND 18You can also read