The 2021 update of the EPA's adverse outcome pathway database
←
→
Page content transcription
If your browser does not render page correctly, please read the page content below
www.nature.com/scientificdata

               OPEN           The 2021 update of the EPA’s
Data Descriptor               adverse outcome pathway
                              database
                              Holly M. Mortensen1 ✉, Jonathan Senn2, Trevor Levey2,3, Phillip Langley2,4 &
                              Antony J. Williams5

                              The EPA developed the Adverse Outcome Pathway Database (AOP-DB) to better characterize adverse
                              outcomes of toxicological interest that are relevant to human health and the environment. Here we
                              present the most recent version of the EPA Adverse Outcome Pathway Database (AOP-DB), version
                              2. AOP-DB v.2 introduces several substantial updates, which include automated data pulls from the
                              AOP-Wiki 2.0, the integration of tissue-gene network data, and human AOP-gene data by population,
                              semantic mapping and SPARQL endpoint creation, in addition to the presentation of the first publicly
                              available AOP-DB web user interface. Potential users of the data may investigate specific molecular
                              targets of an AOP, the relation of those gene/protein targets to other AOPs, cross-species, pathway, or
                              disease-AOP relationships, or frequencies of AOP-related functional variants in particular populations,
                              for example. Version updates described herein help inform new testable hypotheses about the etiology
                              and mechanisms underlying adverse outcomes of environmental and toxicological concern.

                              Background & Summary
                              There is a need for approaches to understand the biological mechanism of adverse outcomes and human varia-
                              bility in response to environmental chemical exposure. A recent legislation, the Frank R. Lautenberg Chemical
                              Safety for the twenty-first Century Act of 20161, requires the US Environmental Protection Agency to evaluate
                              new and existing toxic chemicals with explicit consideration of susceptible populations of all types (life stage,
                              exposure, genetic, etc.). In addition, on September 10, 2019, EPA Administrator Andrew Wheeler signed a direc-
                              tive that prioritizes efforts to reduce animal testing. In response to this directive, the EPA has developed a 2019
                              Strategic Plan to Promote the Development and Implementation of Alternative Test Methods Strategies (or New
                              Approach Methodologies (NAMs)) per TSCA Section 4(h)(2)(C). The EPA Adverse Outcome Pathway Database
                              (AOP-DB) is a decision support tool developed by the EPA’s Center for Public Health and Environmental
                              Assessment, which contributes to NAMs (e.g. computational toxicology tools) used for TSCA. The EPA Adverse
                              Outcome Pathway Database (AOP-DB) is a database resource that combines different data types (AOP, gene,
                              chemical, disease, pathway, orthology, and ontology) to characterize the impacts of chemicals to human health
                              and the environment2, and for the characterization of human genetic susceptibility for the purpose of human
                              health risk assessment3. The AOP-DB was originally developed with the primary aim of integrating AOP molec-
                              ular target information with other publicly available datasets and related toxicological data, to facilitate compu-
                              tational analyses of AOP information. Near term goals for use of the AOP-DB are to address the biological and
                              mechanistic aspects of alternative test methods in terms of the adverse outcome pathway construct to facilitate
                              Integrated Approaches to Testing and Assessment (IATA) for regulatory purposes4–6.
                                  Here we present an updated version of the database, AOP-DB v.2, which includes an increased number of
                              adverse outcomes and corresponding key events derived from updated feeds from the AOP-Wiki 2.0 (https://
                              AOP-Wiki.org/), as well as updated chemical, disease, tissue, individual and population level data and ontology
                              information. In this second iteration of the database, we update all code and previously described data from

                              1
                               Center for Public Health and Environmental Assessment, Office of Research and Development, U.S. Environmental
                              Protection Agency, 109 T.W. Alexander Dr., Research Triangle Park, NC, 27709, USA. 2Oak Ridge Associated
                              Universities, Research Triangle Park, NC, 27709, USA. 3Present address: SAS Institute 100 SAS Campus Dr, Cary, NC,
                              27513, USA. 4Present address: International Farming Corporation, LLC, 1318 Dale St, Raleigh, NC, 27605, USA. 5Center
                              for Computational Toxicology and Exposure, Office of Research and Development, U.S. Environmental Protection
                              Agency, 109 T.W. Alexander Dr., Research Triangle Park, NC, 27709, USA. ✉e-mail: mortensen.holly@epa.gov

  Scientific Data |   (2021) 8:169 | https://doi.org/10.1038/s41597-021-00962-3                                                                 1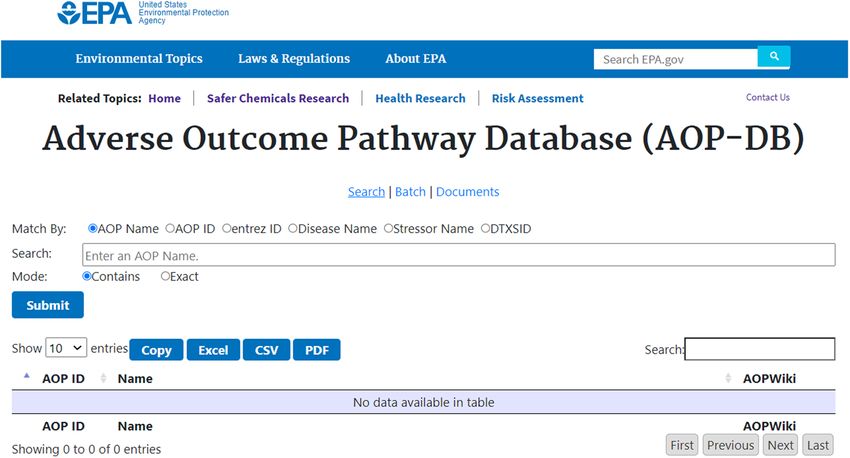
www.nature.com/scientificdata/                                                                     www.nature.com/scientificdata

                             Data Table          Data Type                       Count
                             Gene Info           Unique gene IDs                 24609215
                             Gene Interactions   Pairwise gene interaction scores 4.83E + 08
                             Species Info        Entrez-supported organisms      26554
                                                 Orthologous Groups              64930
                             Homology Gene
                                                 Taxa supported by ortho groups 605
                             AOP Info            Supported AOPs                  261
                             AOP gene            AOP gene associations           758
                             Chemical Info       CTD chemicals                   170956
                             Chemical gene       chemical-gene associations      1206437
                             AOP Stressor        DTX-AOP associations            654
                             ToxCast Assays      Assays                          406
                                                 Pathways                        110889
                             Pathway Gene
                                                 Pathway-entrez links            6412846
                                                 Diseases                        24166
                             Disease Gene
                                                 Disease-gene associations       628685
                                                 GO terms                        26739
                             GO Gene
                                                 GO-gene associations            1698353
                                                 tissues                         145
                             Tissue Networks
                                                 edges                           16957011
                                                 refsnp_ids                      2464
                             SNPS
                                                 AOP gene associations           5217
                             SNP frequencies     populations                     5
                             Haplotypes          samples                         2504

                            Table 1. AOP-DB tables with Summary Count information.

                            AOP-DB version 1, as well as provide integration with three new data areas: tissue, individual and population
                            level data. We discuss the collaborative semantic mapping efforts for AOP-DB data, and highlight the AOP-DB
                            web user interface, which will be deployed to the public in 2021.
                                Pittman et al.2 presented the first version of the AOP-DB which focused on chemical and species-specific
                            analyses. Mortensen et al.3 developed a computational approach that implements the AOP-DB to integrate mech-
                            anistic data associated with an AOP with data capturing human genetic variability and function, for the pur-
                            pose of characterizing human molecular variation that may impact individual and population level responses
                            to environmental chemicals. The human individual and population level data included in AOP-DB v.2 provide
                            the relevant data sources and organizational structure to envision the approach presented by Mortensen et al.3.
                            We believe that this work represents a first step in organizing a coherent research program in molecular environ-
                            mental adverse outcomes. Current and future work will focus on the application and interrogation of these data
                            for case study examples, the development of computational, quantitative AOP (qAOP) models for estimation of
                            chemical-MIE protypes, and machine learning methods to understand human susceptibility and variation in
                            functional response that will inform chemical safety assessment.

                            Methods
                            Data included in the AOP-DB v.2 represent an aggregation of publicly available sources associated with adverse
                            outcome pathways. All data included in AOP-DB v.2 were acquired or generated as detailed below. Online-Only
                            Table 1 lists the current data sources integrated in the AOP-DB v.2. Table 1 lists the actual record count for inte-
                            grated data within the AOP-DB v.2. For example, 261 supported AOPs in the AOP-DB v.2, as indicated in Table 1,
                            indicates there are 261 unique, expert-derived AOPs that map to one or more unique gene or protein accession
                            numbers. Similarly, for those 261 AOPs, 1029 chemical stressors map chemical ID to AOP ID, underlining a
                            unique AOP-chemical association. The AOP-DB v.2 contains a full list of AOP stressors obtained and updated
                            from the AOP-Wiki 2.0, which is available and updated as part of the OECD supported AOP Knowledge Base
                            (AOP-KB) through e.AOP.Portal (https://aopkb.oecd.org/).
                               Methods and included data sources presented here reflect the AOP-DB v.2 as of May 5th, 2021. In addi-
                            tion to regular updates to the AOP-DB, we anticipate that additional data will be added to the database over
                            time. The addition of new data will be announced via the AOP-DB web user interface https://aopdb.epa.gov/, on
                            the AOP-DB ‘Home’ page https://www.epa.gov/healthresearch/adverse-outcome-pathway-aop-database, and the
                            CompTox Chemicals Dashboard (https://comptox.epa.gov/dashboard/), hereafter referred to as the “Dashboard”,
                            on the ‘News’ page, (https://comptox.epa.gov/dashboard/news_info) and ‘Downloads’ (https://comptox.epa.gov/
                            dashboard/downloads) pages, as appropriate. The third-party data sets included in the AOP-DB v.2, and addi-
                            tional details of methods used for any modifications performed in the integration process, are described briefly
                            below and with full details in Fig. 1 and Online-only Table 1.

                            AOP-DB v.2. Data selection and collection methods match closely with those used for AOP-DB v.12. AOP-DB
                            v.2 implements the AOP set available with the AOP-Wiki 2.0 (https://aopwiki.org/). AOP-DB v.12 links AOPs to

Scientific Data |   (2021) 8:169 | https://doi.org/10.1038/s41597-021-00962-3                                                                 2
www.nature.com/scientificdata/ www.nature.com/scientificdata
snp_frequencies gene_interactions GO_gene disease_gene
Table Table Table Table
chemical_gene get_gene_interactions() get_GO_gene() get_disease_gene
Table get_snp_frequencies()
pathway_gene homology_gene
1000 STRING STRING Disgenet Table
Genomes Gene UniProt GO Terms Disease-Gene Table
get_chemical_gene() VCs Interactions Maps Associations
snps Table
get_pathway_gene() get_homology_gene()
tissue_networks
CTD Gene
Table
Interactions CPDB
get_snps() Taxonomy
Pathway-to-entrez
Maps
chemical_info get_tissue_networks() Pathway-to-Taxonomy Map Entrez-to-Taxonomy
Table Map Map
GTEX SNPs
GWAS
SNPs Selected gene_info
AOP_stressor Tissues update_taxmaps()
get_chemical_info() Table
Table
NCBI
AOP_info event_info AOP_gene
Discontinued
Table Table Table KEGG
Gene Data Species_info
CTD get_gene_info() Organisms
Chemicals get_aop_stressor() Table in NCBI
TC Assay NCBI Gene
get_AOP_info() get_event_info() get_aop_gene() get_species_info()
Table Data
stressor_info
Table
NCBI
get_TC_assays() Taxonomy
Dump
get_stressor_info()
AOP Wiki
XML EPA
ProteinID-to-Uniprot
ToxCast
Map Ortho_Scores
Assays
AOP-DB data table Table
UniprotKB-to-Entrez id_mapping
AOP-DB sub-routine get_orthoscores()
Map Table
remotely accessed data update_upmap()
metaPhOrs-to-External Species
Maps Orthologs
Uniprot metaPhOrs-to-UniProt metaPhOrs
locally housed data
Mappings Maps Species
Info
Fig. 1 AOP-DB Data Structure. Green, Ovals indicate data tables in the AOP-DB SQL relational database; Blue,
Diamonds indicate local, post-processing files necessary, where modified data are stored; Yellow, Rectangles
indicate corresponding subroutines necessary to process source data; and Red, Diamonds indicate publicly
available, third party source data included in AOP-DB v.2. Arrow edges indicate foreign key relationships.
gene and protein accession numbers manually using the concept of the Event-Component using selected gene
and protein ontologies, according to the methods described in Ives et al.7. The AOP-Wiki 2.0 reports the results of
an automated ontology mapping process, making automated AOP-gene association updates possible in AOP-DB
v.2. AOP-DB v.2 tables are created using MySQL (version 5.7.25) and updated using in-house Perl (version 5.26.3)
and Python (3.6) scripts. Data is downloaded and processed from all third-party sources using R (version 3.6.0)
and Python (3.6). The AOP-DB v.2 data structure, as described in Fig. 1, illustrates the data integration of the
central AOP-gene data with other third-party sources. Figure 1 also indicates how data are integrated across data
sets, where subroutines are needed, and local files are stored. The AOP-gene table links chemical-gene (CTD8),
biological pathway (ConsensusPathDB9,10, KEGG Pathways11–13, Reactome14), disease-gene (DisGenet v.6.015),
species homology (Homologene16), ToxCast Assay target information17–20, tissue-gene mapping (HumanBase21,
and population Single Nucleotide Polymorphism (SNP) frequency data for functionally relevant AOP gene tar-
gets (Ensembl22,23; GWAS24; GTex25–27; 1KGenomes26,28). The AOP-DB v.2 SQL database schema is included in
Supplemental Fig. 1.
AOP-Wiki XML import, and mapping of molecular identifiers. AOP-DB v.2 has updated the primary
source of AOP information, and now implements the AOP-Wiki 2.0 XML dump, which is updated quarterly. This
dump includes all stressor, event, status, and description data associated with AOP’s from the AOP-Wiki 2.0 in
XML format. We used the XML package (version 3.98-1.2) in conjunction with xPath (version 3.1) notation to
parse the AOP-Wiki 2.0 XML into tabular data for import into the AOP-DB v.2, in order to create a data frame
with essential columns. Once organized into tabular format, this processed XML data is separated into AOP_info,
AOP_gene, AOP_stressor, stressor_info, and event_info tables. Individual subroutines automate and validate the
accuracy of the parsed data at each stage. The AOP_stressor and stressor_info tables, due to somewhat loosely
structured submission structure, require manual processing and mapping of chemical ids to chemicals without
mapping information, discussed below.
To create the link between AOP’s from the AOP-Wiki 2.0 and gene identifiers in the AOP-DB v.2, which are
not supplied in the AOP-Wiki 2.0 XML directly, we map key event information within each AOP containing a
biological object, where a biological object is comprised of three ontological components: Process; Object; and
Action. When the object term contains a protein ontology (PR) value, this value is considered a “molecular iden-
tifier” and is used to map that key event to a corresponding gene identifier (e.g. Entrez, UniProt, etc.).
AOP-Wiki Stressor tables. After the AOP-Wiki XML is parsed, the AOP-DB stressor tables undergo an
additional processing step. The AOP-Wiki XML contains stressor_name, user_term, stressor_id and Chemical
Abstract Service Identifier (CASRN). Stressors entered into the AOP-Wiki can include a link to chemical stress-
ors, via the DSSTox Substance Identifier (DTXSID), which maps the stressor to substances registered in the
DSSTox database29. The chemical DTXSID, a unique substance identifier, provides a link to the Dashboard using
Scientific Data | (2021) 8:169 | https://doi.org/10.1038/s41597-021-00962-3 3www.nature.com/scientificdata/ www.nature.com/scientificdata
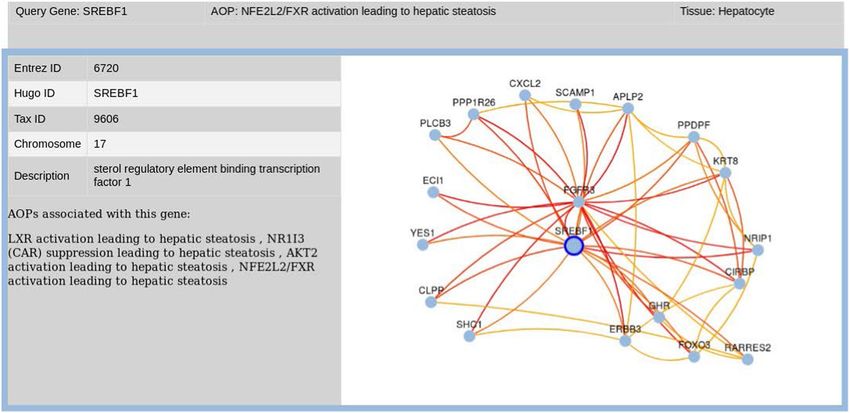
Fig. 2 AOP Tissue Network Visualization Tool illustrates the tissue-gene network built with user query for
SREBF1 for hepatocyte tissue. Associated AOPs for SREBF1 are listed in the left-hand pane.
the process described in Williams et al.30. When no DTXSID is provided for stressors imported from the AOP-DB,
manual curation to the Dashboard has been performed on individual substances, on a substance-by-substance
basis and using available identifiers (e.g. CAS Registry Numbers and chemical names) according to the process
described in Grulke et al.31. A number of issues were addressed in this mapping process for the AOP-DB stressor
mapping; for example, the same chemical with different chemical identifiers, mapping to the same substance
(e.g. Dexamethasone vs Stressor:492 Dexamethasone); spelling errors (e.g. Tacrorimus versus Tacrolimus); gen-
eral naming that prevents specific mapping to a DTXSID, for instance, “various hydrocarbons”, that is in no
way definitive for a particular substance and cannot be mapped to a DTXSID. It should however be noted that
ambiguous substances can map to individual chemical structures, to mixtures or to UVCB chemicals (Unknown
or Variable Composition, Complex Reaction Products and Biological Materials), for example, as discussed in
Williams et al.30. The AOP-DB v.2 stressor linkages are provided through the Dashboard (https://comptox.epa.
gov/dashboard/chemical_lists/AOPSTRESSORS), and map EPA chemical substance records to the most current
list of AOP stressors (last updated 06/30/21).
AOP-DB Tissue-gene networks. The AOP construct organizes biological and related data from molecular
gene targets, both cellular and organ specific, to individual and population levels, so that we can better understand
the progression of initiating events of toxicological concern to their benign or adverse outcomes.
The primary aim of the AOP-DB is to organize publicly available data so that users can understand and char-
acterize the biological context of any given AOP. The AOP-DB v.2 addresses the need to understand tissue specific
events in an AOP-tissue specific context. Here we implement HumanBase21 data, which includes tissue-specific
gene networks for 144 human tissues. By combining genome-wide association studies (GWAS) with
tissue-specific gene networks, it is possible to develop tissue-specific gene-interaction networks with probabilities
representing the strength of the interaction21. Using the HumanBase API (https://hb.flatironinstitute.org/api/),
we import tissue-gene networks for all 144 tissues included in HumanBase and link to each AOP gene. So, for
each AOP gene, 144 individual, tissue-gene networks are added. The number of networks will increase as the
number of AOP genes in the AOP-DB increases. The final tabular form of the tissue-gene data contains edge data
(Entrez1 and Entrez2) representing gene interactions, with individual edge probability scores. Each edge record
has a tissue and query gene field, indicating network relationship.
The AOP-DB v.2 implements the HumanBase tissue-gene networks in the creation of a tissue-gene visualizer
in the AOP-DB web user interface (Fig. 2). This allows users to navigate to AOP relevant genes and tissue-specific
results in a real-time network viewer. The tissue-gene network results can be explored for hypothesis generation
and, for example, to understand how tissue-specific AOP activity relates to known disease states in the AOP-DB.
AOP Haplotypes from 1000 genomes single nucleotide polymorphisms (SNPs). To our knowl-
edge the AOP-DB v.2 is the first tool that incorporates the novel integration of human population level data with
AOP information. AOP-DB v.2 incorporates individual and population level data using data from Ensembl22,23,
ENCODE GWAS24, GTex25–27, and the 1000 Genomes Project28,32, with the goal of identifying functionally impor-
tant AOP-gene variants. The organization of such functional variants for described AOPs makes it possible to
identify potential differences in human susceptibility to adverse outcomes on both an individual and group or
population level. AOP-DB v.2 incorporates population level SNP frequencies for AOP-genes for five of the geo-
graphic super-populations reported by the 1000 Genomes Consortium (European, S. Asian, E. Asian, African,
American32) for the Phase 3 data.
In addition, we identified SNPs as functionally important from the ENCODE GWAS catalog24 and the GTEx
portal25,26 for each AOP-gene. The SNPs were filtered secondarily using the Ensembl Regulatory Build23 to be
Scientific Data | (2021) 8:169 | https://doi.org/10.1038/s41597-021-00962-3 4www.nature.com/scientificdata/ www.nature.com/scientificdata
Fig. 3 Minor allele frequency (MAF) distribution for SNPs associated with 104 functionally relevant Human
AOP-genes for five 1000 Genomes Super populations: American (Blue); African (Yellow); East Asian (Red);
European (Green); South Asian (Black).
Fig. 4 AOP-DB search page illustrating “Basic Search” task bar with accepted user input types and download
file specificity.
located in gene regulatory regions. The resulting SNPs were used to request genotypes using the Ensembl REST
API’s variation endpoint for each SNP for each AOP-gene. With these data we can construct individual AOP-gene
haplotypes. These data are stored in the Haplotype table of AOP-DB v.2. The resulting functional AOP-gene list
for each AOP was then screened using 1000 genomes samples to identify population frequencies of functionally
relevant AOP gene SNPs and AOP haplotypes. Figure 3 illustrates the minor allele frequencies (MAF) observed
for 104 functionally relevant Human AOP-gene SNPs. These multi-allelic, functional AOP-gene haplotypes can
be used for further inquiries to determine levels of variation and significant differences in outcome across pop-
ulation groups.
AOP-DB web-based user interface. The EPA AOP-DB user interface is delivered via a graphical web
user interface (coded in Java and React), an application programming interface (API; coded in node.js) and a
relational database (MySQL and MariaDB). The AOP-DB web user interface, publicly available at https://aopdb.
epa.gov/, has been developed with the goal of providing both data accessibility and data visualization according
to the FAIR Principles33 2019b. Basic search functionality of the AOP-DB web user interface allows users who prefer
to interact with the web user interface to easily navigate, organize and download AOP and related data to their
desktop.
Basic functionality includes a search interface (Fig. 4), batch query tool, and downloads page. The AOP-DB
system has been modified for EPA standard visualization as well as integration with current Office of Science
and Information Management (OSIM) security protocols for EPA internet hosting. At present, data updates to
the AOP-DB occur approximately every 6 months. Initial AOP-DB data visualization has been optimized and
Scientific Data | (2021) 8:169 | https://doi.org/10.1038/s41597-021-00962-3 5www.nature.com/scientificdata/ www.nature.com/scientificdata
Fig. 5 AOP-DB Semantic Mapping using the Resource Description Framework (RDF) illustrating Chemical-
Gene Interaction, Protein-Protein Interaction, ToxCast Assay, and Pathway tables.
includes the following queries: AOP-gene, AOP-disease, AOP-pathway, and AOP-chemical. Search box function-
ality has also been extended to include autofill processing for inputs. Download capabilities have been extended to
include user column select and scroll features, including data download in .csv and .xml, or other useful formats.
The ‘Documents’ page links to the AOP-DB v.2 User Manual, which describes all current search functionality
enabled for the user interface in detail, and includes sections on maintenance of new records and updates, how
content is selected, query tips, and frequently asked questions.
Research description framework mapping of the AOP-DB data tables. Semantic mapping using
a Research Description Framework (RDF)34 was performed for four AOP-DB tables35 as part of an ongoing,
international collaboration between the US EPA, OpenRiskNet (https://openrisknet.org/) and researchers at
the Department of Bioinformatics – BiGCaT, Maastricht University (http://www.bigcat.unimaas.nl/). Figure 5
illustrates the AOP-DB RDF tables for Chemical-Gene Interaction, Protein-Protein Interaction, ToxCast Assay,
and Pathway, and each table’s secondary (and tertiary) keys. A link to the AOP-DB SPARQL endpoint and the
workflows generated using these mappings is provided by the OpenRiskNet e-infrastructure (https://openrisknet.
org/e-infrastructure/services/147/).
Data Records
Online-only Table 1 describes all the individual data source integrated in the AOP-DB. Data sources are organ-
ized according to their biological category, with a short description of the data, along with any manipulations
performed, and the URL. The AOP-DB v.2 data frame with all corresponding table data and custom code has been
uploaded to a single collection entitled “The Adverse Outcome Pathway Database (AOP-DB) version 2.0”36. The
files contained in this collection include the most recent SQL data structure for the AOP-DB v.2, all custom code,
tables, and corresponding data categories and keys to create the backend of the database.
Scientific Data | (2021) 8:169 | https://doi.org/10.1038/s41597-021-00962-3 6www.nature.com/scientificdata/ www.nature.com/scientificdata
Technical Validation
The main quality objective for AOP-DB is ensuring that data included in the data set accurately reflects the data
obtained from the raw data source. Data sets considered for curation in the AOP-DB are limited to publicly
available, peer-reviewed datasets that have been subjected to rigorous quality control and peer review in their
own right. Quality assurance measures to validate the data have focused on ensuring that data records were tran-
scribed accurately from the original data source and represented appropriately in the repository. As a research
product of the United States Environmental Protection Agency Office of Research and Development (ORD), the
AOP-DB has a Quality Assurance Project Plan (QAPP) which describes each individual data source integrated
in the database, how it is implemented, stored and modified. QAPPs describe the necessary quality assurance
and quality control measures needed to produce results that meet stated performance criteria. ORD QAPPs are
peer-reviewed, approved by management, overseen by a quality assurance manager, and subject to periodic QA
and performance quality checks. Figure 1 illustrates, for each data source, each step in obtaining the data from the
third-party source, any subroutine that has been created to modify the data, and including any stored local files.
In all cases, custom scripts were written to identify and correct any errors in the process of migrating data from
source formats into the MySQL database (e.g. duplicated entries).
With public deployment of the AOP-DB v.2, data updates occur approximately every 6 months. Additional,
periodic updates will be made to the production version of the database when substantial changes have been
made requiring a version update. Changes to the development version of the database will be ongoing and as new,
and relevant data become available.
Usage Notes
Though data included in AOP-DB v.2 can be used in many ways in future analyses, users should be aware of
limitations of the data set, and appropriate usage of the data. The AOP-DB v.2 incorporates only those AOPs that
have molecular identifiers. Many AOPs found in the AOP-Wiki 2.0 do not associate with gene or protein molec-
ular identifiers. This may be due to the nature of the biology described or the state of the science for a particular
research area. Users should also be aware that AOP data obtained from the AOP-DB v.2 may be under various
levels of review (e.g. Status or SAAOP Status “Do not cite”, or “Included in OECD Workplan”, for example) or
the AOP may simply be incomplete. This is due to how AOPs are entered into the AOP-Wiki 2.0 at this time.
Additionally, because an AOP may be developed with reference to a particular species, the AOP-DB v.2 reports
the gene/protein accession for that species and maps to orthologous gene pairs in humans or other species ort-
hologs when possible, without indication of relevance.
Code availability
All custom code created to process of manipulate external datasets in the construction or subsequent update
of the AOP-DB v.2 relational database tables are made publicly available by the U.S. Environmental Protection
Agency, Office of Research and Development (ORD)36.
Received: 8 October 2020; Accepted: 13 May 2021;
Published: xx xx xxxx
References
1. US Public Law 114–182. Frank R. Lautenberg Chemical Safety for the 21st Century Act (ed 114th Congress, 2016).
2. Pittman, M. E., Edwards, S. W., Ives, C. & Mortensen, H. M. AOP-DB: A database resource for the exploration of Adverse Outcome
Pathways through integrated association networks. Toxicol Appl Pharmacol 343, 71–83, https://doi.org/10.1016/j.taap.2018.02.006
(2018).
3. Mortensen, H. M. et al. Leveraging human genetic and adverse outcome pathway (AOP) data to inform susceptibility in human
health risk assessment. Mamm Genome 29, 190–204, https://doi.org/10.1007/s00335-018-9738-7 (2018).
4. Patlewicz, G., Worth, A. P. & Ball, N. Validation of Computational Methods. Adv Exp Med Biol 856, 165–187, https://doi.
org/10.1007/978-3-319-33826-2_6 (2016).
5. Delrue, N. et al. The adverse outcome pathway concept: A basis for developing regulatory decision-making tools. Altern Lab Anim
44, 417–429, https://doi.org/10.1177/026119291604400504 (2016).
6. Sakuratani, Y., Horie, M. & Leinala, E. Integrated Approaches to Testing and Assessment: OECD Activities on the Development and
Use of Adverse Outcome Pathways and Case Studies. Basic Clin Pharmacol Toxicol 123(Suppl 5), 20–28, https://doi.org/10.1111/
bcpt.12955 (2018).
7. Ives, C., Campia, I., Wang, R. L., Wittwehr, C. & Edwards, S. Creating a Structured AOP Knowledgebase via Ontology-Based
Annotations. Appl In Vitro Toxicol 3, 298–311, https://doi.org/10.1089/aivt.2017.0017 (2017).
8. Davis, A. P. et al. The Comparative Toxicogenomics Database: update 2017. Nucleic Acids Res 45, D972–D978, https://doi.
org/10.1093/nar/gkw838 (2017).
9. Kamburov, A., Wierling, C., Lehrach, H. & Herwig, R. ConsensusPathDB–a database for integrating human functional interaction
networks. Nucleic Acids Res 37, D623–628, https://doi.org/10.1093/nar/gkn698 (2009).
10. Kamburov, A. et al. ConsensusPathDB: toward a more complete picture of cell biology. Nucleic Acids Res 39, D712–717, https://doi.
org/10.1093/nar/gkq1156 (2011).
11. Kanehisa, M., Sato, Y., Furumichi, M., Morishima, K. & Tanabe, M. New approach for understanding genome variations in KEGG.
Nucleic Acids Res 47, D590–D595, https://doi.org/10.1093/nar/gky962 (2019).
12. Kanehisa, M. Toward understanding the origin and evolution of cellular organisms. Protein Sci 28, 1947–1951, https://doi.
org/10.1002/pro.3715 (2019).
13. Kanehisa, M. & Sato, Y. KEGG Mapper for inferring cellular functions from protein sequences. Protein Sci 29, 28–35, https://doi.
org/10.1002/pro.3711 (2020).
14. Jassal, B. et al. The reactome pathway knowledgebase. Nucleic Acids Res 48, D498–D503, https://doi.org/10.1093/nar/gkz1031
(2020).
15. Pinero, J. et al. DisGeNET: a comprehensive platform integrating information on human disease-associated genes and variants.
Nucleic Acids Res 45, D833–D839, https://doi.org/10.1093/nar/gkw943 (2017).
16. Geer, L. Y. et al. The NCBI BioSystems database. Nucleic Acids Res 38, D492–496, https://doi.org/10.1093/nar/gkp858 (2010).
Scientific Data | (2021) 8:169 | https://doi.org/10.1038/s41597-021-00962-3 7www.nature.com/scientificdata/ www.nature.com/scientificdata
17. US EPA. ToxCast Assay Target mappings from invitroDBv3.2 database. https://www.epa.gov/chemical-research/toxicity-forecaster-
toxcasttm-data (2017).
18. Dix, D. J. et al. The ToxCast program for prioritizing toxicity testing of environmental chemicals. Toxicol Sci 95, 5–12, https://doi.
org/10.1093/toxsci/kfl103 (2007).
19. Judson, R. S. et al. In vitro screening of environmental chemicals for targeted testing prioritization: the ToxCast project. Environ
Health Perspect 118, 485–492, https://doi.org/10.1289/ehp.0901392 (2010).
20. Kavlock, R. et al. Update on EPA’s ToxCast program: providing high throughput decision support tools for chemical risk
management. Chem Res Toxicol 25, 1287–1302, https://doi.org/10.1021/tx3000939 (2012).
21. Greene, C. S. et al. Understanding multicellular function and disease with human tissue-specific networks. Nat Genet 47, 569–576,
https://doi.org/10.1038/ng.3259 (2015).
22. Hunt, S. E. et al. Ensembl variation resources. Database (Oxford) 2018 https://doi.org/10.1093/database/bay119 (2018).
23. Zerbino, D. R. et al. Ensembl 2018. Nucleic Acids Res 46, D754–D761, https://doi.org/10.1093/nar/gkx1098 (2018).
24. Buniello, A. et al. The NHGRI-EBI GWAS Catalog of published genome-wide association studies, targeted arrays and summary
statistics 2019. Nucleic Acids Res 47, D1005–D1012, https://doi.org/10.1093/nar/gky1120 (2019).
25. GTEx Consortium. The Genotype-Tissue Expression (GTEx) project. Nat Genet 45, 580–585, https://doi.org/10.1038/ng.2653
(2013).
26. GTEx Consortium. The Genotype-Tissue Expression (GTEx) pilot analysis: multitissue gene regulation in humans. Science 348,
648–660, https://doi.org/10.1126/science.1262110 (2015).
27. GTEx Consortium. Enhancing GTEx by bridging the gaps between genotype, gene expression, and disease. Nat Genet 49,
1664–1670, https://doi.org/10.1038/ng.3969 (2017).
28. 1000 Genomes Project. An integrated map of genetic variation from 1,092 human genomes. Nature 491, 56–65, https://doi.
org/10.1038/nature11632 (2012).
29. Richard, A. M. & Williams, C. R. Distributed structure-searchable toxicity (DSSTox) public database network: a proposal. Mutat Res
499, 27–52, https://doi.org/10.1016/s0027-5107(01)00289-5 (2002).
30. Williams, A. J. et al. The CompTox Chemistry Dashboard: a community data resource for environmental chemistry. J Cheminform
9, 61, https://doi.org/10.1186/s13321-017-0247-6 (2017).
31. Grulke, C. M., A. J. Williams, Thillanadarajah, I., Richard, A. M. EPA’s DSSTox database: History of development of a curated
chemistry resource supporting computational toxicology research. Computational Toxicology 12 (2019).
32. 1000 Genomes Project. A global reference for human genetic variation. Nature 526, 68–74, https://doi.org/10.1038/nature15393
(2015).
33. Wilkinson, M. D. et al. Evaluating FAIR maturity through a scalable, automated, community-governed framework. Sci Data 6, 174,
https://doi.org/10.1038/s41597-019-0184-5 (2019).
34. RDF Working Group. https://www.w3.org/RDF/ (2014).
35. Mortensen, H. M.; Levey, T.A.; Martens, M.; Evelo, C.T; Willighagen, E. L. Enhancing the EPA Adverse Outcome Pathway Database
(AOP-DB): Recent Updates and Sematic Integration Toxicological Sciences 174 (2020).
36. Mortensen, H. M. et al. The EPA Adverse Outcome Pathway Database version 2.0 (AOP-DB_v2). U.S. EPA Office of Research and
Development (ORD) https://doi.org/10.23719/1522396 (2021).
Acknowledgements
This research contributes to the following FY20–22 research areas of the EPA National Program in Chemical
Safety and Sustainability (CSS): Informatics, Synthesis, and Integration (ISI), O-CSS-19, 19.1: Adverse outcome
pathway networks; O-CSS 21, 21.3: Computational modeling approaches and case study validation to identify
genetic-based susceptibility factors to environmental chemical exposures, 21.7: Quantitative AOP network
development for human liver cancer; O-CSS 23.1: Approaches for aligning chemical inventories with AOPs /
AOP-based chemical grouping. This research was supported in part by the Research Participation Program at
the Office of Research and Development, US Environmental Protection Agency, administered by the Oak Ridge
Institute for Science and Education through an interagency agreement between US Department of Energy and
US Environmental Protection Agency. This research was additionally funded through a competitive grant for
contract support through the Environmental Modeling and Visualization Laboratory. Special thanks to Heidi
Paulsen, Tommy Cathey and Tom Transue for their contribution to this effort. Semantic mapping efforts were
supported by the European Union funded OpenRiskNet Project. Special thanks to Drs. Marvin Martens, Egon
Willighagen, Chris Evelo, and Thomas Exner for their contribution to AOP-DB sematic mapping and training of
T.L. The information in this document has been funded wholly or in part by the US Environmental Protection
Agency. It does not signify that the contents necessarily reflect the views of the Agency, nor does mention of trade
names or commercial products constitute endorsement or recommendation for use. The paper has been subjected
to the Agency’s review process and approved for publication. EPA Disclaimer: This manuscript has been reviewed
by the Center for Public Health and Environmental Assessment, United States Environmental Protection Agency
and approved for publication. Approval does not signify that the contents necessarily reflect the views and
policies of the Agency nor does mention of trade names or commercial products constitute endorsement or
recommendation for use.
Author contributions
H.M.M. conceived the project, conceptualized the integration of the existing data sets into the AOP-DB, drafted
and edited the manuscript, and led integration of the AOP-DB data with AOP-DB user interface development,
OpenRiskNet and the EPA CompTox Chemicals Dashboard. J.S. wrote and maintained scripts to download
and extract raw data, maintained underlying MySQL database, improved RDF mapping of AOP-DB tables, and
generated tables and figures. T.L. wrote and maintained scripts to download and extract raw data, maintained
underlying MySQL database, curated chemicals, and performed the initial RDF mapping of AOP-DB tables. P.L.
wrote initial node.js and react code and queries to develop AOP-DB user interface. A.J.W. leads development of
the EPA CompTox Chemicals Dashboard and DSSTox registration process for stressor associated chemicals from
the AOP-DB.
Competing interests
The authors declare no competing interests.
Scientific Data | (2021) 8:169 | https://doi.org/10.1038/s41597-021-00962-3 8www.nature.com/scientificdata/ www.nature.com/scientificdata
Additional information
Supplementary information The online version contains supplementary material available at https://doi.
org/10.1038/s41597-021-00962-3.
Correspondence and requests for materials should be addressed to H.M.M.
Reprints and permissions information is available at www.nature.com/reprints.
Publisher’s note Springer Nature remains neutral with regard to jurisdictional claims in published maps and
institutional affiliations.
Open Access This article is licensed under a Creative Commons Attribution 4.0 International
License, which permits use, sharing, adaptation, distribution and reproduction in any medium or
format, as long as you give appropriate credit to the original author(s) and the source, provide a link to the Cre-
ative Commons license, and indicate if changes were made. The images or other third party material in this
article are included in the article’s Creative Commons license, unless indicated otherwise in a credit line to the
material. If material is not included in the article’s Creative Commons license and your intended use is not per-
mitted by statutory regulation or exceeds the permitted use, you will need to obtain permission directly from the
copyright holder. To view a copy of this license, visit http://creativecommons.org/licenses/by/4.0/.
The Creative Commons Public Domain Dedication waiver http://creativecommons.org/publicdomain/zero/1.0/
applies to the metadata files associated with this article.
This is a U.S. Government work and not under copyright protection in the US; foreign copyright protection may
apply 2021
Scientific Data | (2021) 8:169 | https://doi.org/10.1038/s41597-021-00962-3 9You can also read