The African ape-like foot of Ardipithecus ramidus and its implications for the origin of bipedalism - eLife
←
→
Page content transcription
If your browser does not render page correctly, please read the page content below
RESEARCH ARTICLE

                                      The African ape-like foot of Ardipithecus
                                      ramidus and its implications for the origin
                                      of bipedalism
                                      Thomas Cody Prang1,2*
                                      1
                                       Department of Anthropology, Center for the Study of Human Origins (CSHO),
                                      New York University, New York, United states; 2New York Consortium in
                                      Evolutionary Primatology (NYCEP), New York, United States

                                      Abstract The ancestral condition from which humans evolved is critical for understanding the
                                      adaptive origin of bipedal locomotion. The 4.4 million-year-old hominin partial skeleton attributed
                                      to Ardipithecus ramidus preserves a foot that purportedly shares morphometric affinities with
                                      monkeys, but this interpretation remains controversial. Here I show that the foot of Ar. ramidus is
                                      most similar to living chimpanzee and gorilla species among a large sample of anthropoid primates.
                                      The foot morphology of Ar. ramidus suggests that the evolutionary precursor of hominin
                                      bipedalism was African ape-like terrestrial quadrupedalism and climbing. The elongation of the
                                      midfoot and phalangeal reduction in Ar. ramidus relative to the African apes is consistent with
                                      hypotheses of increased propulsive capabilities associated with an early form of bipedalism. This
                                      study provides evidence that the modern human foot was derived from an ancestral form adapted
                                      to terrestrial plantigrade quadrupedalism.
                                      DOI: https://doi.org/10.7554/eLife.44433.001

                                      Introduction
                                      Terrestrial bipedalism is widely regarded as a shared-derived characteristic of the hominin clade and
*For correspondence:
cody.prang@nyu.edu                    understanding its evolution is one of the central foci of biological anthropology (Darwin, 1871; Was-
                                      burn, 1967; Fleagle et al., 1981; Richmond et al., 2001; Gebo, 1996; Begun, 2004;
Competing interests: The author
                                      Lovejoy et al., 2009a; White et al., 2015). There are numerous adaptive explanations for the origin
declares that no competing
                                      of bipedalism (Darwin, 1871; Hewes, 1961; Lovejoy, 1981; Rose, 1991; Washburn, 1960;
interests exist.
                                      Hunt, 1996) that are inherently difficult to test directly (Smith and Wood, 2017), but each of them
Funding: See page 13
                                      depends on alternative hypothetical models for the morphology and locomotor behavior of the
Received: 15 December 2018            human-chimpanzee last common ancestor (LCA; Richmond et al., 2001). Hypotheses for the loco-
Accepted: 25 March 2019               motor behavior of the LCA include vertical climbing (Stern, 1975; Prost, 1980; Fleagle et al.,
Published: 30 April 2019              1981), terrestrial knuckle-walking (Wasburn, 1967; Gebo, 1992; Gebo, 1996; Pilbeam, 1996;
Reviewing editor: Min Zhu,            Richmond and Strait, 2000; Richmond et al., 2001; Begun, 2004; Inouye and Shea, 2004), below-
Chinese Academy of Sciences,          branch suspension (Keith, 1923; Tuttle, 1969; Young et al., 2015), arboreal bipedality
China                                 (Thorpe et al., 2007), and more generalized quadrupedalism with slow, deliberate climbing
   Copyright Prang. This article is   (Lovejoy et al., 2009a; White et al., 2009; White et al., 2015). These behavioral hypotheses make
distributed under the terms of        different assumptions about whether the LCA was adapted to arboreality or terrestriality (Was-
the Creative Commons                  burn, 1967; Gebo, 1996; Gebo, 1992; Schmitt, 2003; Crompton et al., 2010). No matter the spe-
Attribution License, which            cific elements of the proposed behavioral hypothesis for the Homo-Pan LCA, hominin bipedalism is
permits unrestricted use and
                                      either the result of an initial evolutionary shift towards terrestriality from an arboreal ancestor
redistribution provided that the
original author and source are        (Schmitt, 2003; Lovejoy et al., 2009a; Lovejoy et al., 2009b; Lovejoy et al., 2009c; White et al.,
credited.                             2009; Crompton et al., 2010; White et al., 2015) or, alternatively, a secondary shift from a semi-

Prang. eLife 2019;8:e44433. DOI: https://doi.org/10.7554/eLife.44433                                                                1 of 17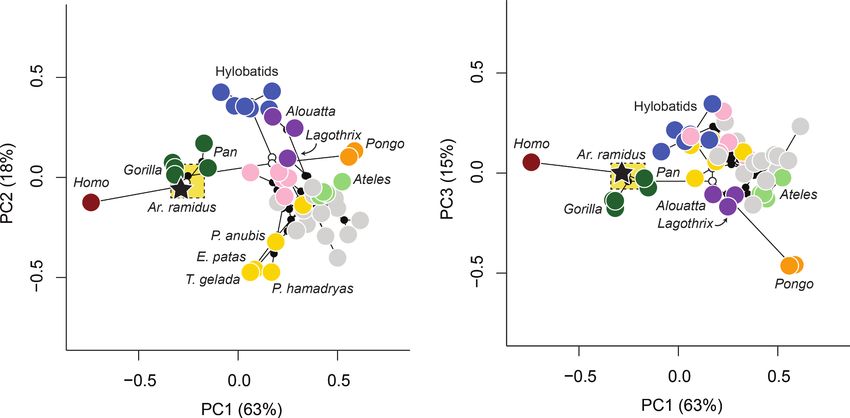
Research article                                                                                  Ecology Evolutionary Biology

                                   eLife digest Walking on two legs is considered to be one of the first steps towards becoming
                                   human. While some animals are also able to walk on two legs, such as kangaroos, birds, and some
                                   rodents, the way they move is nevertheless quite distinct to the way humans walk.
                                       How animals evolve traits is influenced by the characteristics of their ancestors. But what exactly
                                   was the common ancestor of humans and chimpanzees like? Most primates are suited for a life in
                                   the trees. But some also have skeletal characteristics associated with living on the ground. For
                                   example, the feet of chimpanzees and gorillas show adaptations that suit life on the ground, such as
                                   walking on the sole of the foot with a heel first foot posture. So far, it was unclear whether the
                                   ancestor of humans and chimpanzees was primarily adapted to living on the ground or in the trees.
                                       To investigate this further, Prang studied the oldest-known fossil foot (4.4 million years)
                                   attributed to the hominin Ardipithecus ramidus. This involved using evolutionary models to evaluate
                                   the relationship between foot bone proportions and the locomotory behaviour of monkeys and
                                   apes. The results revealed that humans evolved from an ancestor that had a foot similar to living
                                   chimpanzees and gorillas. The African ape foot is uniquely suited to life on the ground, including
                                   shorter toe bones, but also shows some adaptations to life in the trees, such as an elongated,
                                   grasping big toe. Therefore, the locomotion of our common ancestor probably bore a strong
                                   resemblance to these two ape species. Moreover, if the last common ancestor already had ground-
                                   living characteristics, the first step of the evolution of human bipedalism did not involve descending
                                   from the trees to the ground, as our ancestors had already achieved this milestone in some form and
                                   frequency.
                                       This is an important discovery. If this ancestor already had adaptations for life on the ground, why
                                   did only humans evolve to walk upright despite the retention of climbing capabilities in the earliest
                                   human relatives? A next step could be to investigate what selective pressures favored upright
                                   walking in a partly ground-living African ape. This may provide us with more insight into our own
                                   evolutionary story as well as the ways in which living primates evolve adaptations in an ecological
                                   context.
                                   DOI: https://doi.org/10.7554/eLife.44433.002

                                   terrestrial quadrupedal ancestor (Figure 1; Wasburn, 1967; Gebo, 1992; Gebo, 1996; Pil-
                                   beam, 1996; Richmond and Strait, 2000; Richmond et al., 2001; Inouye and Shea, 2004).
                                       The partial skeleton of the early hominin Ardipithecus ramidus purportedly lacks postcranial spe-
                                   cializations associated with hominoid-like orthogrady, vertical climbing, and suspension
                                   (Lovejoy et al., 2009a; Lovejoy et al., 2009b; Lovejoy et al., 2009c; White et al., 2009;
                                   White et al., 2015), which challenges conventional understandings of ape and human ancestry (Dar-
                                   win, 1871; Keith, 1923; Morton, 1922; Wasburn, 1967; Gebo, 1992; Gebo, 1996; Wil-
                                   liams, 2012). In particular, the foot of Ar. ramidus was argued to possess monkey-like midfoot
                                   stabilizing and propulsive morphologies that were inferred to be primitive for great apes
                                   (Lovejoy et al., 2009a). Lovejoy and colleagues (Lovejoy et al., 2009a; White et al., 2015) sug-
                                   gested that the Ar. ramidus foot was consistent with ‘above branch plantigrady’ and a form of loco-
                                   motion termed ‘arboreal multigrady’ (White et al., 2015). The African apes are viewed as ‘adaptive
                                   cul-de-sacs’ (Lovejoy et al., 2009b: pg. 104) that independently evolved adaptations for vertical
                                   climbing given the purported lack of ‘the peculiar substrate-conforming, hand-like grasping foot of
                                   living African apes’ (White et al., 2015: pg. 4883) in Ar. ramidus and in White and colleagues’ recon-
                                   struction of the Homo-Pan LCA. This interpretation of the Ar. ramidus foot is consistent with hominin
                                   bipedalism emerging from a more generalized, exclusively arboreal, quadrupedal ancestor
                                   (Straus, 1949; Schmitt, 2003; Lovejoy et al., 2009a; Lovejoy et al., 2009b; Crompton et al.,
                                   2010).
                                       Foot proportions (e.g., tarsal, metatarsal, and phalangeal lengths) are hypothesized to reflect var-
                                   iation in locomotor behavior among anthropoid primates (Midlo, 1934; Schultz, 1963a;
                                   Schultz, 1963b; Jolly, 1967; Strasser, 1992; Strasser, 1994). Furthermore, the modern human foot
                                   has been highly modified in response to the biomechanical constraints of terrestrial bipedalism (Mor-
                                   ton, 1922; Gebo, 1992; Harcourt-Smith and Aiello, 2004). Foot proportions may therefore provide

Prang. eLife 2019;8:e44433. DOI: https://doi.org/10.7554/eLife.44433                                                                2 of 17
Research article Ecology Evolutionary Biology
Figure 1. Alternative evolutionary scenarios for the origin of hominin bipedalism. Black = terrestrial bipedalism, green = terrestrial quadrupedalism,
blue = arboreal quadrupedalism. (A) Bipedalism is principally a terrestrial adaptation derived from a more exclusively arboreal ancestor, which is
consistent with the original interpretation of the Ar. ramidus foot. (B) Alternative scenario in which bipedalism originates from an ancestor with
terrestrial quadrupedal adaptations, which would be predicted based on the comparative anatomy of living apes and humans. Here, whether a taxon is
considered arboreal or terrestrial is based on their reported frequency of arboreality in the wild.
DOI: https://doi.org/10.7554/eLife.44433.003
insight into long-standing debates about alternative models for the Homo-Pan LCA (Keith, 1923;
Wasburn, 1967; Stern, 1975; Prost, 1980; Fleagle et al., 1981; Gebo, 1992; Gebo, 1996;
Richmond et al., 2001; Schmitt, 2003; Lovejoy et al., 2009b; Crompton et al., 2010; White et al.,
2015). The locomotor behavior of the earliest hominins significantly alters inferences about the
paleobiology of the Homo-Pan LCA and our understanding of how bipedalism evolved. This study
utilizes recent methodological advances to (1) test alternative hypotheses about the relationship
between foot proportions and locomotor behavior among extant anthropoid primates, (2) character-
ize the morphometric affinities of the Ar. ramidus foot (ARA-VP-6/500) on the basis of foot propor-
tions, and (3) estimate the foot proportions of the Homo-Pan LCA. Specifically, this study uses a
combination of evolutionary modeling (Hansen, 1997; Butler and King, 2004; Ingram and Mahler,
2013) and ancestral state estimation (Elliot and Mooers, 2014) methods to make inferences about
the evolutionary history of foot proportions in the anthropoid clade and its implications for the adap-
tive origin of hominin bipedal locomotion.
Results
Morphometric affinities
The morphometric affinities of the Ar. ramidus foot were evaluated by constructing a morphospace
based on six geometric mean-standardized variables that are preserved in the ARA-VP-6/500 foot
skeleton using Principal Components Analysis (PCA, Figure 2). The first three principal components
account for 96% of the total variance in the sample and clearly separate taxonomic groups along
previously hypothesized axes of morphological variation (Schultz, 1963a; Schultz, 1963b;
Jolly, 1967; Strasser, 1992; Strasser, 1994). The first principal component accounts for 63% of the
variance and is positively loaded by the lengths of the fifth metatarsal and fourth proximal phalanx.
The second principal component accounts for 18% of the variance and is positively loaded by the
lengths of the first metatarsal and fourth proximal phalanx, and negatively loaded by the length of
Prang. eLife 2019;8:e44433. DOI: https://doi.org/10.7554/eLife.44433 3 of 17Research article Ecology Evolutionary Biology
Figure 2. Principal Components Analysis (PCA) on six geometric mean-standardized variables. (A) The first two principal components representing 82%
of the variance. (B) The first and third principal components representing 76% of the variance. Star = Ar. ramidus, Grey = Homo, green = Gorilla,
purple = Pan, orange = Pongo, blue = Hylobates, red = Old World monkeys, light green = New World monkeys. Note the placement of Ar. ramidus
with the African apes.
DOI: https://doi.org/10.7554/eLife.44433.004
The following figure supplements are available for figure 2:
Figure supplement 1. UPGMA dendrogram on Euclidean distances in anthropoid primates and Ardipithecus ramidus.
DOI: https://doi.org/10.7554/eLife.44433.005
Figure supplement 2. Univariate comparisons of Ar. ramidus foot proportions to extant anthropoids.
DOI: https://doi.org/10.7554/eLife.44433.006
the fifth metatarsal. The third principal component, which represents 15% of the variance, is posi-
tively loaded by the length of the first metatarsal (Table 1).
The distribution of anthropoid taxa in the PCA is consistent with predictions based on locomotor
behavior. For example, the more terrestrial taxa fall at the negative end (Homo, Pan, Gorilla, Thero-
pithecus, Papio, and Erythrocebus) with shorter metatarsals and phalanges, whereas the most arbo-
real, suspensory, taxa fall at the positive end of PC1 (e.g., Pongo and Ateles). The terrestrial taxa are
Table 1. Principal Components Analysis (PCA).
PC1 PC2 PC3
Eigenvalue 0.17 0.05 0.04
Percent variance 64.6 17.8 14.1
MT1 length 0.01 0.34 0.91
MT5 length 0.64 0.67 0.30
PP4 length 0.68 0.63 0.18
Talar trochlea length 0.29 0.04 0.06
Talar neck length 0.08 0.07 0.21
Cuboid length 0.19 0.17 0.06
DOI: https://doi.org/10.7554/eLife.44433.007
Prang. eLife 2019;8:e44433. DOI: https://doi.org/10.7554/eLife.44433 4 of 17Research article Ecology Evolutionary Biology
sort into those that are heel-strike plantigrade (Homo, Pan, and Gorilla) and those that are digiti-
grade (Theropithecus, Papio, Erythrocebus). Hylobatids, atelids, and Pongo are distinguished from
other arboreal taxa along the same axis that separates terrestrial heel-strike plantigrade taxa from
terrestrial digitigrade taxa. A UPGMA cluster analysis (cophenetic correlation coefficient = 0.82)
shows that of the 44 extant taxa presented here Ar. ramidus is most similar to Pan and Gorilla (Fig-
ure 2—figure supplement 1). Univariate comparisons show that Ar. ramidus possesses a cuboid
that is only slightly elongated relative to African apes (Figure 2—figure supplement 2A), a relatively
short fourth proximal phalanx (Figure 2—figure supplement 2B), and an intrinsically elongated first
metatarsal like African apes and atelids (Figure 2—figure supplement 2C).
The scaling of various tarsals, metatarsals, and phalanges with body mass was investigated using
phylogenetic generalized least squares regression (pGLS) to account for the statistical non-indepen-
dence of the data due to phylogenetic relationships. The parameters for each of the pGLS models
include the intercepts and slopes of the variables regressed on log body mass, their standard error
(s.e.), T, and the p-value (Supplementary file 1). All variables scale with slight negative allometry in
that larger species tend to have relatively shorter metatarsals, phalanges, and tarsals. The only
exception is the length of the talar trochlea, which scales isometrically with body mass. Pagel’s
lambda (l) is a parameter commonly estimated in pGLS regression analyses as a measure of phylo-
genetic signal that can be used to transform the branches of the phylogenetic tree to improve model
fit (Pagel, 1999; Revell, 2010). A l value of 1 would be consistent with expectations under a Brow-
nian motion evolutionary model. The tarsal measurements show departure from Brownian motion
(l = 0.574 or less), whereas the higher l values of the metatarsal and phalangeal variables are con-
sistent with a Brownian motion model. Several of the l values are not significantly different from
either 0 or 1, which suggests the true l for these models is uncertain. The PC scores used in the evo-
lutionary analyses are not correlated with body mass (pGLS p = 0.08 or higher), which suggests that
body mass is not responsible for driving the differences in intrinsic foot proportions among anthro-
poid groups.
Evolutionary modeling
The adaptive implications of an African ape-like morphology in Ar. ramidus (Figure 2) were evalu-
ated using evolutionary modeling. The input data include the first three principal components from
the PCA described above. This approach was chosen to reduce the dimensionality of the dataset for
evolutionary modeling and ancestral state estimation. Alternative a priori evolutionary hypotheses
were constructed and include a Brownian motion, single-optimum Ornstein-Uhlenbeck (OU), and
several multi-optima OU models (Butler and King, 2004) (Figure 3—figure supplement 1). Alterna-
tive multi-optima OU models were constructed using different selective regimes associated with
locomotion in extant taxa. The evolutionary models differ in increasing complexity where each model
includes additional phenotypic optima in a hierarchical manner. Model comparisons using multiple
criteria (AIC, AICc, SIC) show that the multi-optima OU models are a better fit to the data than a
Brownian or single-optimum OU model (Supplementary file 2), which suggests there are multiple
adaptive peaks associated with foot proportions among anthropoid primates. An additional evolu-
tionary model was constructed without identifying selective regimes a priori and resulted in a similar
pattern of selective regimes compared to the best fitting a priori hypothesis (Figure 3). The evolu-
tionary hypothesis with the most favorable AICc value is the most complex and includes selective
regimes associated with bipedalism, terrestrial plantigrady, terrestrial semiplantigrady, arboreal
quadrupedalism, arboreal quadrupedalism with increased frequency of hindlimb-assisted suspen-
sion, and arboreal quadrupedalism with increased frequency of climbing. Simulations show that
there is adequate power to distinguish between alternative models and provides support for the a
priori model selection results obtained using AICc (Figure 3—figure supplements 1–2).
LCA reconstructions
A molecular consensus phylogeny with branch lengths proportional to elapsed time was superim-
posed on the multivariate data and ancestral values were estimated using a Markov chain Monte
Carlo (MCMC) method. This approach relaxes assumptions of neutrality and gradualism and there-
fore minimizes the effect of exceptional lineage divergences on the estimation of ancestral values.
The estimated value for the Homo-Pan LCA is nearest to the African apes and highly distinct from all
Prang. eLife 2019;8:e44433. DOI: https://doi.org/10.7554/eLife.44433 5 of 17Research article Ecology Evolutionary Biology
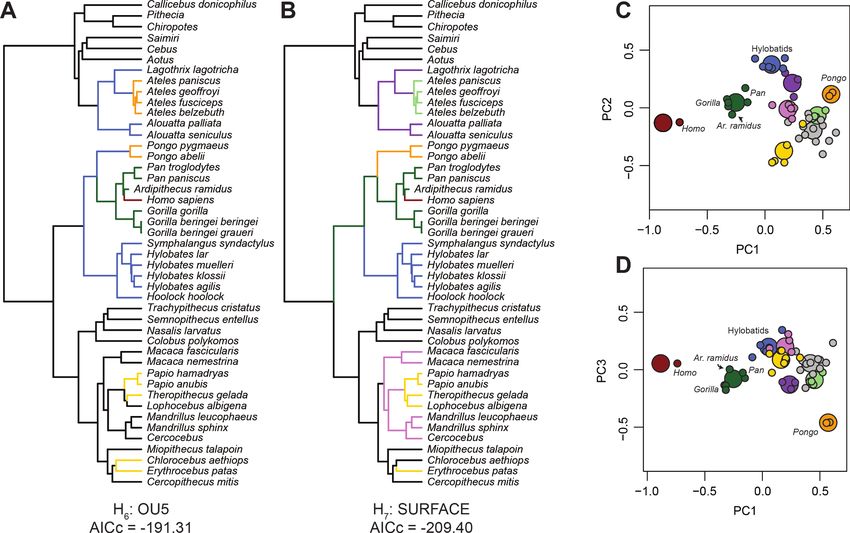
Figure 3. Evolutionary modeling. Best fitting evolutionary models. (A) Best fitting a priori evolutionary hypothesis according to OUCH. (B) Arrangement
of selective regimes fit by SURFACE. (C) The first two principal components with phenotypic optima estimated by SURFACE. (D) The first and third
principal components with phenotypic optima estimated by SURFACE. Note the tight fit of species means (small dots) around their optima (large dots)
as well as the placement of Ar. ramidus near the African ape phenotypic optimum. The colors in C and D correspond to the selective regimes painted
onto the phylogeny in B.
DOI: https://doi.org/10.7554/eLife.44433.008
The following figure supplements are available for figure 3:
Figure supplement 1. Alternative evolutionary hypotheses represented by painting branches of the phylogeny according to selective regimes.
DOI: https://doi.org/10.7554/eLife.44433.009
Figure supplement 2. Simulation results for a priori evolutionary model comparisons.
DOI: https://doi.org/10.7554/eLife.44433.010
other taxa (Figure 4). The 95% credibility intervals for the PC scores of the node representing the
Homo-Pan LCA are relatively narrow and include the mean values for Pan paniscus and Gorilla
gorilla. The estimated ancestral values for both hominids and hominoids are nearest to Alouatta and
Lagothrix, which is consistent with prior suggestions based on the comparative morphology of the
foot in extant and fossil taxa (Gebo, 1996; Sarmiento, 1983; Langdon, 1985; Harrison, 1986).
Discussion
The multivariate evolutionary modeling analyses presented here confirms that among anthropoid
primates intrinsic foot proportions are linked to locomotor behavior (Midlo, 1934; Schultz, 1963a;
Schultz, 1963b; Jolly, 1967; Strasser, 1992; Strasser, 1994). The combination of evolutionary
modeling with ancestral estimations provides evidence for homoplasy in the evolution of anthropoid
foot proportions, which strengthens hypotheses about the link between morphology and behavior.
For example, Erythrocebus probably evolved a terrestrially adapted, digitigrade foot characterized
Prang. eLife 2019;8:e44433. DOI: https://doi.org/10.7554/eLife.44433 6 of 17Research article Ecology Evolutionary Biology
Figure 4. Phylomorphospace. Phylomorphospace plots describing the evolution of the anthropoid foot. Internal nodes are represented by black dots
with exception for the nodes corresponding to the ancestral values for hominins, hominids, and hominoids which are white. The stitched gold box
refers to the 95% credibility intervals for the Homo-Pan ancestral state. Note the placement of Ar. ramidus with the African apes as well as the
separation of taxa according to known differences in locomotion (e.g., more terrestrial taxa are represented by lower values of PC1 whereas more
arboreal taxa are represented by higher values of PC1, taxa that engage in active climbing are represented by higher values of PC2). The estimated
ancestral morphology for hominins is African ape-like and for both hominids and hominoids it is nearest to Alouatta and Lagothrix.
DOI: https://doi.org/10.7554/eLife.44433.011
by short phalanges, a short hallux, and long non-hallucal metatarsals independently of Theropithecus
and Papio. These terrestrial monkeys also tend to have a longer midfoot, which increases the pedal
load arm and enhances propulsive capabilities. Although most anthropoids sampled here are highly
arboreal, the foot of Alouatta, Lagothrix, and hylobatids converge on similar foot proportions associ-
ated with arboreal climbing (though the upper limb of hylobatids is highly autapomorphic), such as a
long hallux, relatively shorter metatarsals, and longer phalanges derived from a more generalized
anthropoid ancestral condition. The more suspensory anthropoids Ateles and Pongo may have inde-
pendently evolved towards the part of the morphospace associated with pedal elongation.
African apes and Ar. ramidus occupy a distinct phenotypic optimum characterized by short pha-
langes, short metatarsals, moderately elongated tarsals, and a long hallux. Although the more ter-
restrial hominines (Homo, Ardipithecus, Pan, Gorilla) and cercopithecines (Papio, Theropithecus,
Erythrocebus) probably evolved short phalanges in parallel (Figures 1 and 2), the hominines retain
an intrinsically elongated hallux and short non-hallucal metatarsals while the terrestrial cercopithe-
cines display the opposite configuration (Schultz, 1963a; Schultz, 1963b). The difference in foot
proportions between terrestrially adapted apes and monkeys are similar to the differences between
plantigrade and digitigrade carnivorans (Taylor, 1976). The long metatarsals of digitigrade quadru-
peds increase the range of plantarflexion at the talocrural joint at the expense of decreasing the
effective mechanical advantage of the ankle plantar-flexors (Biewener, 1989). African apes and Ar.
ramidus are separated from terrestrial monkeys along the same axis that distinguishes generalized
arboreal anthropoids (e.g., Cercopithecus) from hallux-elongated taxa associated with behaviors var-
iously described as ‘climbing’ (Hylobatids, Alouatta, Lagothrix). The unique combination of these
traits in the hominine foot supports the hypothesis that such feet are adapted to both terrestrial
heel-strike plantigrade (rather than digitigrade) quadrupedalism and vertical climbing, which is
Prang. eLife 2019;8:e44433. DOI: https://doi.org/10.7554/eLife.44433 7 of 17Research article Ecology Evolutionary Biology
consistent with previous suggestions based on comparative anatomy and behavioral observations
(Fleagle et al., 1981; Gebo, 1996; Prost, 1980; Gebo, 1992; DeSilva, 2009; Prang, 2015). If Ar.
ramidus and the Homo-Pan LCA were adapted to more generalized quadrupedalism and climbing
as originally suggested (Lovejoy et al., 2009a; White et al., 2009) or ‘arboreal multigrady’ as later
revised (White et al., 2015); see also Fernández et al., 2018), then the Ar. ramidus foot skeleton
should not have been placed in the same selective regime as the African apes (Figure 3).
The ancestral estimations provide support for the hypothesis that modern humans evolved from
an ancestor with African ape-like foot proportions. Modern humans have the longest cuboids of any
of the anthropoid primates sampled here (Figure 2), which reflects a biomechanical strategy for
lengthening the foot’s load arm to enhance aspects of propulsion (i.e., range of motion) while simul-
taneously restricting metatarsal length to minimize bending moments associated with plantigrady
(Lovejoy et al., 2009a). Although the cuboid elongation of Ar. ramidus from the estimated LCA is
more modest than previously reported (Lovejoy et al., 2009a), it is more parsimoniously interpreted
to be derived in the direction of modern humans from an African ape-like ancestor with a short mid-
foot, rather than an ancestral retention from a more monkey-like great ape ancestor (Lovejoy et al.,
2009a; Lovejoy et al., 2009b; White et al., 2015; McNutt et al., 2018). Midfoot elongation is con-
sistent with the functional hypothesis of increased propulsive capabilities associated with the form of
bipedalism practiced by Ar. ramidus (Lovejoy et al., 2009a; White et al., 2015; Suwa et al., 2009;
Kimbel et al., 2014; Kozma et al., 2018; Fernández et al., 2018). These analyses show that the ori-
gin of bipedalism cannot be explained as an initial shift toward terrestriality from a more exclusively
arboreal ancestor (Figure 3). Instead, early hominins, including Ar. ramidus, evolved from an ances-
tor with an African ape-like foot adapted to terrestrial plantigrade quadrupedalism (Morton, 1922;
Wasburn, 1967; Gebo, 1992; Gebo, 1996).
Evidence for terrestrial plantigrade quadrupedalism in the Homo-Pan LCA raises the question of
whether or not purported knuckle-walking traits in hominines might be homologies
(Richmond et al., 2001; Gebo, 1996; Begun, 2004; Inouye and Shea, 2004) rather than homopla-
sies (Dainton and Macho, 1999; Dainton, 2001; White et al., 2015; Lovejoy et al., 2009b;
Kivell and Schmitt, 2009). The knuckle-walking hand posture of African apes is hypothesized to be
a secondary adaptation to terrestriality in taxa that retain long hands in association with below-
branch forelimb suspension (Tuttle, 1969). However, there is no special relationship between planti-
grade foot postures and knuckle-walking hand postures (e.g., plantigrade non-primate mammals do
not have a knuckle-walking hand posture). Whether or not modern humans evolved from a knuckle-
walking ancestor relies on the analysis of the hand and wrist (Tuttle, 1969; Gebo, 1996; Dain-
ton, 2001; Begun, 2004; Inouye and Shea, 2004; Dainton and Macho, 1999; Kivell and Schmitt,
2009; Almécija et al., 2015). The hand of Ar. ramidus was argued not to display traits associated
with forelimb suspension in extant taxa or show evidence of a knuckle-walking ancestry
(White et al., 2015; Lovejoy et al., 2009b; Almécija et al., 2015), but many of those observations
have not yet been independently validated. The terrestrial specializations of the hominine foot are
likely to be homologous because they are present in Ar. ramidus and they are consistent with
model-based ancestral estimations. Critically, they carry a similar set of implications for the origin of
bipedalism regardless of the terrestrial hand posture of the Homo-Pan LCA.
This study provides evidence that modern humans evolved from an ancestor with an African ape-
like foot associated with terrestrial plantigrady and vertical climbing. Hominin upright walking there-
fore likely emerged in the context of semi-terrestrial quadrupedalism. Explaining the adaptive origin
of hominin bipedalism (i.e., ‘why’ bipedalism evolved) will continue to be a challenging endeavor
(Smith and Wood, 2017). However, the comparative and fossil material provides evidence for pat-
terns of evolution (i.e., ‘how’ bipedalism evolved) and strongly suggests that hypotheses of a non-
African ape-like morphology for the foot of the Homo-Pan LCA (Lovejoy et al., 2009a; White et al.,
2015; Lovejoy et al., 2009b) are inconsistent with the results from this study. The Ar. ramidus ARA-
VP-6/500 partial skeleton is remarkable for its preservation of multiple areas of anatomy
(Lovejoy et al., 2009a; White et al., 2009; White et al., 2015). This study provides evidence that
intrinsic foot proportions reflect locomotor diversity among anthropoid primates, but it will be
important to consider other regions in future comparative studies. The hypothesis that hominins
evolved from a semi-terrestrial quadrupedal ancestor could be tested with detailed quantitative
analyses of other aspects of Ar. ramidus postcranial morphology.
Prang. eLife 2019;8:e44433. DOI: https://doi.org/10.7554/eLife.44433 8 of 17Research article Ecology Evolutionary Biology
Materials and methods
Extant and fossil sample
The extant sample is composed 385 individuals representing 45 taxa: Homo sapiens, Ardipithecus
ramidus, Pan troglodytes, Pan paniscus, Gorilla beringei beringei, Gorilla beringei graueri, Gorilla
gorilla, Pongo pygmaeus, Pongo abelii, Hylobates lar, Hylobates muelleri, Hylobates klossii, Hylo-
bates agilis, Hoolock hoolock, Symphalangus syndactylus, Macaca fascicularis, Macaca nemestrina,
Papio anubis, Papio hamadryas, Theropithecus gelada, Lophocebus albigena, Mandrillus sphinx,
Mandrillus leucophaeus, Cercocebus spp., Erythrocebus patas, Chlorocebus aethiops, Cercopithecus
mitis, Miopithecus talapoin, Nasalis larvatus, Colobus polykomos, Trachypithecus cristatus, Semnopi-
thecus entellus, Ateles geoffroyi, Ateles fusciceps, Ateles paniscus, Ateles belzebuth, Alouatta pal-
liata, Alouatta seniculus, Lagothrix lagotricha, Cebus spp., Saimiri spp., Aotus spp., Pithecia spp.,
Chiropotes spp., and Callicebus donicophilus. These specimens are housed at the following collec-
tions: American Museum of Natural History (AMNH), Cleveland Museum of Natural History (CMNH),
Harvard Museum of Comparative Zoology (MCZ), United States National Museum of National His-
tory, Smithsonian Institution (USNM), Field Museum (FM), Berkeley Museum of Vertebrate Zoology
(MVZ), Human Evolution Research Center (HERC) at the University of California, Berkeley, and the
Royal Museum for Central Africa (RMCA). The modern human sample is composed of recent modern
individuals of European and African ancestry housed at the Hamann-Todd Collection at the CMNH
as well as a Native American population from California housed at the Phoebe A. Hearst Museum of
Anthropology (PAHMA) at the University of California, Berkeley. Measurements of Ardipithecus ram-
idus (ARA-VP-6/500) were initially taken on casts at the University of California, Berkeley. Observa-
tions were then made on the original fossils at the National Museum of Ethiopia (NME) and
measurements confirmed by T. White.
Data acquisition
Six measurements were taken on the foot of each individual using Mitutoyo digital calipers: maxi-
mum talar articular length, talar trochlea length, cuboid length, first metatarsal (MT1) length, fifth
metatarsal length (MT5), and fourth proximal phalanx (PP4) length. Talar neck length was derived by
subtracting the talar trochlea length from maximum talar articular length. Maximum talar articular
length is defined as the maximum proximodistal distance between the most proximal margin of the
talar trochlea and the most distal point on the talar head. Talar trochlea length is defined as the
maximum proximodistal distance between the most proximal margin of the talar trochlea and the
most distal point of the talar trochlea. Cuboid length is defined as the proximodistal distance
between the dorsal margin of the calcaneal facet and the most distal point of the tarsometatarsal
joint, taken in dorsal view in approximate anatomical orientation. The purpose of measuring cuboid
length in this manner is to explicitly avoid the cuboid beak or calcaneal process since it varies exten-
sively among great apes (Lewis, 1983) and because it confounds the cuboid length measurement as
a representation of midfoot length since it is articular and housed within a corresponding concavity
on the cuboid facet of the calcaneus. MT1 length is defined as the maximum proximodistal distance
between the most proximal points on the metatarsal base (with calipers held flush) and the most dis-
tal point of the metatarsal head. MT5 length is defined as the proximodistal distance between the
most proximal point of the cuboid-MT4 articular margin and the most distal point on the metatarsal
head. PP4 length is defined as maximum proximodistal distance between the most proximal point of
the phalangeal base and the most distal point of the trochlea. The MT5 was chosen to represent
non-hallucal metatarsal length because it is preserved in the ARA-VP-6/500 foot. The fossil is missing
most of its metatarsal head and its length was estimated by Lovejoy et al. (2009a) using a combina-
tion of anatomical and statistical estimation. There is a nearly complete third metatarsal of Ar. rami-
dus, but it derives from a different locality and is therefore associated with a different individual.
There is a partially preserved second metatarsal of Ar. ramidus also from a different individual
(Lovejoy et al., 2009a). Therefore, for this study, the metrics are based on the preserved elements
of the ARA-VP-6/500 foot of Ar. ramidus.
The individual elements of the bony foot skeleton contribute to the production of three move-
ments used in various forms of primate locomotor behavior that are hypothesized to be reflected in
intrinsic foot proportions: hallucal adduction and flexion, non-hallucal digital flexion, and
Prang. eLife 2019;8:e44433. DOI: https://doi.org/10.7554/eLife.44433 9 of 17Research article Ecology Evolutionary Biology
plantarflexion at the talocrural joint. Increasing the length of the first metatarsal should increase the
moment arm of the intrinsic adductor musculature such as the m. adductor hallucis across a range of
hallucal abduction angles, and therefore should increase the hallucal adduction force during grasp-
ing in non-human primates (Cartmill, 1979). Increasing hallucal metatarsal and non-hallucal phalan-
geal lengths also contributes to increasing the span of the pedal grasp in taxa with a mobile hallux,
which also helps to maintain a friction grip in pedal grasping (Cartmill, 1979). Previous studies have
modeled the foot skeleton as a second-class lever, where the fulcrum is at the metatarsophalangeal
joints, the load passes through the talocrural joint at the rearfoot, and the force is produced by the
plantarflexor muscles. The load arm is the distance between the fulcrum and the load, whereas the
effort arm (or ‘power arm’) is the distance between the insertion of the ankle plantarflexors on the
calcaneal tuberosity and the talocrural joint (Schultz, 1963a; Schultz, 1963b; Strasser, 1992).
Increasing the effort arm of the foot relative to the load arm increases the mechanical advantage of
the foot skeleton as a lever (Schultz, 1963a; Schultz, 1963b; Strasser, 1992). However, increasing
the load arm increases the range of motion for a given amount of plantarflexor contraction
(Schultz, 1963a; Schultz, 1963b). The length of the effort arm of the Ar. ramidus foot is unknown
because its calcaneus is not well preserved (Lovejoy et al., 2009a). There are multiple anatomical
strategies for increasing the length of the foot skeleton’s load arm. The length of the load arm can
be increased by lengthening the metatarsals, tarsals (e.g., the talus and/or cuboid), or any combina-
tion of these elements. Increasing the length of the metatarsals subjects them to greater bending
moments during stance phase, and therefore increases the possibility of injury, so humans achieve a
longer load arm by instead increasing the length of the tarsals. As such, in a bipedal heel-strike plan-
tigrade foot, the load arm is increased by lengthening the cuboid and other midtarsal elements. In
contrast, in quadrupedal semiplantigrade or digitigrade primates, and indeed other terrestrial curso-
rial mammals (Taylor, 1976), the load arm is lengthened by increasing the length of the metatarsals.
One implication of these differing anatomical arrangements (e.g., increasing metatarsal versus tarsal
lengths), is that foot proportions may also be a correlate of foot postures (plantigrady and digiti-
grady or semiplantigrady), which is one of the hypotheses tested by this study using evolutionary
modeling.
Statistical analysis
To correct for differences in scale among species, each measurement was divided by the geometric
mean of all six measurements per individual (Jungers et al., 1995). Morphometric affinities were
evaluated using an unweighted pair-group with arithmetic mean (UPGMA) cluster analysis on Euclid-
ean distances. The cophenetic correlation coefficient was used to assess the degree to which the
resulting dendrogram represented the true pairwise distances between taxa (Sokal and Rohlf,
1962). Principal Components Analysis (PCA) on all six geometric mean-standardized variables was
used to reduce, ordinate, and visualize the multivariate data. All evolutionary modeling and ancestral
state estimation analyses use the first three principal components (PCs) derived from the PCA. The
PC scores were used instead of the original data to avoid analytical problems surrounding correla-
tions among variables (Clavel et al., 2015) and to maximize statistical power (Boettiger et al.,
2012). Ardipithecus ramidus was added to a molecular phylogenetic tree from 10 k trees
(Arnold et al., 2010) as a stem hominin (Strait and Grine, 2004; White et al., 2009; Dembo et al.,
2015) with a branch length of 1.4 million years in accordance with first and last appearance data for
the genus (5.8–4.4 Ma (Haile-Selassie, 2001; WoldeGabriel et al., 2001)) using Mesquite software
(Maddison and Maddison, 2017). The branch length for Homo sapiens was reduced in order to
improve estimation of phenotypic optima in evolutionary analyses (Butler and King, 2004;
Ingram and Mahler, 2013). The scaling of individual foot elements with body mass among extant
taxa (Smith and Jungers, 1997) was conducted using phylogenetic generalized least squares regres-
sion (Grafen, 1989) with the ‘caper’ package (Orme, 2013) in R (R Core Team, 2017). To increase
the fit of the evolutionary model to the data, branch lengths were transformed using Pagel’s lambda
(Pagel, 1999), which was estimated with maximum likelihood as a measure of phylogenetic signal in
the residual error of each pGLS model (Revell, 2010).
A phylomorphospace was constructed by superimposing the phylogenetic tree on the average
principal component (PC) scores for each taxon and ancestral values were estimated using a Markov
chain Monte Carlo method (MCMC) that relaxes assumptions of neutrality and gradualism
(Elliot and Mooers, 2014). Ancestral values estimated under constant rate Brownian motion are
Prang. eLife 2019;8:e44433. DOI: https://doi.org/10.7554/eLife.44433 10 of 17Research article Ecology Evolutionary Biology
affected by taxa that are exceptionally phenotypically derived compared to their close relatives
because it is assumed that all branches have evolved at the same rate (Elliot and Mooers, 2014).
The assumption of a constant evolutionary rate therefore results in an ‘averaging effect’ of ancestral
values (Schluter et al., 1997; Elliot and Mooers, 2014). Therefore, estimates of ancestral values for
continuous traits that assume a constant evolutionary rate are potentially biased in the direction of
more derived branches characterized by higher phenotypic evolutionary rates. Since this study is
focused on estimating ancestral values for humans, great apes, and hominoids, the stable model
(Elliot and Mooers, 2014) was specifically chosen in light of evidence for molecular and morphologi-
cal evolutionary rate differences in hominoids relative to other anthropoids (Steiper et al., 2004)
and in Homo relative to Pan (Weaver and Stringer, 2015).
Ancestral states (PC scores) were estimated under a constant rate Brownian motion model and a
stable model using StableTraits software version 1.5 (Elliot and Mooers, 2014). Two independent
Markov chains were run with 2,000,000 iterations at a thinning rate of 200, resulting in 10,000 sam-
ples each. Priors on evolutionary rate were set to the default settings as implemented in StableTraits
and which prevent rates from approaching zero. The two chains converged after 500,000 iterations
as evidenced by a proportional scale reduction factor (PSRF) value approaching 1 (Brooks and Gel-
man, 1998). Therefore, the first 600,000 iterations for each of the two chains were discarded as burn
in. The stable model returns a list of median ancestral values for internal nodes along with their 95%
credibility interval (Elliot and Mooers, 2014). The constant rate Brownian motion model was com-
pared to the stable model using the Bayesian predictive information criterion (BPIC), which is analo-
gous to Akaike’s Information Criterion (AIC) in a Maximum Likelihood framework (Ando and Tsay,
2010). A vector of median ancestral values of the PC scores was supplied for internal nodes and a
phylomorphospace was constructed given the topology of the molecular phylogenetic tree using the
‘phytools’ package (Revell, 2012) in R (R Core Team, 2017).
A model-based approach was used to evaluate alternative evolutionary hypotheses: Brownian
motion, single-optimum Ornstein-Uhlenbeck (OU), and multi-optimum OU. Prior to evolutionary
model comparison, a multivariate extension (Adams, 2014) of Blomberg’s K statistic
(Blomberg et al., 2003) was computed to estimate the phylogenetic signal in the first three principal
components using the ‘geomorph’ package (Adams et al., 2017) in R (R Core Team, 2017). The
Brownian motion model, which is commonly used in phylogenetic comparative analyses, is defined
by the stochastic differential equation (SDE): dX(t) = sdB(t) where X is the trait value, t is time, dB(t)
is random white noise, and s is the magnitude of random fluctuations in the evolutionary process.
Under Brownian motion all trait changes are independent of previous ones, as well as those on other
branches, and trait variance is proportional to time (i.e., branch lengths). Alternatively, the OU pro-
cess was quantitatively formalized by Hansen (1997) to model stabilizing selection as the stochastic
differential equation (SDE): dX(t) = a(q – X(t))dt + sdB(t) where q is the trait optimum and a is the
strength of the ‘restraining force’ acting on a trait around an optimum. Brownian motion is therefore
a special case of OU when a = 0.
Hansen (1997) views phenotypic optima (q) as peaks in an adaptive landscape, which are a com-
promise among the many possibly conflicting selective demands acting on a trait at any given time.
Multi-optima Hansen models reflect adaptive hypotheses based on observations of extant primate
posture and locomotion culled from the literature and quantitatively formalized as alternative
arrangements of hypothetical phenotypic optima (q) following the methodology of Butler and King
(2004). Species means represent local optima surrounding a global optimum (q) which correspond
to a selective regime (Hansen, 1997). As such, individual species may differ significantly from one
another while simultaneously occupying the same global phenotypic optimum, possibly due to other
factors such as drift or pleiotropy (Hansen, 1997). Therefore, in evolutionary model comparison, the
focus is on the number and arrangement of global phenotypic optima (q) and their surrounding local
optima (i.e., species means) rather than on individuals within species. Several recent studies have
used modeling methods to test evolutionary hypotheses in paleoanthropology (Almécija et al.,
2015; Grabowski and Jungers, 2017; Fernández et al., 2018).
Evolutionary hypotheses
The evolutionary hypotheses for the link between foot proportions and behavior are informed by
observations of locomotor behavior in the wild reported in the literature. The first evolutionary
hypothesis is a Brownian motion model (H1). The second evolutionary hypothesis is the first Hansen
Prang. eLife 2019;8:e44433. DOI: https://doi.org/10.7554/eLife.44433 11 of 17Research article Ecology Evolutionary Biology
model and it reflects a single global phenotypic optimum (H2). Support for these hypotheses would
suggest that there are no major adaptive differences in foot proportions between anthropoid pri-
mate groups. Subsequent hypotheses represent multi-optima OU models of increasing complexity
(i.e., number of phenotypic optima). The second Hansen model has three selective regimes associ-
ated with advanced bipedalism (Homo), mostly terrestrial quadrupedal locomotion (Pan, Gorilla,
Papio, Theropithecus, Erythrocebus, Chlorocebus aethiops) and mostly arboreal quadrupedal loco-
motion in all other taxa (H3). African apes are competent climbers and possess foot adaptations
related to this form of locomotion (DeSilva, 2009). However, observations from the wild show them
to be highly terrestrial. Papio, Theropithecus, Erythrocebus, and Chlorocebus aethiops are the most
terrestrial among the cercopithecoids. Previous studies suggest there may be effects of arboreality
and terrestriality on foot proportions (Schultz, 1963a; Jolly, 1967).
The third Hansen model is an elaboration of the previous one that splits the terrestrial regime
into two: terrestrial heel-strike plantigrady in Pan, and Gorilla, and terrestrial semiplantigrady in
Papio, Theropithecus, Erythrocebus, and Chlorocebus aethiops (H4). Semiplantigrady is defined as
any habitual foot posture in which some, but not all, tarsals are in contact with the substrate during
stance phase. Heel-strike plantigrady is defined as a foot posture in which the tarsals, principally the
calcaneus and its proximal tuberosity, contact the substrate at the beginning of stance phase. Sev-
eral studies have suggested that African ape tarsal morphology reflects their heel-strike plantigrade
foot posture (Gebo, 1992; Gebo, 1996). Previous work on mammalian foot proportions implies that
foot proportions may reflect foot posture (Taylor, 1976).
The fourth Hansen model separates the arboreal taxa from the previous model into mostly arbo-
real taxa that engage in little climbing and hindlimb-assisted suspension versus mostly arboreal taxa
that engage in climbing and hindlimb-assisted suspension more frequently (i.e., Pongo abelii, Pongo
pygmaeus, Ateles, Alouatta, Lagothrix, H5). Numerous studies have shown that suspensory locomo-
tion is correlated with limb and joint morpology (Fleagle et al., 1981; Gebo, 1996). The majority of
these studies have been focused on the upper limb and shoulder (Fleagle et al., 1981; Gebo, 1996;
Hunt, 1996; Young et al., 2015). The fifth Hansen model further separates mostly arboreal taxa into
those that frequently engage in active climbing (i.e., Hylobates, Symphalangus, Alouatta) from the
more hindlimb-assisted suspensory taxa such as Pongo and Ateles (H6). This model attempts to dis-
tinguish between possible effects of hindlimb-assisted suspension versus active climbing (Sar-
miento, 1983; Langdon, 1985; Harrison, 1986). Standard model selection criteria (AICc) were used
to evaluate alternatives and to choose the model that best fit the data. Alternative adaptive hypoth-
eses were evaluated using the ‘OUCH’ package (Butler and King, 2004) in R (R Core Team, 2017).
An additional method was used to identify phenotypic optima without a priori information using
the SURFACE method, which stands for SURFACE Uses Regime Fitting with Akaike Information Cri-
terion to model Convergent Evolution (Ingram and Mahler, 2013). The purpose of SURFACE is to
estimate the macroevolutionary adaptive landscape (i.e., the number and arrangement of pheno-
typic optima) using only a data set and a phylogeny. SURFACE uses a stepwise AIC algorithm to fit a
series of Hansen models in two phases: a forward phase in which selective regimes are added, and a
backward phase, in which selective regimes are collapsed. The original intent of the SURFACE
method was to test for convergence in a clade while minimizing potential biases in the identification
of hypothetically convergent ecomorphs a priori (Ingram and Mahler, 2013). These analyses were
carried out using the ‘SURFACE’ package (Ingram and Mahler, 2013) in R (R Core Team, 2017).
Comparison of the model identified by SURFACE (H7) with the a priori models was conducted using
the ‘OUCH’ package (Butler and King, 2004) in R (R Core Team, 2017). Therefore, a total of seven
evolutionary hypotheses describing the evolution of the anthropoid foot were tested. Model com-
parison offers a powerful method for testing evolutionary hypotheses, but several researchers have
noted the importance of conducting simulations to evaluate statistical power in model selection
(Boettiger et al., 2012; Cooper et al., 2016).
Simulations were conducted using a Monte Carlo method in order to evaluate statistical power in
model selection closely following the approach outlined in Boettiger and colleagues
(Boettiger et al., 2012). The purpose of this approach is to determine whether alternative evolution-
ary models can be distinguished from one another given the data set and phylogeny, and if so,
which of the models is best (Boettiger et al., 2012; Lst and Ané, 2014). It is therefore an alternative
to other model selection criteria such as Akaike’s Information Criterion (AIC). First, parameters (e.g.,
log-likelihood) were estimated from the data (i.e., the first three principal components) under
Prang. eLife 2019;8:e44433. DOI: https://doi.org/10.7554/eLife.44433 12 of 17Research article Ecology Evolutionary Biology
models A and B (e.g, Brownian motion versus single optimum Ornstein-Uhlenbeck). Second, 1000
data sets were simulated under the estimated parameters for each of the two models. Third, models
A and B were both re-fit to each of the two 1000 simulated data sets, producing four sets of 1000
log-likelihoods. Finally, the likelihood ratio statistic, which is defined as d = 2(logL0 – logL1), where
logL0 is the log-likelihood of model A and logL1 is the log-likelihood of model B, was calculated,
resulting in two distributions of 1000 values for the likelihood ratio statistic under both models. The
difference between the distributions reflects statistical power and the proximity of the empirical like-
lihood ratio statistic to the distributions indicates which of the two models is best. The following sim-
ulations were conducted to compare models of increasing complexity: Brownian motion vs. OU1,
OU2 vs. OU3, OU3 vs. OU4, and OU4 vs. OU5. These simulations were conducted using R (R Core
Team, 2017).
Acknowledgments
I thank Y Assefa, D Abebaw, the Ethiopian Authority for Research and Conservation of Cultural Heri-
tage (ARCCH), T White, G Suwa, O Lovejoy, and B Asfaw for facilitating access to the fossil speci-
mens of Ardipithecus ramidus used in this study. E Westwig (American Museum of Natural History),
D Lunde (United States National Museum of National History), and L Jellema (Cleveland Museum of
Natural History), JChupasko (Harvard Museum of Comparative Zoology), curatorial staff at the Field
Museum, T White (Human Evolution Research Center at the University of California, Berkeley), H
Taboada (Center for the Study of Human Origins), C Conroy (Museum of Vertebrate Zoology at Ber-
keley), W Wendelen and E Gilissen (Royal Museum for Central Africa), M Black and N Johnson
(Pheobe A Hearst Museum of Anthropology at the University of California, Berkeley) provided access
to museum specimens. S Williams, T Harrison, D Gebo, J DeSilva, and B Wood provided comments
that improved this manuscript. C Rolian and two anonymous reviewers provided feedback that
improved this manuscript.
Additional information
Funding
Funder Grant reference number Author
Wenner-Gren Foundation Dissertation Fieldwork Thomas Cody Prang
Grant
The funders had no role in study design, data collection and interpretation, or the
decision to submit the work for publication.
Author contributions
Thomas Cody Prang, Conceptualization, Formal analysis, Funding acquisition, Investigation, Visuali-
zation, Methodology, Writing—original draft
Author ORCIDs
Thomas Cody Prang http://orcid.org/0000-0003-3032-8309
Decision letter and Author response
Decision letter https://doi.org/10.7554/eLife.44433.018
Author response https://doi.org/10.7554/eLife.44433.019
Additional files
Supplementary files
. Supplementary file 1. Phylogenetic generalized least squares (PGLS) regression analysis.
DOI: https://doi.org/10.7554/eLife.44433.012
. Supplementary file 2. Performance of alternative models for the evolution of the anthropoid foot.
Prang. eLife 2019;8:e44433. DOI: https://doi.org/10.7554/eLife.44433 13 of 17Research article Ecology Evolutionary Biology
DOI: https://doi.org/10.7554/eLife.44433.013
. Transparent reporting form
DOI: https://doi.org/10.7554/eLife.44433.014
Data availability
Data and R scripts have been deposited in Dryad Digital Repository (doi:10.5061/dryad.d112p8r)
The following dataset was generated:
Database and
Author(s) Year Dataset title Dataset URL Identifier
Thomas Cody Prang 2018 Data from: The African ape-like foot http://dx.doi.org/10. Dryad Digital
of Ardipithecus ramidus and its 5061/dryad.d112p8r Repository, 10.5061/
implications for the origin of dryad.d112p8r
bipedalism
References
Adams DC. 2014. A generalized K statistic for estimating phylogenetic signal from shape and other high-
dimensional multivariate data. Systematic Biology 63:685–697. DOI: https://doi.org/10.1093/sysbio/syu030,
PMID: 24789073
Adams DC, Collyer ML, Kaliontzopoulou A, Sherratt E. 2017. Geomorph. Software for Geometric Morphometric
Analyses.
Almécija S, Smaers JB, Jungers WL. 2015. The evolution of human and ape hand proportions. Nature
Communications 6:7717. DOI: https://doi.org/10.1038/ncomms8717, PMID: 26171589
Ando T, Tsay R. 2010. Predictive likelihood for bayesian model selection and averaging. International Journal of
Forecasting 26:744–763. DOI: https://doi.org/10.1016/j.ijforecast.2009.08.001
Arnold C, Matthews LJ, Nunn CL. 2010. The 10ktrees website: a new online resource for primate phylogeny.
Evolutionary Anthropology: Issues, News, and Reviews 19:114–118. DOI: https://doi.org/10.1002/evan.20251
Begun DR. 2004. Knuckle-walking and the origin of human bipedalism. In: Meldrum D. J, Hilton C. E (Eds). In:
(Eds). From Biped to Strider: The Emergence of Modern Human Walking, Running, and Resource. New York:
Kluwer Academic/Plenum Publishers.
Biewener AA. 1989. Scaling body support in mammals: limb posture and muscle mechanics. Science 245:45–48.
DOI: https://doi.org/10.1126/science.2740914, PMID: 2740914
Blomberg SP, Garland T, Ives AR. 2003. Testing for phylogenetic signal in comparative data. Evolution 57:717–
745.
Boettiger C, Coop G, Ralph P. 2012. Is your phylogeny informative? measuring the power of comparative
methods. Evolution 66:2240–2251. DOI: https://doi.org/10.1111/j.1558-5646.2011.01574.x
Brooks SP, Gelman A. 1998. General methods for monitoring convergence of iterative simulations. Journal of
Computational and Graphical Statistics 7:434–455.
Butler MA, King AA. 2004. Phylogenetic comparative analysis: a modeling approach for adaptive evolution. The
American Naturalist 164:683–695. DOI: https://doi.org/10.1086/426002, PMID: 29641928
Cartmill M. 1979. The volar skin of primates: its frictional characteristics and their functional significance.
American Journal of Physical Anthropology 50:497–509. DOI: https://doi.org/10.1002/ajpa.1330500402,
PMID: 111555
Clavel J, Escarguel G, Merceron G. 2015. Mv morph : an R package for fitting multivariate evolutionary models
to morphometric data. Methods in Ecology and Evolution 6:1311–1319.
Cooper N, Thomas GH, Venditti C, Meade A, Freckleton RP. 2016. A cautionary note on the use of ornstein
uhlenbeck models in macroevolutionary studies. Biological Journal of the Linnean Society 118:64–77.
DOI: https://doi.org/10.1111/bij.12701, PMID: 27478249
Crompton RH, Sellers WI, Arboreality T. 2010. Terrestriality, and bipedalism. Philosophical Transactions of the
Royal Society of London. Series B, Biological Sciences 365:3301–3314.
Dainton M. 2001. Did our ancestors knuckle-walk? Nature 410:324–325. DOI: https://doi.org/10.1038/35066634
Dainton M, Macho GA. 1999. Did knuckle walking evolve twice? Journal of Human Evolution 36:171–194.
DOI: https://doi.org/10.1006/jhev.1998.0265, PMID: 10068065
Darwin C. 1871. The Descent of Man. Reprinted in Penguin Classics Series 2004.
Dembo M, Matzke NJ, Mooers Arne Ø., Collard M. 2015. Bayesian analysis of a morphological supermatrix
sheds light on controversial fossil hominin relationships. Proceedings of the Royal Society B: Biological Sciences
282:20150943. DOI: https://doi.org/10.1098/rspb.2015.0943
DeSilva JM. 2009. Functional morphology of the ankle and the likelihood of climbing in early hominins. PNAS
106:6567–6572. DOI: https://doi.org/10.1073/pnas.0900270106, PMID: 19365068
Elliot MG, Mooers AØ. 2014. Inferring ancestral states without assuming neutrality or gradualism using a stable
model of continuous character evolution. BMC Evolutionary Biology 14:1–15. DOI: https://doi.org/10.1186/
s12862-014-0226-8, PMID: 25427971
Prang. eLife 2019;8:e44433. DOI: https://doi.org/10.7554/eLife.44433 14 of 17You can also read