The Anticipatory Effects of Medicare Part D on Drug Utilization
←
→
Page content transcription
If your browser does not render page correctly, please read the page content below
The Anticipatory Effects of Medicare Part D on Drug
                                                              ∗
                                         Utilization
                                           Abby Alpert

                                           August 2014

                                              Abstract

       While policies are frequently signed into law well before they are implemented, such
       lags are ignored in most empirical work. This paper demonstrates the importance
       of implementation lags in the context of Medicare Part D, the prescription drug
       benefit that took effect two years after it was signed into law. Exploiting the differ-
       ential responses of chronic and acute drugs to anticipated future prices, I show that
       individuals reduced drug utilization for chronic but not acute drugs in anticipation
       of Part D’s implementation. Accounting for this anticipatory response reduces the
       estimated total treatment effect of the program by about one-half. JEL Codes:
       H51, I13, I18

   ∗
     I am especially grateful to Mark Duggan and Judith Hellerstein for their invaluable advice and
support. I also thank Ana Abras, Paul Bailey, Juan Bonilla-Angel, Tami Calvez, Carolina Gonzalez-
Velosa, Raymond Guiteras, Tamara Hayford, Mireille Jacobson, Ginger Jin, Darius Lakdawalla, Gabriel
Lara-Ibarra, Kenneth Leonard, Willard Manning, David Powell, Jeff Prince, Kosali Simon, and seminar
and conference participants at the University of California-Irvine, University of Chicago, University of
Colorado-Denver, University of Georgia, University of Maryland, Vanderbilt, University of Pittsburgh-
School of Public Health, Conference of the American Society of Health Economists, Midwest Health
Economics Conference, Southern California Conference in Applied Microeconomics, RAND, Mathemat-
ica, U.S. Treasury, and CBO for helpful discussions and suggestions. This work was supported by grant
number R36HS019681 from the Agency for Healthcare Research and Quality. The content does not rep-
resent the views of the Agency for Healthcare Research and Quality. All errors are my own. Address:
University of California at Irvine, Irvine, CA, 92697. Email: aealpert@uci.edu.

                                                   1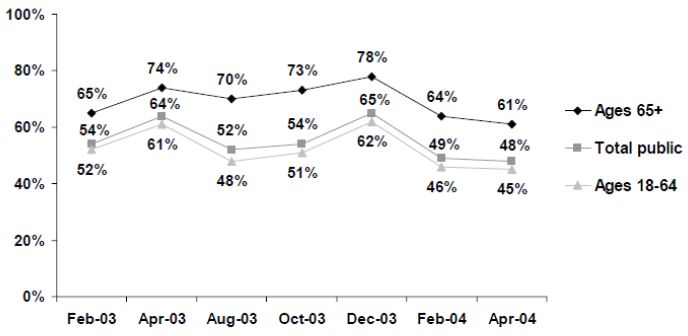
1     Introduction
Many public policies are implemented with a significant lag from their enactment date
including changes to the minimum wage, taxes, Social Security, Medicare, and welfare
benefits.1 In health care, long lags between the announcement and implementation of
policies have been the norm for major recent reforms such as the expansion of prospective
payment for Medicare under the Balanced Budget Act, the introduction of Medicare Part
D, and the Affordable Care Act (ACA), which was signed into law in March 2010, but did
not have its major provisions implemented until 2014. Understanding the consequences
of these “implementation lags” is important from both a policy and program evaluation
perspective. The ACA and other policies that are announced in advance may begin to
affect individual and firm behaviors and outcomes ahead of implementation. Yet many
program evaluations estimate only contemporaneous program effects–pre- and post- pol-
icy implementation–often ignoring the anticipatory effects of policy announcements and
resulting in potentially biased estimated policy impacts.2 Moreover, implementation lags
themselves are policy decisions, but there is little economic evidence on the consequences
of these lags.
      In this paper, I examine anticipation effects in the case of Medicare Part D, which
went into effect two years after it was signed into law. Part D, which added outpatient
prescription drug coverage to Medicare, was the largest single expansion of the Medicare
program since its inception. At a cost of $32 billion in the first year, Part D substantially
reduced the out-of-pocket price of drugs for Medicare beneficiaries. While Part D was im-
plemented in January 2006, it was signed into law in December 2003 as part of the widely
publicized Medicare Prescription Drug, Improvement, and Modernization Act (MMA).
Given this two-year lag between when the program was effectively announced and when
it was implemented, it is possible that forward-looking individuals changed their drug
consumption behavior before Part D took effect in anticipation of future subsidized drug
coverage. The direction of this pre-implementation utilization response is theoretically
ambiguous due to opposing intertemporal substitution and income effects. On the one
    1
      For example, the Fair Minimum Wage Act of 2007 phased-in three minimum wage hikes to take
effect in 2007, 2008, and 2009; the Tax Reform Act of 1986 phased in over two years; the Social Security
Amendments of 1983 increased the normal retirement age by two-months each year starting in 2000.
    2
      There are a few examples in which anticipatory behavior has been shown to lead to biased estimates
of program treatment effects, including the Social Security Amendments of 1983 (Mastrobuoni, 2009) the
Tax Reform Act of 1986 (e.g. Slemrod, 1995; Scholes, Wilson, and Wolfson, 1992), and welfare reform in
the UK (Blundell, Francesconi, and van der Klaauw, 2010).

                                                   2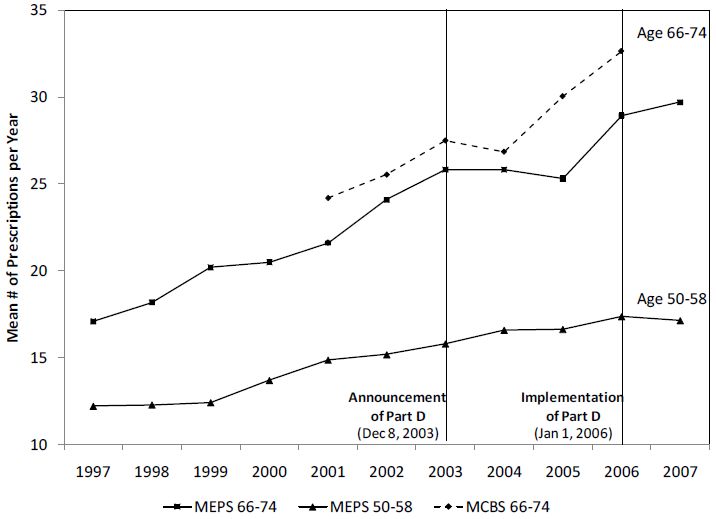
hand, individuals may have strategically deferred new or ongoing medications until after
Part D was implemented, when drugs would be cheaper. On the other hand, since Part
D lowered the cost of long-term therapies and increased lifetime income, individuals may
have begun drug therapies that they would not have otherwise started or initiated them
earlier. As a result, an anticipatory effect could manifest as a dip or a spike in drug
utilization in the period immediately before Part D took effect.
       Prior studies of Part D have implicitly assumed a myopic response to the policy
by comparing outcomes before and after the 2006 implementation date, largely ignoring
the possibility of behavioral responses in the intervening years of 2004 and 2005.3 I find
evidence that previous estimates of the demand response to Part D have been overstated
by not accounting for anticipatory effects during these years. More generally, a large
literature has estimated the price elasticity of demand for prescription drugs by focusing
solely on contemporaneous responses to current price (summarized in Goldman, Joyce,
Zheng, 2007). Yet individuals’ demand for prescription drugs might also respond to future
prices. This paper also contributes to a burgeoning literature on the role of anticipated
future prices on current medical care utilization (e.g. Aron-Dine et al., 2012; Einav et
al., 2013b) by exploiting the advanced announcement of Part D as a new test of forward-
looking behavior for drug demand.
       In contrast to the previous literature, I allow drug utilization to respond not only
to current prices at the time of implementation, but also to expectations of future prices
at the time of the policy announcement. To quantify the anticipation effects of Part D,
I estimate the causal demand response to the announcement of Part D in 2003.4 Using
detailed drug utilization data from the Medicare Current Beneficiary Survey (MCBS)
and the Medical Expenditure Panel Survey (MEPS) that spans the pre-announcement
to post-implementation periods, my empirical strategy exploits the predicted differential
responses of different types of drugs and different types of individuals to anticipated future
price changes driven by Part D.
       In my main approach, I estimate a difference-in-difference model comparing utiliza-
tion of chronic versus acute drugs before and after the announcement of Part D. The
intuition for this approach is that demand for acute drugs (e.g. antibiotics), which treat
illnesses that require immediate treatment, should be relatively insensitive to future prices
   3
     For example, see Lichtenberg and Sun, 2007; Yin et al, 2008; Ketcham and Simon, 2008.
   4
     The lag between the announcement and implementation of policies has also been used in tests of the
“rational addiction” model (Gruber and Koszegi, 2001) and the life-cycle hypothesis (Wilcox, 1989).

                                                  3
since there is little scope for postponing treatment; whereas demand for chronic drugs (e.g.
statins), which treat long duration illnesses and can be more readily deferred to later time
periods, is more likely to be responsive to future prices.5 Finding relative changes in the
utilization of chronic drugs compared to acute drugs after the policy announcement would
provide evidence that individuals are responding to the anticipated future implementation
of and access to Part D. I add complementary evidence using a difference-in-difference
strategy to compare changes in utilization before and after the announcement of Part D
for the elderly ages 65 and over who are currently eligible for Medicare relative to the
near-elderly who are not yet eligible. The near-elderly group is less affected by the im-
pending implementation of Part D, with the caveat that those not yet eligible may also
be responsive to future price changes.
The results of this study demonstrate a substantial decline in overall drug use by
the elderly following the announcement of Part D of approximately 6%. This comes after
several years of consistent upward growth in drug utilization. Then, in the implementation
year, drug utilization reverts upwards to the long-run utilization trend (see Figure 1).
These findings are consistent with a dominating intertemporal substitution effect–that is,
consumers responding to expected future price reductions by shifting the timing of drug
use to future periods. I observe this reduction in utilization after Part D’s announcement
only for chronic drugs and not for acute drugs. However, use of both types of drugs
increases after the implementation of Part D. This is consistent with the main theoretical
predictions that chronic drugs respond to both current and future prices, whereas acute
drugs are only responsive to current price. I also find that these anticipatory effects are
concentrated among the youngest Medicare beneficiaries, for whom the health costs of
delaying treatment are lowest (relative to older beneficiaries); those without employer-
sponsored drug insurance, who were most likely to enroll in Part D; and among those
with below-median incomes, who are the most liquidity constrained. The results for
the age group comparisons also show that the decline in drug utilization following the
announcement is only present for Medicare beneficiaries over 65 and does not occur for
those ages 50-58. I find suggestive evidence that even adults nearing Medicare eligibility
(ages 59-64) have a negative anticipatory response to the announcement of Part D relative
to younger adults.
Finally, I evaluate two alternative supply-side explanations for the observed reduc-
5
This test is similar in spirit to Sorensen (2000), which exploits across-drug variation in the frequency
of prescription fills to estimate the effect of search on price dispersion.
4tion in utilization after the announcement. First, pharmaceutical firms may have begun
to increase drug prices as soon as the law was passed in anticipation of the reduced
price-sensitivity of consumers under Part D, thus generating a contemporaneous negative
demand effect. However, examining price growth trends, I find no empirical support for
this explanation. I also consider the possibility that insurers discontinued drug coverage
or reduced benefit generosity before the implementation of Part D, thus increasing out-
of-pocket costs. While I find a small decline in certain types of drug insurance coverage
after the announcement, I show that this change is likely driven by individuals’ take-up
decisions and can thus be considered a demand-side anticipation effect. Taken together,
the results of this paper demonstrate that drug utilization responds to predictable changes
in future drug prices in an economically meaningful way. My analysis implies that the
total estimated treatment effect on utilization in the first year of the program is reduced
by about one-half when anticipatory effects are taken into account.
This study has important parallels for the ACA, which implemented its key provi-
sions with a lag from when they were announced. As one example, the “Cadillac tax”
on high cost health insurance plans, which takes effect in 2018, may have already led
insurers to lower insurance premiums and firms to switch to lower cost health insurance
plans (Piotrowski, 2013; Abelson, 2013) in anticipation of the future tax. Future studies
of the effects of this tax on premiums, wages and other outcomes will need to account for
such pre-implementation responses, since comparisons of outcomes immediately before
and after 2018 will miss the full impact of this policy. Similarly, anticipatory responses
could have occurred in the run-up to ACA implementation in individuals’ decisions about
whether to purchase insurance and healthcare services, premium and pricing decisions
by insurers and providers, decisions by employers about whether to offer insurance cov-
erage, and decisions by individuals and firms about employment, among others. The
results of this study illustrate the importance of accounting for anticipation effects when
policies are announced in advance of implementation, which has specific implications for
the evaluation of Part D and broader implications for the ACA and many other policies.
By extension, this paper also relates to public programs in which future eligibility can
be anticipated, such as Medicare coverage which can be perfectly anticipated as one ap-
proaches age 65. In that case, some individuals may defer non-urgent medical care until
they receive Medicare coverage (Card et al., 2008).
This paper also contributes to an emerging literature that examines whether individ-
uals are forward-looking in responding to future prices of medical care that are anticipated
5when individuals change their insurance status or plan (Long, et al., 1998; Gross, 2009;
Cabral, 2011; Einav et al., 2013a) or face changing prices throughout the calendar year
due to non-linear insurance contracts (Kowalski, 2010; Aron-Dine, et al., 2012; Einav, et
al., 2013b).6 As noted in Aron-Dine, et al. (2012), these recent studies contrast with a
long standing literature in economics that estimates the price elasticity of medical care
assuming that individuals respond to a single static price. In other contexts, such as
intertemporal labor supply and life-cycle consumption more generally, it is natural to as-
sume that optimizing individuals trade-off present and future consumption based on the
relative prices across periods.7 However, little is known about whether individuals take
future prices into account when determining current drug consumption.
In contrast to the few previous studies of forward-looking behavior in non-drug medi-
cal care, the price change resulting from Part D implementation is exogenous to individual
decisions and health status; the announcement of the policy was widely publicized, re-
ducing the need for strong informational assumptions about the ability of individuals
to forecast future price changes; and drug use is a highly prevalent and high frequency
outcome for the elderly, so there is broad scope for a response. In addition, this paper
provides one of the first explicit tests of forward-looking behavior in drug consumption.
2 Background
2.1 Program Coverage and Participation
Medicare is an over $500 billion federal program that provides health insurance to the
elderly, ages 65 and over, and qualifying non-elderly disabled individuals.8 The traditional
program consists of Part A and Part B, which together cover most medical services includ-
ing physician-administered drugs such as chemotherapy. Outpatient prescription drugs
were not covered by traditional Medicare until the introduction of Part D in 2006.9 After
6
Related to these studies, analysis of the RAND Health Insurance experiment has been criticized for
its assumption of myopia in not accounting for within-year price variation (Kowalski, 2010; Manning, et
al., 1987).
7
See for example MaCurdy (1981) for intertemporal wage elasticities; Friedman (1957), Hall (1978),
and others for intertemporal consumption decisions.
8
The disabled comprise 16% of enrollment (SSA Annual Statistical Supplement, 2008). Individuals
with end-stage renal disease are also covered.
9
Some outpatient prescription drug coverage has been provided through Part C, also known as Medi-
care Advantage (MA). During the study period, only about 12 to 16 percent of Medicare eligibles chose
to enroll in Part C (Brown et al., 2011). Drug coverage under Part C was not very generous. In 2003, 69
6the implementation of Part D, Medicare’s share of total national spending on prescription
drugs increased from 2% in 2005 to 22% in 2006 (KFF, 2007).
Enrollment in Part D is voluntary.10 By January 2007, 54% of Medicare beneficia-
ries had enrolled in Part D (KFF, 2007), over one-third of whom did not have any source
of drug insurance two years earlier (Levy and Weir, 2009). Individuals who were dually
eligible for Medicaid and Medicare were automatically enrolled in Part D and most Medi-
care Advantage (Part C) plans began to offer Part D benefits (L&W, 2009).11 Medicare
beneficiaries who had received drug benefits from employer-sponsored insurance were least
likely to take-up Part D, with only 19 percent enrolling in 2006 (Levy and Weir, 2009).12
Levy and Weir (2009) estimate that the fraction of the elderly who were drug-uninsured
declined from 24% to 7% in the first year of Part D.
2.2 How Did Part D Lower Drug Costs?
Part D is administered by stand-alone private drug plans (PDPs) and Medicare Advantage
plans (MA-PDs) that compete for Medicare enrollees within defined regions of the U.S.
The program lowered the out-of-pocket cost of drugs for enrollees primarily through two
mechanisms.13 The first was through the coinsurance design. All plans must offer a benefit
that is at least actuarially equivalent to a standard benefit defined by Medicare. The
standard benefit provides a drug subsidy that is non-linear in annual expenditures. Plans
typically require an annual premium, which was on average $384 in 2006 (KFF, 2006).
The first $250 of drug expenditures are borne fully out-of-pocket, while the next $2000 are
subsidized by 75 percent. After reaching a spending threshold of $2,250, the beneficiary
enters what is known as the “donut-hole” in which he again bears 100 percent of the costs.
After $5,100 in total drug spending, catastrophic coverage begins and a 95 percent subsidy
percent of Part C enrollees in basic plans received drug coverage with 60 percent of plans covering only
generic drugs (Achman and Gold, 2003).
10
However, the program encourages take-up by raising the base premium incrementally for each month
that enrollment is delayed beyond initial eligibility. This penalty is waived if beneficiaries can demonstrate
access to actuarially equivalent coverage elsewhere.
11
Enrollment in Part D was also high among those who were previously covered by a private Medigap
prescription drug plan since these plans were required to discontinue prescription drug coverage after
Part D was implemented.
12
This low participation rate can likely be attributed to the employer Retiree Drug Subsidy.
13
Part D may have also indirectly lowered out-of-pocket costs for individuals who did not enroll in
Part D if employers increased plan generosity in response to the Retiree Drug Subsidy.
7takes effect for all remaining expenditures for the year.14 Low-income beneficiaries receive
additional subsidies, such as reduced premiums and deductibles, smaller coinsurance, and
subsidized coverage in the “donut hole” region.15 In addition to lowering enrollees’ out-
of-pocket payments mechanically through the coinsurance design, PDPs and MA-PDs
could also lower spending by using their bargaining power to negotiate lower prices from
manufacturers and pharmacies. Duggan and Scott-Morton (2010) show evidence that
this type of strategic behavior has led to a reduction in prices of brand name drugs by
approximately 20% for enrollees who moved from not having drug insurance to Part D.
Together, the coinsurance design and strategic behavior of plan providers have contributed
to a 13 to 22% decline in the share of drug spending paid out-of-pocket by Medicare
beneficiaries following the implementation of Part D (Yin et al 2008; Ketcham and Simon
2008).
2.3 Previous Evaluations of the Part D Utilization Effect
Given the large decline in the out-of-pocket price of drugs after Part D went into effect,
we would expect to see an increase in the demand for prescription drugs. High rates
of drug non-compliance and sub-optimal take-up of medically beneficial therapies among
the elderly prior to Part D (Adams et al, 2001; Mojtabai and Olfson, 2003), combined
with moral hazard effects, suggest that this utilization effect potentially could be large.
In other contexts, a large body of literature has estimated insurance price elasticities of
drug demand ranging from -0.2 to -0.6 (Goldman, Joyce, Zheng, 2007).
Several studies have evaluated the impact of the implementation of Part D on drug
utilization. The three most widely cited studies employ a difference-in-difference strategy
comparing drug use for the elderly ages 65+ and the near-elderly (who are not yet eligible
for Medicare) right before and after the implementation of Part D (Lichtenberg and Sun,
2007; Yin et al, 2008; Ketcham and Simon, 2008). Using large samples of pharmacy
claims, these studies have estimated that drug utilization increased by 4-10% in the first
14
Many plans differ from this standard design, for example, by offering flat copays for different drugs
in the first region rather than 25% coinsurance (KFF, 2006).
15
Before Part D was implemented– between June 2004 and January 2006– Medicare beneficiaries could
enroll for a small fee in a drug discount card that provided discounts at the point-of-sale, with estimated
savings of approximately 17% (Cubanski et al., 2004). However, take-up of the drug discount program
was low. Only 5.8 million Medicare beneficiaries had enrolled in the program six months after it was
introduced, with the vast majority automatically enrolled due to their low income status. Moreover, most
of the automatic enrollees did not activate their discount cards (Thomas, 2005).
8or second year of the program16 with implied elasticities ranging from -0.2 to -0.7.17
One critical limitation of these previous difference-in-difference studies is that they
do not possess a long enough time series of data to account for possible anticipation ef-
fects. In each of these studies, the “pre-period” begins in 2004– nearly one year after the
announcement of Part D. If there were anticipation effects, the baseline period is effec-
tively “treated.” The DID estimator will overstate the program effect if the announcement
of Part D caused Medicare beneficiaries to shift the timing of drug purchases until after
implementation, leading to a transitory pre-implementation decline in utilization. The
near-elderly group is not an adequate control for anticipatory responses by the elderly
because they would not be expected to respond to the announcement with the same in-
tensity as those who are already Medicare-eligible. By not accounting for anticipatory
effects, the DID estimate will falsely attribute the increase in drug use following the
transitory dip to the Part D program effect. This identification problem is structurally
similar to the “Ashenfelter dip” that has been widely discussed in the job training liter-
ature.18 Conversely, if the announcement caused beneficiaries to increase drug use in the
pre-implementation period, the DID estimator will understate the program effect, since
part of the real impact of Part D occurs before the program is implemented. Thus, using
only a small window of data around the implementation date generates biased treatment
effect estimates if there are anticipation effects.
3 Accounting for Anticipatory Responses
3.1 Conceptual Framework
In contrast to the previous studies of Part D, I take a more dynamic view of drug de-
mand. Given that the lag in program implementation allowed individuals to forecast price
changes two years in advance, individuals’ demand for prescription drugs may respond not
only to current prices at the time of implementation, but also to expectations of future
16
These estimates are from the age-standardization that Ketcham and Simon (2008) perform to com-
pare the results of Yin et al. (2008) and Lichtenberg and Sun (2007).
17
Another recent paper uses the MCBS to compare the previously drug-uninsured elderly with those
with drug insurance (Kaestner and Kahn, 2012). Finally, using IMS sales data, Duggan and Scott-Morton
(2010) examine whether drug use increased between 2003 and 2006 differentially for drugs that had a
higher Medicare market share. They find a large utilization effect that is insignificant and statistically
imprecise.
18
See for example Ashenfelter, 1978; Heckman and Smith, 1999
9prices at the time of the policy announcement. Thus, estimates of the total treatment
effect of Part D should combine the effects of both the announcement and implementation.
The notion that future prices can affect present behavior is well-established. This
idea is central to models of dynamic commodity demand and intertemporal labor supply.19
Similarly, the demand for healthcare is part of a life-cycle decision-making process (Gross-
man, 1972).20 For forward-looking individuals, current demand should be a function of
everything that is known about the lifetime path of prices. All else equal, individuals
should allocate greater drug use to periods when drugs are cheaper. The announcement
of Part D in 2003 changed individuals’ expectations about the future path of prices for
drugs. Since this reform represented a permanent change, it lowered the entire stream of
out-of-pocket prices in all future periods beginning on the implementation date. The life-
cycle model predicts that individuals should have immediately used this new information
to re-optimize their consumption path.21
While the life-cycle model suggests that we should observe a change in drug utiliza-
tion following the announcement of Part D, from an empirical standpoint it is difficult to
disentangle aggregate changes in drug utilization caused by anticipatory behavior from
other consumption fluctuations. I propose a test for an anticipatory response (or equiv-
alently, a test for forward-looking life-cycle behavior) that exploits the fact that different
types of drugs–namely, chronic and acute drugs–should respond differentially to antici-
pated future price changes. This will form the basis of a difference-in-difference strategy.
For this analysis, the key difference between acute and chronic drugs is their aver-
age duration of use. Acute drugs (e.g. antibiotics) treat illnesses that are largely unpre-
dictable, short in duration, and require immediate treatment; meanwhile, chronic drugs
treat long-term illnesses. Put differently, acute drugs typically produce a health benefit
in the current period, while chronic drugs can produce health benefits in many periods.
Since there isn’t much scope for shifting acute drug use to future periods, anticipated
future prices should have little impact on current use. Thus, the announcement of Part D
19
These models begin with Lucas and Rapping (1970) and Friedman’s “permanent income hypothesis”
(1957). The large literature that has followed for labor supply is surveyed in Card (1991).
20
Lucarelli (2006) develops a dynamic model of drug demand in the spirit of Grossman (1972) to
simulate the demand response to the implementation of Part D. However, like other Part D studies, he
does not account for possible anticipatory demand responses.
21
Since Part D changed the lifetime price path of drugs for individuals of all ages, it is possible that the
announcement affected consumption for even those not yet eligible for Medicare. Though, the short-run
effects are likely strongest for Medicare beneficiaries and individuals closest to eligibility.
10should have a much larger effect for chronic drugs than for acute drugs.22 Moreover, this
effect for chronic drugs could be either negative or positive due to opposing intertemporal
substitution and income effects.
First, the announcement could induce intertemporal substitution: individuals delay
the use of some drugs until after the program is implemented, when the out-of-pocket
price is lower. For example, individuals may have asked their physicians to delay the
initiation of chronic treatments for which they were newly eligible or reduced their adher-
ence to “less-essential” medications that they believed could be suspended temporarily
without posing an immediate health risk. It should be emphasized that in order for the
intertemporal substitution effect to generate a pre-reform decline in utilization relative to
the counterfactual trend, it must be the case that elderly who would have otherwise taken
a drug or initiated a new treatment in the absence of Part D decided to postpone treat-
ment after learning of the announcement. One concern is that, for drugs that are taken
for an entire lifetime, this response would not fit a standard model of rational behavior.23
Nevertheless, most drugs are used for a finite period of time, at least in expectation,
because they fail to be effective with some probability, better drugs enter the market,
or their usefulness is eventually outlived. Thus, given the uncertainty of treatment du-
ration, it may be optimal to defer use or experiment with new treatments of unknown
effectiveness in periods when the price of drugs is lower.24
Second, there will be a positive anticipatory response to Part D if income effects
dominate. Part D increased lifetime income by lowering the cost of drugs in each period.
Since this income effect is distributed across the life-cycle, it could increase drug use
(and other consumption) in any period after the announcement. Thus, individuals could
begin drug therapies that they would not have otherwise started or initiate them earlier.
Importantly, the magnitude of the income effect varies with the size of the expected benefit
22
Within chronic drugs, some drugs are more “deferrable” than others depending on the severity of the
illnesses they treat or the symptoms experienced in the absence of treatment. While the main test in this
paper exploits differences in deferability between chronic and acute drugs, I also examine heterogeneity
in the announcement effect across different chronic drug classes in Section 6.3.B.
23
In other words, individuals would find it optimal to purchase the drug when the expected lifetime
path of prices for that treatment was higher (in the absence of the announcement), but not purchase the
drug when the expected lifetime path of prices was lower (after learning of the announcement).
24
Moreover, even in the case of a lifetime therapy, we can appeal to behavioral models of contextual
price effects (Thaler, 1985) to explain a delay in the timing of purchases. If we consider the announce-
ment of Part D as introducing a new lower “reference price” for drugs, then purchasing drugs before
implementation at a price that is higher than the reference price may be perceived as a “loss”, which
generates transaction disutility. This disutility may consequently reduce drug use.
11of Part D. Chronic drug users should anticipate a large subsidy from Part D given the
expected persistence in their drug use; whereas purely acute drug users, facing uncertain
future health shocks, may anticipate a much smaller subsidy in expectation. Again,
chronic drugs are predicted to be more responsive to the future price change than acute
drugs since the income effect will be larger. There is also an intra-temporal substitution
effect. To the extent that individuals take into account the entire cost of a therapy before
deciding whether to initiate a treatment, substitution between drug therapies and other
consumption may lead to an increase in chronic drug use. These positive effects would
be reinforced for drugs that exhibit strong complementarities in marginal health benefits
across time periods. The intuition for this response is analogous to the model for “rational
addiction” (Becker and Murphy, 1988).25
To summarize, chronic drugs are predicted to be more responsive to the announce-
ment of Part D than acute drugs and this response may be either negative or positive.
This hypothesis will be rejected empirically if elderly are myopic, the health costs of de-
laying drug use exceed the utility gain, or the elderly are liquidity constrained and cannot
consume out of increases in future income.
3.2 Salience and Timing of the Part D Announcement
My test of anticipatory behavior relies on two informational assumptions: first, that the
announcement of Part D was salient; second, that the timing of the announcement was
a surprise. Part D was signed into law as part of the MMA on December 8, 2003, but
the program did not actually begin until January 1, 2006. This implementation date was
stipulated by the MMA and thus was known in advance. Given the wide media coverage
of the passage of the legislation, it is reasonable to assume that many elderly anticipated a
reduction in their future drug expenditures. In a monthly Kaiser Family Foundation Poll,
nearly 75% of the elderly said they followed the Medicare prescription drug benefit “very
closely” or “somewhat closely” after February 2003 (see Appendix Figure A.1). Moreover,
the elderly followed the debate most closely in the month that the law was signed and
least carefully in the months after it was passed suggesting awareness that the debate had
ended. Another KFF poll quizzed individuals about whether the bill had passed 2 months
25
These drugs have the feature that a larger stock of past consumption raises the marginal health
benefit from current consumption. Thus individuals who anticipate increasing drug use in the future
(because of an anticipated future reduction in price), should increase use in the current period in order
to increase the benefit in the next period.
12after it was signed into law. 32% of elderly ages 65+ responded correctly, while 41% were
uncertain (among the non-elderly, 21% responded correctly). Even if elderly individuals
were not fully aware of the passage of the MMA, physicians and family-members may
have been better informed. Furthermore, the size of the benefit was immediately known
as major news sources such as the New York Times (Pear, 2003) reported the precise
coinsurance schedule on the day the bill was signed into law.
Finally, the timing of the announcement was unanticipated, which is necessary to pin
down the time period in which to estimate the anticipatory response. Adding prescription
drug coverage to Medicare had been the subject of nearly two decades of debate and
failed legislative proposals (Oliver, et al., 2004). The prescription drug bill was highly
controversial throughout the debate and press accounts suggest that it was far from certain
that a bill would pass at any point in time. The final conference bill that passed in the
House and Senate did so with very thin margins, 220 to 215 and 54 to 44 respectively.
Thus anticipatory responses are unlikely to have occurred prior to the passage of the law.
4 Data and Descriptive Statistics
4.1 Data Description
I use two sources of data on drug utilization: the Medicare Current Beneficiary Sur-
vey (MCBS) Cost and Use module for 2001-2006 and the Medical Expenditure Panel
Survey (MEPS) for 1997-2007. Both surveys collect nationally representative data on
non-institutionalized individuals’ healthcare utilization and expenditures. The MCBS
sample consists of only Medicare beneficiaries, while the MEPS surveys households of
all ages. Importantly, both datasets provide detailed records for each prescription drug
purchased (including refills) during the calendar year including the drug name and thera-
peutic drug class. The MCBS will serve as the primary data source for the analysis since
the sample size for the population of interest is more than twice as large as in the MEPS.
One key advantage of the MEPS is that it samples non-disabled individuals under age 65.
Since the near-elderly serve as an informative comparison group for the Medicare-eligible
elderly, I will also use MEPS data in some of the analyses.
From the initial MCBS sample of 74,139 observations, I exclude individuals with
incomplete drug utilization records for the calendar year. This involves dropping indi-
viduals who were not interviewed in every round, had partial year Medicare eligibility, or
13became institutionalized (20.6% of the sample). I also exclude individuals with missing
demographic characteristics. The final MCBS sample of Medicare beneficiaries ages 66-85
includes 41,475 observations.26 In many specifications, I use a sample of the youngest
Medicare beneficiaries ages 66-74 which includes 20,072 observations.
One caveat is that, unlike other studies of Part D that use pharmacy claims records,
the drug utilization data used in this paper is self-reported and thus subject to reporting
error.27 I can estimate the severity of misreporting using the 2006 MCBS. In 2006, survey
records were matched to Medicare administrative data for the first time for those enrolled
in Part D. The MCBS identifies which drug records are extracted from the survey only,
the claims only, or both the survey and claims. Among all prescription claims, 18.9%
of prescription records are reported only in administrative claims and thus would have
been absent from the survey data in previous years. Nevertheless, since the emphasis of
my analysis is on changes in utilization and not on levels, the misreporting error will not
confound my estimates if the magnitude of misreporting does not vary across years and is
orthogonal to my explanatory variables of interest. It should be noted that in my analysis
I exclude claims-only drug records in 2006 for comparability with previous years.
Despite this limitation, there are a number of advantages to using survey data over
pharmacy claims. The survey data provides a nationally representative sample, richer
demographic and health insurance status characteristics, and importantly, a long enough
time frame to examine utilization patterns before the announcement of Part D. Also,
as noted in Ketcham and Simon (2008), Part D may have changed the extent to which
people use multiple pharmacies or it may have induced people to use different pharmacies
than their usual store. Thus utilization changes may be better captured in nationally
representative survey data than using data from a single pharmacy.
26
I exclude individuals over age 85 due to the non-comparable measurement of drug utilization for
the institutionalized population. A high proportion of elderly over 85 are institutionalized (28% relative
to 8% for individuals aged 75-85 and 2% for individuals aged 66-74). For institutionalized beneficiaries,
MCBS prescription records are collected in a separate survey which is not directly comparable to the
non-institutionalized respondents. Thus the sample of prescription records is not representative for this
age group.
27
Both the MCBS and MEPS implement survey collection techniques to maximize the quality of the
reports, which include asking participants to save receipts and empty prescription bottles.
144.2 Descriptive Statistics
In table 1, descriptive statistics are reported for sub-groups from the MCBS and MEPS.
Column 4 presents characteristics of the elderly ages 66-74 from the MCBS, which is the
sample used in most of the analyses. Prescription drug use is highly prevalent among
this group. 92 percent of the elderly purchase at least one prescription each year– filling
on average 28 prescriptions at a total cost of $1,789. In addition to receiving Medicare
coverage, 11 percent of the sample are dually enrolled in Medicaid and 67 percent are
covered by supplementary private insurance plans such as Medigap or retiree employer
benefits. I estimate that 16 percent of elderly did not have any drug insurance coverage
prior to 2006.28 This is a slightly lower estimate than other sources. For example, Levy
and Weir (2009) find that 24% are drug-uninsured in the Health and Retirement Survey
in 2004. Comparing the MCBS to the MEPS for the same age group (Columns 3 and
4) demonstrates that mean utilization and expenditures are slightly higher in the MCBS.
This may be partially explained by differences in demographic characteristics across the
samples. The MCBS sample is slightly older and more educated.
Drug utilization is lower for the primary comparison group of adults ages 50-58
(Column 1). This group purchases nearly two-thirds as many prescriptions as the elderly
and has a rate of drug use of 76%. Naturally, the largest differences in demographic
characteristics across the two age groups are in employment status and insurance coverage.
In columns 5 and 6, means are reported for individuals who filled at least one acute
prescription or at least one chronic prescription. Many individuals purchased both types
of drugs and are included in both samples. The elderly fill on average 22 prescriptions of
chronic drugs and 3 prescriptions of acute drugs per year.
5 Empirical Framework
5.1 Baseline Model
I estimate the announcement effect of Part D on drug utilization by using a difference-
in-difference estimator with group-specific linear trends. The basic strategy compares
28
The MCBS elicits detailed information for up to five insurance plans (private, private HMO, or
Medicare HMO), including whether the plan covers drugs or offers a drug discount card. A person is
defined as drug-insured if they report that at least one of their plans covers prescription drugs or if they
receive drug coverage from a public program such as Medicaid, the VA or a state-sponsored drug plan.
If the individual only has access to a drug discount card they are not considered drug-insured.
15deviations from drug utilization trends for a treatment group that is more affected by the
announcement of Part D with the deviation from trend for a comparison group that is
less affected. As motivated by the conceptual framework, my main comparison is between
chronic and acute drug utilization. In one specification in Section 7.3, I also compare
drug utilization for individuals who are age-eligible for Medicare with those who are age-
ineligible. The key identifying assumption is that in the absence of the announcement, any
utilization differences between treatment and comparison groups would continue along the
same trend. I include group-specific linear trends because I find that chronic and acute
drugs do not exhibit parallel utilization trends in the pre-announcement period.
In particular, I estimate variants of the following equation which includes the an-
nouncement and implementation as separate policies:
Yitg = θ0 + θ1 t + θ2 AN N OU N CEt + θ3 IM P LEM EN Tt + θ4 Tig + θ5 (Tig × t)
(1)
+ θ6 (Tig × AN N OU N CEt ) + θ7 (Tig × IM P LEM EN Tt ) + Xit0 Γ + itg
For the chronic and acute drug comparison, the outcome is the number of prescrip-
tions (new and refill) purchased by individual i in year t in drug category g (where g
is chronic or acute). That is, each individual receives two observations in the regression
for each year– one for the number of chronic drugs that they purchase and one for the
number of acute drugs they purchase, including zeros. I also consider the log of the
number of prescriptions in some specifications.29 Tig is an indicator which equals one
if the observation is for chronic drugs, and zero if the observation is for acute drugs.
AN N OU N CEt is an indicator variable which turns on in 2004 and 2005, the time period
between the announcement and implementation of Part D, and IM P LEM EN Tt is an
indicator which turns on in 2006 after the program has been implemented. The omitted
time period is 2001 to 2003. Xit is a vector of individual level control variables including
male, age, age-squared, married, three education dummies, three race dummies, three re-
gion dummies, metro-area, employment status, Medicaid enrollment, and Medicare HMO
enrollment.30 Standard errors are clustered at the person level to allow for an arbitrary
variance-covariance matrix across the two drug groups and over time. I allow for differ-
29
To account for zeros in the data, the log transformation is log(number of prescriptions +1). I also
estimate Equation 1 using a negative binomial model in the Appendix to better account for the count
nature of the data.
30
I do not include a control for drug insurance coverage because it may itself be an outcome of the
announcement and implementation of Part D.
16ential trends across treatment and comparison groups by interacting a linear time trend
t (which takes on a value of 1 in 2001) with the treatment indicator. It should be noted
that Equation 1 allows only for an intercept shift in trends for the announcement and
implementation effects. While I cannot estimate a slope shift for the implementation ef-
fect given that I use only one year of post-implementation data, I do estimate slope shifts
for the announcement effect in some specifications. As discussed extensively in Section
3.1, chronic drugs should be more affected by the announcement of Part D than acute
drugs. Thus, the key variable of interest is the interaction between the announcement
and chronic indicators. A non-zero θ6 is evidence of a causal announcement effect.
While the majority of the analysis exploits variation in the predicted impact of the
announcement on chronic and acute drug utilization within the Medicare-eligible sample,
in Section 7.3, I compare overall drug utilization for adults who currently eligible for
Medicare (ages 66-74) with two groups of adults who are not yet eligible (ages 50-58 and
59-64). Taking seriously the idea of forward-looking behavior, even those who are not
yet eligible for Medicare may anticipate future subsidized coverage and respond to the
announcement. Those who are further from age 65 should be less responsive than those
who are closer to eligibility. For the age-eligible and age-ineligible comparison, I include
two treatment indicators: T 1i and T 2i .31 T 1i is an indicator for Medicare-eligible adults
aged 66-74 and T 2i is an indicator for Medicare-ineligible adults aged 59-64 who are close
to the eligibility threshold. The omitted comparison group are adults aged 50-58 who are
furthest from Medicare eligibility. In this specification, the outcome is the total number
of prescriptions filled. Thus, each individual receives only one observation per year.
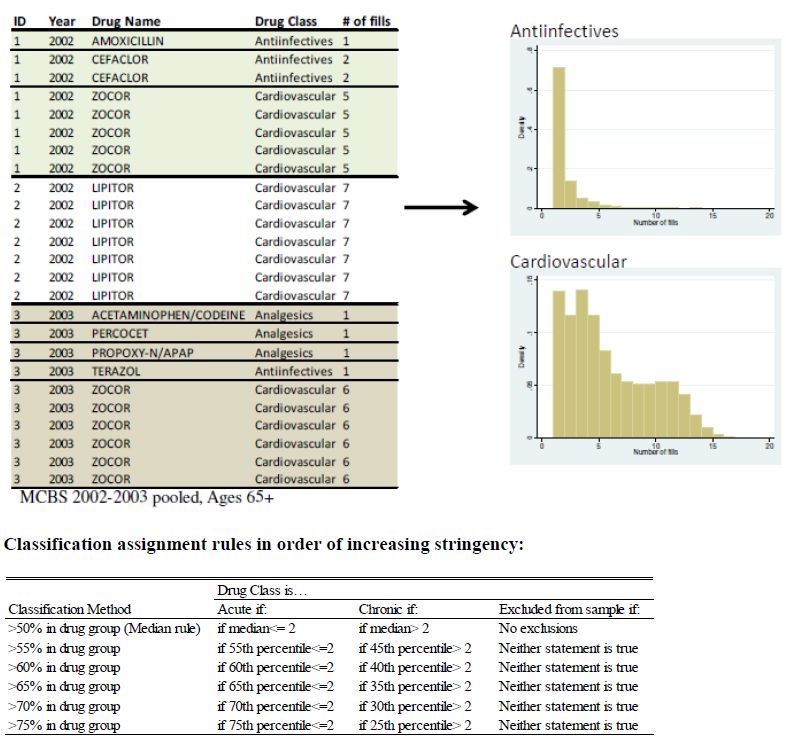
5.2 Defining Chronic and Acute Drugs
I use an empirical approach for categorizing drugs as chronic and acute based on observed
treatment duration. This method exploits average treatment patterns in the population
as opposed to clinical recommendations which may or may not be adopted. The classifi-
cation method (which is illustrated in Appendix Figure A.2) proceeds as follows. First,
31
The age-eligible and age-ineligible model is as follows:
Yit = β0 + β1 t + β2 AN N OU N CEt + β3 IM P LEM EN Tt + β4 T 1i + β5 T 2i + β6 (T 1i × t) + β7 (T 2i × t)
+ β8 (T 1i × AN N OU N CEt ) + β9 (T 2i × AN N OU N CEt ) + β10 (T 1i × IM P LEM EN Tt )
0
+ β11 (T 2i × IM P LEM EN Tt ) + Xit Γ + it
17I pool MCBS drug records for the elderly ages 65+ from 2002-2003. I use data from
before the announcement so as not to confound underlying utilization patterns with the
treatment effect of Part D. For each person, I count the number of purchases of each
drug in each year. I then combine these counts across people to construct empirical dis-
tributions of the number of prescriptions filled in a year for drugs in each therapeutic
class. Each drug is assigned one of 38 possible First Data Bank drug class categories.32
For example, if a person fills 1 prescription of Amoxicillin and 2 prescriptions of Cefaclor
(both Antiinfectives), and 5 prescriptions of Zocor (a Cardiovascular drug) during 2002
or 2003, then she contributes a 1 and 2 to the Antiinfectives distribution of prescriptions
filled and a 5 to the Cardiovascular distribution. As is apparent in Appendix Figure A.2,
Antiinfectives are clearly an acute drug class since their distribution has a large mass
point at 1, meaning that the vast majority of drugs in this class are filled only once a
year. Cardiovascular drugs, on the other hand, are more chronic in nature since they are
typically filled many times per year.
In the most conservative classification, I define a drug class as acute if more than
50% of the drugs in that class are filled 2 or fewer times per year (i.e. the median of
the distribution is ≤2) and chronic if more than 50% of the drugs are filled more than 2
times per year. I assign this classification to all drugs within the therapeutic class. 11
out of 32 classes used by the elderly are classified as acute, including Analgesics, EENT
preparations, and Antiinfectives (see full list in Appendix Table A.1). Cardiovascular
drugs, Diuretics, and Hypoglycemics are among the most frequently purchased chronic
treatments. With this approach, there is some measurement error since some drugs in
chronic classes are actually acute and vice versa and some drugs can be used for both
indications. The extent of the measurement error varies across drug classes depending
on how heterogeneous treatment duration is within the class. In sensitivity analyses,
I exclude the most heterogeneous drug classes from the sample by repeating the basic
classification algorithm with more stringent cutoffs. Appendix Figure A.2 describes the
classification rules in order of increasing stringency. For example, in the “65% rule,” a
drug class is classified as acute if more than 65% of drugs in the class are filled 2 times
or less per year and chronic if more than 65% of drugs in the class are filled more than 2
times. Heterogeneous drug classes for which fewer than 65% of drugs can be classified as
either acute or chronic (e.g. 45% acute, 55% chronic) are dropped from the sample.
32
32 classes have a positive number of prescriptions for the elderly. I exclude drugs with no therapeutic
classification.
18I validated this method by comparing the empirical classifications with classifications
made independently by three family medicine physicians. Both classification methods
corresponded very closely. Each physician was asked to report whether drugs in each
class were “somewhat more likely to be acute than chronic,” “much more likely to be
acute than chronic,” “somewhat more likely to be chronic than acute,” or “much more
likely to be chronic than acute.” In the most conservative classification (median rule),
the empirical algorithm matches the physicians’ classifications of chronic versus acute
drug classes 85% of the time. The match rate improves as the classification rule for the
empirical algorithm becomes more stringent. For example, using the “65%” rule, the
empirical classifications match the physician classifications 96% of the time. Appendix
Figure A.3 illustrates the match for three examples.
6 Results
I begin the analysis by comparing drug utilization changes following the announcement
and implementation of Part D for elderly who are eligible for Medicare relative to the
near-elderly who are not yet eligible. Medicare-eligibility status is a natural first cut for
identifying the announcement effect. This strategy has been used in most previous studies
of Part D. I select adults ages 50-58 as the initial comparison group because they are far
enough away from eligibility that they are unlikely to respond to the announcement, and
Medicare beneficiaries ages 66-74 who are closest in age to the comparison group. Figure
1 plots aggregate trends in drug utilization for these age groups in the MCBS and MEPS
from 1997-2007. The two datasets provide largely comparable measures of drug utilization.
For the elderly, the average number of prescriptions filled per year had been rising since
1997. Then immediately following the 2003 Part D announcement there was a distinct
leveling off and eventual decline in drug utilization. In contrast, no trend break after the
announcement is observed for the near-elderly. After 2006, when Part D took effect, drug
use for the elderly reverted upwards towards its pre-2003 trend. The pre-program “dip”
in utilization for the elderly is consistent with a dominating intertemporal substitution
effect, in which beneficiaries delay some drug use until after Part D is implemented.
Consequently, the increase between 2005 and 2006 may constitute both the treatment
effect of Part D and mean reversion. Thus, studies that use small windows of data
around the implementation date could overstate the implementation effect.
While the striking graphical evidence is strongly suggestive of a negative announce-
19ment effect, we might be concerned that the 50-58 age group does not provide a sufficient
measure of counterfactual drug utilization for the Medicare-eligible elderly. Producing a
valid difference-in-difference estimate requires a comparison age group that is far enough
away from the eligibility cut-off so that they are less likely to respond to Part D, but
near enough to the cut-off to have similar drug utilization patterns as the elderly. These
criteria may be difficult to satisfy for several reasons. For example, time-varying factors
related to Social Security benefits, Medicare benefits, the markets of certain drugs, and
so forth could explain the differential pre-program decline in utilization for the elderly.
Due to these concerns, the next part of my analysis uses identifying variation for the
announcement effect within the elderly age group, which should alleviate concerns that
age-specific secular trends are driving the results.
The outline of the remainder of the analysis proceeds as follows. I first estimate
the aggregate announcement effect for Medicare beneficiaries and heterogeneity in the
intensity of this effect across age and demographic groups. Since aggregate effects are
estimated from a basic time series model– estimating changes in utilization relative to
the pre-existing trend– they may be biased if other aggregate shocks to utilization occur
during this time period. To overcome this concern, I then conduct my main test comparing
the differential effects of the announcement on chronic and acute drug utilization among
beneficiaries. I revisit the age-ineligible comparison group in the final section to test
whether those who are nearing eligibility are also responsive to the announcement relative
to younger adults who are further from eligibility. Taken together, these tests aim to
identify whether the decline in drug utilization observed in Figure 1 represents a causal
response to the announcement of Part D.
6.1 Aggregate Drug Utilization Effects for the Elderly
Before presenting difference-in-difference results comparing chronic and acute drug use, I
examine aggregate changes in drug utilization, which has been the focus of previous eval-
uations of Part D. I estimate the announcement and implementation effects as deviations
from the prior utilization trend in a simple interrupted time series model for the Medicare
sample as follows:
Yit = π0 + π1 t + π2 AN N OU N CEt + π3 IM P LEM EN Tt + Xit0 Γ + it (2)
Table 2 reports the OLS results for variants of this equation. The dependent vari-
20able is total prescriptions. In column 1, only the implementation indicator is included
along with the time trend and controls, under the assumption that π2 = 0 (i.e. no an-
nouncement effect). This specification is analogous to previous studies that identify the
treatment effect by comparing drug utilization right before and after the implementation
date, ignoring possible anticipatory effects. Using this specification, the implementation
effect is large, positive, and statistically significant at the 1% level, representing an aver-
age annual increase of 3 prescriptions or a 10.6% increase relative to the sample mean.
From this estimate– which is comparable to the effect size found in other studies of 4 to
10%– it would appear that Part D had a large positive effect on utilization in the first
year of the program.
If the assumption of no anticipatory effects is correct, controlling for the announce-
ment indicator should not change the estimate of π3 . On the contrary, I find that after
adding the announcement indicator in column 3, the implementation effect shrinks from
3.0 to 0.9 and becomes statistically insignificant, although it is imprecisely estimated.
The announcement effect itself (π2 ) is statistically significant and negative, represent-
ing a decline of 1.61 prescriptions (a 6% decline relative to the sample mean).33 This
announcement response is also economically important given that it is nearly equiva-
lent to the average annual growth rate of utilization during this time period suggesting
that utilization growth nearly halted for two years. Excluding Medicaid beneficiaries34 in
Appendix Table A.2 produces similar estimates. This set of analyses provides the first
piece of evidence that there may be a large upward bias in the implementation effect if
anticipatory responses are not taken into account.
When I repeat the above exercise with log prescriptions as the dependent variable in
Columns 4-6, I find a smaller percent decline in utilization after the announcement which
is statistically insignificant. Since the log transformation places more weight on smaller
prescription counts, this smaller effect relative to the level specification suggests possible
treatment effect heterogeneity, with the announcement having a larger effect for elderly
with high levels of drug utilization. I investigate this claim further by estimating quan-
tile regressions of the same interrupted time series model.35 The estimated conditional
33
In this analysis, I do not report estimates of elasticities, as other studies of Part D have done, because
individuals responded to a perceived price change which is unknown.
34
Medicaid beneficiaries were switched from Medicaid drug coverage to Medicare coverage. It is not
clear whether they would anticipate a decline or increase in benefit generosity from Part D.
35
Confidence intervals are block bootstrapped at the person level to preserve the serial correlation
structure of the error term.
21You can also read