The ARBOR benchmark report - Biomass for Energy in the Northwest European region

Page created by Jesus Mendez
 
CONTINUE READING
The ARBOR benchmark report - Biomass for Energy in the Northwest European region
Biomass for Energy in the Northwest European region:
The ARBOR benchmark report
The ARBOR benchmark report - Biomass for Energy in the Northwest European region
Improving sustainable biomass
utilisation in North West Europe
The ARBOR benchmark report - Biomass for Energy in the Northwest European region
45
The ARBOR benchmark report - Biomass for Energy in the Northwest European region
ARBOR (Accelerating Renewable Energies through valorisation of Biogenic Organic Raw
Summary

          Material) is a project partnership between six regions in the North West European area:
          Belgium, Germany, Ireland, Luxembourg, the Netherlands and the United Kingdom. This
          project has received European Regional Development Funding through INTERREG IVB.
          This report was set up to summarise, list and compare the current situation concerning
          bioenergy of these six countries. In 2012 the first version of the report was published
          and at the end of the project (2015) an update of this report will be carried out in order
          to evaluate the progress made.

          In the first chapter an overview is given of current national statistics. In this chapter the
          current situation for renewable (bio-)energy is compared to the 2020 targets. It appears
          that Belgium and Germany are well on track in reaching these targets, while Ireland,
          Luxembourg and the Netherlands are more or less on track and the United Kingdom is
          not entirely on track. Except for Germany however, none of them have reached half of
          their 2020-targets. Biomass already accounts for more than 50% of renewable energy
          produced and according to plans will continue to cover a large share of renewable
          energy till 2020.

          Chapter 2 gives an overview of the targets set out for the acceleration of bioenergy
          production and how these targets are to be reached, divided in three categories:
          renewable electricity, renewable heating and cooling and renewable transport.
          Except for Belgium and Ireland, all countries expect and plan their total national energy
          consumption to stagnate or even decrease. This chapter also lists how much biomass
          is expected to be locally available. Next to this some conclusions are made about the
          amounts of biomass that will have to be imported to be able to reach the targets.

          In Chapter 3 the strategies documented in the national renewable energy action plans
          (NREAP) and national biomass action plans (nBAP) are listed. For the NREAP an overview
          is given of the potential mobilisation of new energy sources. Strategies concerning the
          assignment of land for energy crops, the inputs towards anaerobic digestion (AD),
          forest management techniques and policies promoting the production of biogas are
          very different amongst the six countries. The impact on other sectors is also subject of
          this chapter. A short overview of different existing nBAP is given.

          In Chapter 4 the policy framework for the development of biomass strategies is
          described. Aspects that are dealt with are legislation, sustainability criteria and support
          measures.

          In the last chapter countries were asked to give two or more case-studies that can serve
          as an innovative example of bioenergy in their country. A comprehensive table also was
          made of bioenergy projects in North-West Europe that are ongoing or already finished
          and that have a clear link with ARBOR.

                                                                                                          45
The ARBOR benchmark report - Biomass for Energy in the Northwest European region
Summary                                                                                   5
     Table of contents
                         Table of contents                                                                         6

                         List of abbreviations                                                                     8

                         List of figures                                                                           9

                         List of tables                                                                           10

                         Introduction                                                                             11

                         Chapter 1: National statistics for biomass                                               12
                         1.1 State of the art: 2020 targets for renewable energy                                  12
                         1.2 Most recent available data for: renewable (bio-)energy for electricity, heating or   14
                             cooling and biogenic fuels

                         Chapter 2: Plans and targets for energetic biomass acceleration                          16
                         2.1 Overview biomass targets                                                              16
                             2.1.1 Overview biomass targets in time                                                16
                                                                                                                   18
                             2.1.2 Overview biomass targets divided in three categories: renewable electricity,
                         		          renewable heating and cooling and renewable transport
                         2.2 Local available biomass today and in the future                                       22
                             2.2.1. Developments after 2006-2007                                                   24
                         2.3 Share local biomass & share imported biomass                                          25

                         Chapter 3: Overview of the different National Renewable Energy Action Plans              26
                         		         and National Biomass Action Plans
                         3.1 NREAP                                                                              27
                             3.1.1 NREAP targets                                                                27
                             3.1.2 Mobilisation of new biomass sources                                          27
                         		        3.1.2.1 Perennial energy crops on degraded land and unused arable land       27
                         		        3.1.2.2 Energy use of available primary material                             28
                         		        3.1.2.3 Policies promoting the production and use of biogas                  28
                         		        3.1.2.4 Planned measures to improve forest management techniques in order 			29
                         			                 to maximise the extraction of biomass in a sustainable way
                             3.1.3 Impact on other sectors                                                      30
                         		        3.1.3.1 Monitoring of the impact of energy use of biomass on other sectors   30
                         		                                                                                     30
                                   3.1.3.2 Expected development in other sectors that could have an impact on
                         			                 the energy use of biomass
                         		        3.1.3.3 Recent developments                                                  31
                         3.2 nBAP                                                                                 32
                         Chapter 4: Instruments for the development of biomass strategies                         34
                         4.1 Legislation                                                                          35
                             4.1.1 Wood boilers                                                                   35
                         		          4.1.1.1 Permits                                                              35
                         		          4.1.1.2 Inputs (excl. UK)                                                    36
                         		          4.1.1.3 Outputs (excl. IRL)                                                  37
                             4.1.2 Anaerobic digestion (excl. NL)                                                 38
                         		          4.1.2.1 Permits                                                              38
                         		          4.1.2.2 Inputs                                                               39
                         		          4.1.2.3 Outputs                                                              39
                             4.1.3 Biofuels (excl. D, NL)                                                         40
                         		          4.1.3.1 Permits                                                              40

67
The ARBOR benchmark report - Biomass for Energy in the Northwest European region
4.2 Sustainability criteria                                                      41
    4.2.1 Belgium                                                                41
		         4.2.1.1 Sustainability criteria for green electricity from biomass    41
		         4.2.1.2 Sustainability criteria for biofuels                          42
		         4.2.1.3 Focus on sustainability in policy frameworks                  42
    4.2.2 Germany                                                                42
    4.2.3 Luxembourg                                                             43
    4.2.4 Ireland                                                                43
    4.2.5 the Netherlands                                                        44
    4.2.6 United Kingdom                                                         45
4.3 Support measures                                                             46
    4.3.1. Overview                                                              46
    4.3.2. Belgium                                                               47
    4.3.3. Germany                                                               48
    4.3.4 Ireland                                                                48
    4.3.5 Luxembourg                                                             49
    4.3.6 the Netherlands                                                        51
    4.3.7 United Kingdom                                                         52
Chapter 5: Regional strategies and case studies                                  54
5.1 Belgium – Flanders                                                           55
    5.1.1 Regional strategy                                                      55
    5.1.2 Innovative case 1: Biogas Boeye - co-digestion in agricultural areas   55
    5.1.3 Innovative case 2: Ecowerf: digestion before composting                55
    5.1.4 Innovative case 3: small digestion at Hendrickx dairy farm             55
5.2 Germany – Saarland                                                           56
    5.2.1 Regional strategy                                                      56
    5.2.2 Innovative case 1: Methavalor                                          56
    5.2.3 Innovative case 2: Bioenergie Merzig gGmbH                             56
    5.2.4 Innovative case 3: Greenery residues fermentation plant Regen          57
    5.2.5 Innovative case 4: Biomass cogeneration plant Warndt                   57
5.3 Ireland – South East Region                                                  57
    5.3.1 Regional strategy                                                      57
    5.3.2 Innovative case 1: Inchydoney Island Lodge and Spa                     57
    5.3.3 Innovative case 2: Teagasc Crops Research Centre                       58
    5.3.4 Innovative case 3: Gartan Outdoor Education Centre                     58
5.4 Luxembourg                                                                   59
    5.4.1 Regional strategy                                                      59
    5.4.2 Innovative case 1: Naturgas Kielen                                     59
    5.4.3 Innovative case 2: Ecogen                                              59
    5.4.4 Innovative case 3: Kiowatt (Luxembourg)                                59
5.5 The Netherlands – regions Utrecht and Gelderland                             60
    5.5.1 Regional strategy                                                      60
    5.5.2 Innovative case 1: A. van de Groep en Zonen                            60
    5.5.3 Innovative case 2: Simon Zwarts                                        60
    5.5.4 Innovative case 3: region Arnhem - Nijmegen                            60
    5.5.5  Innovative case 4: municipality Nijmegen                              61
5.6 UK – Stoke-on-Trent and Staffordshire                                        61
    5.6.1 Regional strategy                                                      61
    5.6.2 Innovative case 1: John Pointon and Sons Ltd                           61
    5.6.3 Innovative case 2: Staffordshire County Council                        62

Appendices:                                                                      64
Appendix 1: Overview of relevant biomass projects

references:                                                                      68

                                                                                      67
The ARBOR benchmark report - Biomass for Energy in the Northwest European region
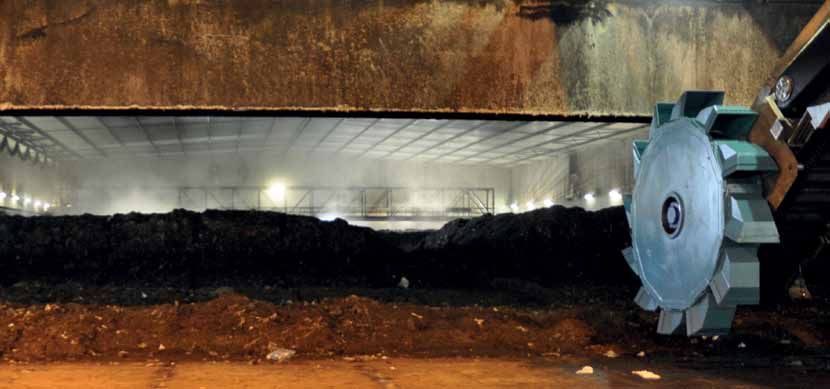
ABP		      Animal-by-products
     List of abbreviations
                             AD		       Anaerobic digestion
                             ARBOR      Accelerating Renewable Energies through valorisation of Biogenic Organic Raw Material
                             Av. Red.   Aviation reduction
                             CAP		      Common agricultural policy
                             CHP        Combined heat and power
                             DAFF       Department of Agriculture, Fisheries and Food (Ireland)
                             GEC		      Green electricity certificates
                             HWRC       Household waste recycling centre
                             KGW        Kitchen and Garden Waste
                             Mio		      Million
                             IPPC       Integrated Pollution Prevention Control
                             LNG		      Liquified natural gas
                             LPG		      Liquified petroleum gas
                             LoW		      European List of waste
                             (n)BAP     National biomass action plan
                             NGO		      Non governmental organisation
                             NREAP      National renewable energy action plan
                             NTA		      Netherlands Technical Approach
                             ORC		      Organic Rankine Cycle
                             PPO		      Pure plant oil
                             Ref.		     Reference scenario
                             SRC		      Short Rotation Coppice
                             SRF		      Solid recovered fuels
                             RED		      Renewable Energy Directive 2009/28/EC
                             RES		      Share of renewable energy
                             VLACO      Flemish Compost Organisation
                             VLAREA     Flemish Legislation for Waste Prevention and Management
                             VREG       Flemish Regulator of the Electricity and Gas market
                             WFQA       Wood Fuel Quality Assurance Certification

89
The ARBOR benchmark report - Biomass for Energy in the Northwest European region
Figure 1:    Representation of the share of renewable energy in total national energy consumption
List of figures
                  		           in 2009 against the national EU 2020 target for renewable energy (%) and the share of
                  		           energy from biomass in final energy consumption against the NREAP ‘targets for
                  		           biomass’.

                  Figure 2:    Production of renewable energy (from biomass (shaded areas)) for electricity (yellow),
                  		           heating & cooling (red) and transport (blue) in Flanders (2010), Germany (2010),
                  		           Luxembourg (2005), Ireland (2010), the Netherlands (2010) and the United Kingdom
                  		           (2009).

                  Figure 3:    Evolution of gross final energy consumption in the reference scenario, incl. aviation
                  		           reduction.

                  Figure 4:    Evolution of gross final energy consumption in the additional energy efficiency
                  		           scenario, incl. aviation reduction.

                  Figure 5:    Evolution of the share renewable energy in gross final energy consumption
                  		           (ref., incl. av.red.).

                  Figure 6:    Evolution of the share of renewable energy from biomass in gross final energy
                  		           consumption (ref., incl. av. red.).

                  Figure 7:    Planned distribution for Belgium of multiple inputs for renewable energy in 2005, 2010,
                  		           2015 and 2020, divided over three categories: renewable electricity, renewable heating
                  		           & cooling and renewable transport.

                  Figure 8:    Planned distribution for Germany of multiple inputs for renewable energy in 2005,
                  		           2010, 2015 and 2020, divided over three categories: renewable electricity, renewable
                  		           heating & cooling and renewable transport. Comparison with state-of-the-art data
                  		           from 2010.

                  Figure 9:    Planned distribution for Ireland of multiple inputs for renewable energy in 2005, 2010,
                  		           2015 and 2020, divided over three categories: renewable electricity, renewable heating
                  		           & cooling and renewable transport. Comparison with state-of-the-art data from 2010.

                  Figure 10:   Planned distribution for Luxembourg of multiple inputs for renewable energy in 2005,
                  		           2010, 2015 and 2020, divided over three categories: renewable electricity, renewable
                  		           heating & cooling and renewable transport. Comparison with state-of-the-art data
                  		           from 2005.

                  Figure 11:   Planned distribution for the Netherlands of multiple inputs for renewable energy in
                  		           2005, 2010, 2015 and 2020, divided over three categories: renewable electricity,
                  		           renewable heating & cooling and renewable transport. Comparison with
                  		           state-of-the-art data from 2010.

                  Figure 12:   Planned distribution for the United Kingdom of multiple inputs for renewable energy in
                  		           2005, 2010, 2015 and 2020, divided over three categories: renewable electricity,
                  		           renewable heating & cooling and renewable transport. Comparison with state-of-the-
                  		           art data from 2009.

                                                                                                                            89
The ARBOR benchmark report - Biomass for Energy in the Northwest European region
Table 1:    Overall renewable energy targets from the RED (share renewable energy in gross final
     List of tables
                      		          energy consumption (%)).

                      Table 2:    NREAP targets for bioenergy specified by countries to achieve the targets for renewable
                      		          energy by 2020 (%).

                      Table 3:    Efforts (presented as a factor =(target 2020)/(situation 2009)) still to be made by
                      		          the countries till 2020.

                      Table 4:    NREAP targets for biomass specified by countries to achieve the targets for
                      		          renewable energy by 2020 (%).

                      Table 5:    Domestic resource in 2006 (ktoe).

                      Table 6:    Domestic resource in 2009 (ktoe).

                      Table 7:    Domestic resource in 2010 (ktoe).

                      Table 8:    Expected amount of domestic resource in 2015 (ktoe).

                      Table 9:    Expected amount of domestic resource in 2020 (ktoe).

                      Table 10:   Land used in 2006-2009-2010 for low impact energy crops.

11
10
This document can be considered as a “starting point” for ARBOR, an Interreg IVB project for North-
Introduction
               West Europe. ARBOR stands for Accelerating Renewable Energies through valorisation of Biogenic
               Organic Raw Material. It was approved in March 2011 as a strategic initiative for a duration of 4 years.

               The different ARBOR-partners are:
               • From Belgium: FlandersBio, Ghent University, Inagro, Provincial Development Agency West
                  Flanders (POM West-Vlaanderen), Flemish Coordination Centre for Manure Processing (VCM)
               • From Germany: Institute for Future Energy Systems (IZES) gGmbH
               • From Ireland: University College Dublin (NUID - UCD)
               • From Luxembourg: Public Research Centre Henri Tudor (CRTE)
               • From the Netherlands: DLV Plant BV, Province of Utrecht, Wageningen University
               • From the UK: Stoke-on-Trent city Council, Staffordshire University (lead partner)

               Total budget for ARBOR is € 7 361 959.
               The framework for ARBOR are the EU 20 20 20 targets in order to mitigate climate change and
               the fact that biomass accounts for 50% of the renewables in Europe. Although a lot of expertise
               concerning biomass is available, it is noted that this information is not disseminated in a coordinated
               way, nor is it related to commercial exploitations. That is why the ARBOR-mission is to accelerate the
               sustainable development and use of biomass in North West Europe, to facilitate the achievement of
               the EU 20 20 20 objectives and to realise a world-class utilisation of biomass.

               The aim of this document, as a part of the total ARBOR-project, is to get a comprehensive state-of-
               the-art assessment on the use of biomass for bioenergy in the project regions. The document will
               be updated at the end of the project to determine the evolution in statistics and policy.
               Data was gathered by means of a template that was filled out by the different partners. Another
               important source of information were the National Renewable Energy Action Plans (NREAP) that
               every Member State had to make to comply with article 4 of the renewable energy Directive
               (2009/28/EC). These plans provide detailed roadmaps of how each Member State expects to reach
               its legally binding 2020 target for the share of renewable energy in their final energy consumption.
               It was not compulsory to make a National Biomass Action Plan (nBAP), but out of the different
               ARBOR-partners, Luxembourg and Belgium are the only two without an nBAP.

               Other frequently consulted documents/websites, were:
               • Beurskens, L.W.M., Hekkenberg, M. & Vethman, P. (2011). Renewable Energy Projections as
                  published in the National Renewable Energy Action Plans of the European Member States
                  covering all 27 EU Member States with updates for 20 Member States. Version of 28th
                  November 2011. European Environment Agency, 270p.
               • Directive 2009/28/EC of the European Parliament and of the Council of 23 April 2009 on the
                  promotion of the use of energy from renewable sources and amending and subsequently
                  repealing Directives 2001/77/EC and 2003/30/EC
               • BAP Driver (2009). European best practice report. Comparative assessment of national
                  bioenergy strategies & biomass action plans in 12 EU countries. Extended version. 143p.
               • www.eubionet.net

               The report was composed by Inagro (Greet Ghekiere, Anke De Dobbelaere) and POM
               West-Vlaanderen (Geert Dangreau, Viooltje Lebuf ). FlandersBio (Willem Dhooge) took care
               of the final lay-out.

                                                                                                                          11
                                                                                                                          10
Chapter 1 - National statistics for biomass

     1.1 State of the art: 2020 targets for renewable energy
     In table 1 the targets for renewable energy from the renewable energy directive 2009/28/EC (RED) are shown,
     including the trajectories to be followed.

     Table 1: Overall renewable energy targets from the RED (share renewable energy in gross final energy
     consumption (%)).1

         			                                2005           2010           2015          2020
         Belgium		                            2.2            4.4           7.1           13.0
         Germany		                            5.8            8.2           11.3          18.0
         Ireland		                            3.1            5.7            8.9          16.0
         Luxembourg		                         0.9            2.9            5.4          11.0
         the Netherlands		                    2.4            4.7            7.6          14.0
         United Kingdom                       1.3            4.0            7.5          15.0

     In their National Renewable Energy Action Plan (NREAP) countries have specified till 2020 how much of the
     renewable energy will be coming from biomass. In table 2 these ‘targets for bioenergy’ are summarised.

     Table 2: NREAP targets for bioenergy specified by countries to achieve the targets for renewable energy
     by 2020 (%).

         			                                2005           2010           2015          2020
         Belgium		                            1.7            3.1            5.2           8.9
         Germany		                            4.5            6.9            7.8           9.9
         Ireland		                            1.5            2.8            5.4           6.9
         Luxembourg		                         0.5            1.6            3.2           6.7
         the Netherlands		                    2.0            3.1            5.3           7.5
         United Kingdom                       0.9            1.7            3.3           7.3

     Based on the most recent available national statistics for renewable energy and biomass, an overview can be made
     of what the situation is in reaching the national EU 2020 targets. Figure 1 gives such an overview. It is clear that
     bioenergy in the future will account for an important share of renewable energy.

     1
      The targets shown for 2010 and 2015 are these calculated for the respective trajectory periods 2011-2012 and 2015-2016 following the
     equations defined in the RED: S2005+0.20*(S2020-S2005) for 2011-2012 and S2005+0.45*(S2020-S2005) for 2015-2016. The share of renewable energy is
     the amount of renewable energy in gross final energy consumption after a reduction for aviation is applied for some countries as defined in
     the RED.

     2
       The targets for bioenergy, as we will call them here, are the amounts of bioenergy in final energy consumption according to the reference
     scenario without aviation reduction (when applicable) (reference: Beurskens et al. (2011)), since the data for the actual situation didn’t include
     aviation reduction and are based on final energy consumption. When comparing the shares of renewable energy with those of bioenergy this
     means that for some countries the share of biomass in gross final energy consumption would be a bit smaller than the shares based on final
     energy consumption. In short: when comparing the shares of renewable energy with bioenergy, bioenergy can be a little underestimated for
     some countries. The Netherlands don’t have a reference scenario so for the Netherlands numbers are based on the additional energy efficiency
     scenario.
13
12
National statistics for biomass

                                                   20
                                                                                                                                                                    National EU 2020
                                                   18
Share in total national energy

                                                                                                                                                                    target renewable
                                                   16                                                                                                               energy (%)
                        energy consumption (%)

                                                   14
                         Share in total national
      consumption (%)

                                                   12                                                                                                               Share renewable
                                                   10                                                                                                               energy in 2009 (%)
                                                    8
                                                                                                                                                                    Biomass target 2020 (%)
                                                    6
                                                    4                                                                                                               Share energy
                                                    2                                                                                                               from biomass
                                                    0                                                                                                               in 2009 (%)
                                                        Belgium

                                                                        Germany

                                                                                        Ireland

                                                                                                                           the Netherlands

                                                                                                                                             United Kingdom
                                                                                                          Luxembourg

  Figure 1: Representation of the share of renewable energy in total national energy consumption in
  2009 (Eurostat, 2012) against the national EU 2020 target for renewable energy (%) and the share of
  energy from biomass in final energy consumption in 2009 (AEBIOM, 2011) against the NREAP ‘targets for
  biomass’.

  On the basis of the national statistics (figure 1) and the targets (table 1 and 2) it can be concluded that Belgium
  and Germany are well on track in reaching the targets, Ireland, Luxembourg and the Netherlands are more or less
  on track, while the United Kingdom is not entirely on track with the targets for renewable energy set out in the
  RED. For biomass it can be concluded that Belgium, Germany, Luxembourg and the United Kingdom are on track
  with the targets they specified for biomass in their NREAP while Ireland and the Netherlands are only more or less
  on track with these ‘biomass targets’. From figure 1, based on what is achieved till 2009, it can be concluded that
  for renewable energy (from biomass) countries will still have to make the following efforts (table 3) to reach the
  targets till 2020.

  Table 3: Efforts (presented as a factor=(target 2020)/(situation 2009)) still to be made by the countries
  till 2020.

                    Efforts                             Belgium            Germany                Ireland              Luxembourg                the Netherlands           United Kingdom

                    Renewable                                     2.8             1.8               3.2                   4.1                                 3.4                  5.2
                    energy

                    Renewable                                     2.5             1.3               3.5                   3.7                                 2.6                  4.3
                    energy from
                    biomass

  Looking at table 3 it can be concluded that the United Kingdom and Luxembourg will have to make the most
  efforts to reach the 2020 targets, while Germany has already made quite some efforts. Belgium, Ireland and the
  Netherlands are situated in between these categories. Except for Germany, five countries haven’t reached half of
  their 2020-targets.

                                                                                                                                                                                              13
                                                                                                                                                                                              12
1.2 Most recent available data for: renewable (bio-)energy for electricity,
         heating or cooling and biogenic fuels
     Biomass and other renewable sources are used to produce electricity, heat (or cooling) and biogenic fuels. In
     figure 2 it is shown how inputs are divided over these three categories3 :

                           Flanders: 2010                                           Germany: 2010
                                  2% 0,27%                                                   4%
                                             9%

                                                                                                                 25%

             40%                                         25%

                                                                       46%

                                                                                                                    12%

                                       24%                                                         13%

                            Ireland: 2010                                         Luxembourg: 2005

                               5%                                                       1% 3%

                                                                                                                   36%

             30%                                         45%

                                                                       48%

                                                                                                             10%
                       13%
                                       7%                                                           2%

                     The Netherlands: 2010                                     United Kingdom: 2009

                               6%                                                             1%
                                                                                  13%
                                                  20%                                                      18%

             34%                                                       15%

                                                        29%

                           11%                                                                     53%

               Renewable electricity   Renewable heating and cooling   Renewable transport        Energy from biomass
15
14
Figure 2: Production of renewable energy (from biomass (shaded areas)) for electricity (yellow), heating
& cooling (red) and transport (blue) in Flanders (2010), Germany (2010), Luxembourg (2005), Ireland
(2010), the Netherlands (2010) and the United Kingdom (2009).

Out of these diagrams it can be concluded for all six countries that biomass produces half or more of the
renewable energy produced. In the United Kingdom biomass is mainly used for electricity production, while in
Flanders, Luxembourg, Germany and Ireland it is mainly used for heating and cooling. In the Netherlands the
share that goes to electricity is almost equal to the share of biomass for heating (or cooling). In Flanders and
Ireland a substantial share of total biomass is also used to produce biofuels.

                                                                                   Biomass and other renewable
                                                                                   sources are used to produce
                                                                                   electricity, heat (or cooling)
                                                                                   and biogenic fuels.

3
 These diagrams are based on most recent available estimates delivered by the partners from the ARBOR project: for Germany data are obtained
from the Federal Ministry for the Environment (2011), for Ireland from SEAI (2011), for Luxembourg from NREAP (2010), for the Netherlands
from Centraal Bureau voor de Statistiek (2011) and Ministerie van Economische Zaken (2010) and for the United Kingdom from Department
of Energy and Climate Change (2011a). Since no recent data were yet available for Belgium, a diagram for Flanders is presented in which a
provisional indication for these different categories is shown based on numbers from Jespers et al. (2011).
                                                                                                                                               15
                                                                                                                                               14
Chapter 2 - Plans and targets for energetic
     biomass acceleration

     2.1 Overview biomass targets
     2.1.1 Overview biomass targets in time

     The evolution of total national energy consumption (also known as gross final energy consumption) that was
     planned in the NREAPs is shown in figure 3 and 44. Figure 3 shows gross final energy consumption according to
     the reference scenario. Figure 4 shows the gross final energy consumption for the additional energy efficiency
     (and thus more optimistic) scenario. In both figures aviation reduction has been applied for certain countries as
     was prescribed for the calculation of the share of renewable energy (RES) by the RED. The choice of the scenario
     has a large impact on whether or not the RED targets are reached, table 4 gives an overview of the expected share
     renewable energy in 2020 based on the different scenarios. Background colours show if targets for 2020 (listed in
     table 1) are reached (green) or not (red). Most of the countries (here all six except Germany) calculated with the
     additional efficiency scenario in their NREAP to reach the targets set in the RED.

     Table 4: NREAP targets for biomass specified by countries to achieve the targets for renewable energy by
     2020 (%).

         RES 2020 (%) Belgium Germany Ireland Luxembourg                                         the               United           Total 6
         								                                                                            Netherlands          Kingdom          countries

         Additional              13.0           19.6         16.0             11.0                14.5                15              16.8
         energy
         efficiency
         scenario

         Reference               12.7           18.2         14.8              9.8                (14.5)             14.4             16.0
         scenario

     Based on figures 3 and 4 it can be concluded that Belgium, Ireland and Luxembourg expect their energy consumption
     to rise, while the other countries expect their energy consumption to more or less stagnate (The Netherlands) or
     even decline (Germany and the United Kingdom).

     Based on (gross) final energy consumption the share renewable energy and the share bioenergy planned over the
     years 2005, 2010, 2015 and 2020 are shown in the respective figures 5 and 6. Looking at the slope of these graphs,
     generally in all countries the greatest effort to be made in amounts of energy coming from renewable inputs is
     planned in the period of 2015 to 2020. This is not always the same for energy coming from biomass. For biomass
     the greatest efforts still to be delivered differ between countries: for Belgium, Luxembourg and United Kingdom
     greatest efforts are planned in 2015-2020. For Ireland and the Netherlands greatest efforts are planned in 2010-2015,
     while for Germany greatest efforts are planned in 2005-2010.

     4
       Since data from the benchmark reports were not comparable between the different countries, NREAP and biomass targets were retrieved
     from Beurskens et al. (2011). No aviation reduction scenario is available for Belgium and Germany over the whole period and for Ireland for
     2015-2020, so numbers for these countries are based on the same scenarios but without aviation reduction. The Netherlands don’t have a
     reference scenario so for the Netherlands numbers are based on the additional energy efficiency scenario.
17
16
Total national energy consumption
Total national energy consumption                                                                                                                                                                                               Total national energy consum
                                                                                                                                                                                                    Total national energy consumption
                                       (reference scenario + aviation reduction)
  (reference scenario + aviation reduction)                                                                                                                                                (additional energy efficiency scenario(additional
                                                                                                                                                                                                                                   + aviation energy efficiency scenario + aviat
                                                                                                                                                                                                                                              reduction)
                                              (=100%)(=100%)

                                                                                                                                                         of energy in 2005 (=100%)
                          of energy (%) against the

                                                                                                                                                  Amount of energy (%) against the
                                                               125                                                                                                                         125                                                               125
                                                               120                                                                                                                         120                                                               120

                                                                                                                                                                                                                          amount of energy in 2005 (=100%)
                                                                                                                                                      amount of energy in 2005 (=100%)
                      Amount of energy (%) against the

                                                                                                                                                                                                                          Amount of energy (%) against the
                                                                                                                                                      Amount of energy (%) against the
                                         in 2005

                                                               115                                                                                                                         115                                                               115

                                                               110                                                                                                                         110                                                               110
                               energy in 2005

                                                               105                                                                                                                         105                                                               105
                         of ofenergy

                                                               100                                                                                                                         100                                                               100
                                                                95                                                                                                                           95                                                               95
                      amount

                                                                90                                                                                                                           90                                                               90
                  Amount
                  amount

                                                                                                                                                  amount
                                                                85                                                                                                                           85                                                               85
                                                                80                                                                                                                           80                                                               80
005              2010                                          2015   20052020                            2010          2015       2020                                                                 2005          2010                                   2015   20052020     2010          2015

                          Year                                                                              Year                                                                                                                    Year                                                Year

                Figure in
al energy consumption  3: Evolution of gross
                          the reference      final incl.
                                        scenario,  energy
                                                                Figure 3: Evolution of gross final energy
                                                            consumption
                                                         aviation        in the reference scenario, incl. aviation reduction.Figure 4: Evolution of gross final energy consumption
                                                                  reduction.                                                                                                 Figure in
                                                                                                                                                                                    4: Evolution
                                                                                                                                                                                                Figure 4: Evolution of gross final energy
                                                                                                                                                                                                 of gross
                                                                                                                                                                                       the additional     finalefficiency
                                                                                                                                                                                                      energy    energy consumption     in aviation
                                                                                                                                                                                                                          scenario, incl. the additional ener
                                                                                                                                                                                                                                                   reduction.
                                                                consumption in the reference scenario,                                                                                          consumption in the additional energy
                                                                incl. aviation reduction.                                                                                                       efficiency scenario, incl. aviation
                                                                                                                                                                                                reduction.
                                                                                                                                                  Share renewable energy from biomass in
                                                                                                                                                   total national energy consumption (%)

argets NREAP % renewable Targets
                         energy NREAP % renewable energy                                                                                                                                   Targets NREAP % renewable Targets
                                                                                                                                                                                                                     energy from
                                                                                                                                                                                                                             NREAP
                                                                                                                                                                                                                                 biomass
                                                                                                                                                                                                                                   % renewable energy
                  national energy consumption (%)

        (reference scenario + av. red.)                                                          (reference scenario + av. red.)                                                                               (reference scenario + av. red.)                            (reference scenario + av. red
                   Share renewable energy in total

                                                               20
                                                                                                                                                                                           12                                                                12
                                                               18
                                                               16                                                                                                                          10                                                                10
                                                               14
                                                               12                                                                                                                            8                                                                8

                                                               10
                                                                                                                                                                                             6                                                                6
                                                                8
                                                                6                                                                                                                            4                                                                4
                                                                4
                                                                                                                                                                                             2                                                                2
                                                                2
                                                                0                                                                                                                            0                                                                0
005              2010                                          2015   20052020                            2010          2015       2020                                                                 2005          2010                                   2015   20052020     2010          2015

                                             Year                                                                Year                                                                                                                 Year                                              Year

on of the share renewable energy
                              Figure
                                 in gross
                                     5: Evolution
                                          final energy
                                                  of the        Figure 5: Evolution of the share renewable
                                                       consumption
                                                         share renewable
                                                                    (ref., incl.
                                                                           energyav.red.).
                                                                                    in gross final energy consumption (ref., incl. av.red.).
                                                                                                                                     Figure 6: Evolution of the share of renewable energy
                                                                                                                                                                                    Figurefrom  Figure 6: Evolution of the share of
                                                                                                                                                                                           6: Evolution
                                                                                                                                                                                                biomassof
                                                                                                                                                                                                        inthe
                                                                                                                                                                                                           gross
                                                                                                                                                                                                              share
                                                                                                                                                                                                                 finalofenergy
                                                                                                                                                                                                                         renewable
                                                                                                                                                                                                                               consumption
                                                                                                                                                                                                                                   energy from
                                                                                                                                                                                                                                            (ref.,biomass
                                                                                                                                                                                                                                                   incl. av. ir
                                                                energy in gross final energy consumption                                                                                        renewable energy from biomass in
                                                                (ref., incl. av.red.).                                                                                                          gross final energy consumption
                                                                                                                                                                                                (ref., incl. av. red.).
                                                                                                                               Total national energy consumption
                                                                                                                   (additional energy efficiency scenario + aviation reduction)
                                                                                                          125
                                                                                                          120
                                                                                                                                                                                                                         Belgium
                                                                       amount of energy in 2005 (=100%)
                                                                       Amount of energy (%) against the

                                                                                                          115

                                                                                                          110                                                                                                            Germany
                                                                                                          105
                                                                                                                                                                                                                         Ireland
                                                                                                          100

hy of                                                                                                      95                                                                                                            Luxembourg
rg                                                                                                         90
ds                                                                                                         85                                                                                                            Netherlands
                                                                                                           80
gdom                                                                                                                    2005         2010        2015                                            2020                    United Kingdom

                                                                                                                                              Year
                                                                                                                                                                                                                                                                                        17
                                                                                                                                                                                                                                                                                        16
                                                                       Figure 4: Evolution of gross final energy consumption in the additional energy efficiency scenario, incl. aviation reduction.
2.1.2 Overview biomass targets divided in three categories: renewable electricity,
           renewable heating and cooling and renewable transport

     In the following figures for the three categories (electricity, heating & cooling and transport) an overview5 (for the
     six countries) is given of the evolution of the distribution of renewable energy coming from multiple inputs for the
     years 2005, 2010, 2015 and 2020. Again it can be concluded that biomass is expected to produce a large share of
     the renewable energy in the future. Next to the planned evolution the actual situation6 (where available) is given
     to compare.

                                                             Other renewables                                     Solid biomass                   Biodiesel

                                                             Biogas                                               Other biofuels

                                                             Liquid biomass + other biogenic                      Bioethanol

                                                     Belgium: planned distribution of multiple inputs for renewable energy
                                                                        in 2005, 2010, 2015 and 2020.

                                                         Renewable electricity              Renewable heating                      Renewable transport
                                                                                               and cooling
                                                    35                                35                                    35

                                                    30                                30                                    30
         Amount of energy (TWh)
                           Amount of energy (TWh)

                                                    25                                25                                    25

                                                    20                                20                                    20

                                                    15                                15                                    15

                                                    10                                10                                    10

                                                     5                                 5                                       5

                                                     0                                 0                                       0
                                                          2005   2010   2015   2020        2005   2010     2015    2020            2005   2010     2015   2020

                                                                   Year                                  Year                                    Year

     Figure 7: Planned distribution         for Belgium
                       Figure 7: Planned distribution           ofofmultiple
                                                      for Belgium   multiple inputs inputs    for energy
                                                                                     for renewable renewable         energy
                                                                                                          in 2005, 2010, 2015 andin  2005, 2010, 2015 and
                                                                                                                                  2020,
     2020, divided over divided
                          threeovercategories:           renewable electricity, renewable heating & cooling and renewable
                                       three categories: renewable electricity, renewable heating & cooling and renewable transport.

     transport.

     5
         Data are based on the data mainly coming from the NREAP according to: Beurskens et al. (2011).
     6
         These data are based on most recent available estimates delivered by the partners from the Arbor project.
19
18
Germany: planned distribution of multiple inputs for renewable energy
                                                                   in 2005, 2010, 2015 and 2020.

                                                  Renewable electricity                         Renewable heating                      Renewable transport
                                                                                                   and cooling
                                           250                                          250                                     250
Amount of energy (TWh)

                                           200                                          200                                     200
                  Amount of energy (TWh)

                                           150                                          150                                     150

                                           100                                          100                                     100

                                            50                                           50                                      50

                                             0                                            0                                       0
                                                  2005 2010 2015 2020 State                   2005 2010 2015 2020 State               2005 2010   2015 2020     State
                                                                     of the art                                  of the art                                   of the art
                                                                       2010                                        2010                                         2010
                                                              Year                                         Year                                     Year

   Figure 8: Planned distribution for Germany of multiple inputs for renewable energy in 2005, 2010, 2015
                            Figure 8: Planned distribution for Germany of multiple inputs for renewable energy in 2005, 2010, 2015 and 2020,
   anddivided
       2020,     divided
              over             overrenewable
                   three categories:   three electricity,
                                                categories:        renewable
                                                           renewable                 electricity,
                                                                     heating & cooling  and renewablerenewable           heating
                                                                                                       transport. Comparison          & cooling
                                                                                                                              with state-of-the-art    and
                                                                                                                                                    data from renewable
                                                                                                                                                              2010.
   transport. Comparison with state-of-the-art data from 2010.

                                                 Ireland: planned distribution of multiple inputs for renewable energy
                                                                    in 2005, 2010, 2015 and 2020.

                                                                                                 Renewable heating                      Renewable transport
                                                  Renewable electricity                             and cooling
                                            16                                           16                                     16

                                            14                                           14                                     14
Amount of energy (TWh)

                                            12                                           12                                     12
                  Amount of energy (TWh)

                                            10                                           10                                     10

                                             8                                            8                                      8

                                             6                                            6                                      6

                                             4                                            4                                      4

                                             2                                            2                                      2

                                             0                                            0                                      0
                                                  2005 2010    2015 2020     State            2005   2010 2015 2020 State             2005 2010   2015 2020       State
                                                                           of the art                              of the art                                   of the art
                                                                             2010                                    2010                                         2010
                                                              Year                                          Year                                     Year

   Figure 9: Planned distribution for Ireland of multiple inputs for renewable energy in 2005, 2010, 2015 and
                             Figure 9: Planned distribution for Ireland of multiple inputs for renewable energy in 2005, 2010, 2015 and 2020,
   2020,   divided
      divided over three over    three
                         categories:       categories:
                                     renewable                 renewable
                                               electricity, renewable              electricity,
                                                                       heating & cooling             renewable
                                                                                          and renewable                heating
                                                                                                         transport. Comparison       & coolingdata
                                                                                                                                with state-of-the-art and  renewable
                                                                                                                                                        from 2010.
   transport. Comparison with state-of-the-art data from 2010.

                                                                                                                                                                             19
                                                                                                                                                                             18
Luxembourg: planned distribution of multiple inputs for renewable energy
                                                                      in 2005, 2010, 2015 and 2020.

                                                          Renewable electricity                             Renewable heating                       Renewable transport
                                                                                                               and cooling

                                                    3,0                                         3,0                                          3,0
       Amount of energy (TWh)

                                                    2,5                                         2,5                                          2,5
                          Amount of energy (TWh)

                                                    2,0                                         2,0                                          2,0

                                                    1,5                                         1,5                                          1,5

                                                    1,0                                         1,0                                          1,0

                                                    0,5                                         0,5                                          0,5

                                                    0,0                                         0,0                                          0,0
                                                          2005 2010    2015 2020     State                2005   2010 2015 2020 State              2005 2010     2015 2020     State
                                                                                   of the art                                  of the art                                    of the art
                                                                                     2005                                        2005                                          2005
                                                                      Year                                              Year                                       Year

     Figure 10: Planned distribution for Luxembourg of multiple inputs for renewable energy in 2005, 2010,
      Figure 10: Planned distribution for Luxembourg of multiple inputs for renewable energy in 2005, 2010, 2015 and 2020, divided over three categories: renewable electricity,
     2015 and 2020, divided                    over
                                        renewable      three
                                                  heating        categories:
                                                          & cooling                 renewable
                                                                    and renewable transport. Comparisonelectricity,      renewable
                                                                                                         with state-of-the-art              heating & cooling and
                                                                                                                               data from 2005.
     renewable transport. Comparison with state-of-the-art data from 2005.

                                           the Netherlands: planned distribution of multiple inputs for renewable energy
                                                                 in 2005, 2010, 2015 and 2020.

                                                          Renewable electricity                              Renewable heating                     Renewable transport
                                                                                                                and cooling

                                                    60                                           60                                           60
       Amount of energy (TWh)

                                                    50                                           50                                           50
                          Amount of energy (TWh)

                                                    40                                           40                                           40

                                                    30                                           30                                           30

                                                    20                                           20                                           20

                                                    10                                           10                                           10

                                                      0                                               0                                        0
                                                          2005 2010    2015 2020     State                2005    2010 2015 2020 State             2005   2010   2015   2020     State
                                                                                   of the art                                   of the art                                     of the art
                                                                                     2010                                         2010                                           2010
                                                                      Year                                               Year                                      Year

     Figure 11: Planned distribution for the Netherlands of multiple inputs for renewable energy in 2005, 2010, 2015 and 2020, divided over three categories: renewable electricity,
     Figure 11: Planned distribution for the Netherlands of multiple inputs for renewable energy in 2005, 2010,
                                         renewable heating & cooling and renewable transport. Comparison with state-of-the-art data from 2010.
     2015 and 2020, divided over three categories: renewable electricity, renewable heating & cooling and
     renewable transport. Comparison with state-of-the-art data from 2010.

21
20
United Kingdom: planned distribution of multiple inputs for renewable energy
                                                in 2005, 2010, 2015 and 2020.

                                                       Renewable electricity                         Renewable heating                     Renewable transport
                                                                                                        and cooling
                                                 140                                         140                                     140
  Amount of energy (TWh)

                                                 120                                         120                                     120

                                                 100                                         100                                     100
                      Amount of energy (TWh)

                                                  80                                          80                                      80

                                                  60                                          60                                      60

                                                  40                                          40                                      40

                                                  20                                          20                                      20

                                                   0                                           0                                       0
                                                       2005 2010    2015 2020     State            2005   2010 2015 2020 State             2005   2010   2015   2020     State
                                                                                of the art                              of the art                                     of the art
                                                                                  2009                                    2009                                           2009
                                                                   Year                                          Year                                      Year

Figure 12: Planned distribution for the United Kingdom of multiple inputs for renewable energy in 2005,
      Figure 12: Planned distribution for the United Kingdom of multiple inputs for renewable energy in 2005, 2010, 2015 and 2020, divided over three categories:
2010, 2015 andrenewable2020,electricity,
                                 divided        overheating
                                            renewable   three    categories:
                                                             & cooling  and renewablerenewable         electricity,
                                                                                        transport. Comparison            renewable
                                                                                                              with state-of-the-art         heating
                                                                                                                                    data from 2009.      & cooling
and renewable transport. Comparison with state-of-the-art data from 2009.

                                               Biomass is expected to produce a large share
                                               of the renewable energy in the future.

                                                                                                                                                                                    21
                                                                                                                                                                                    20
2.2. Local available biomass today and in the future 7

     Table 5: Domestic resource in 2006 (ktoe)

                               Belgium       Germany        Ireland       Luxembourg           the Netherlands           United Kingdom

         Woody                    455          9 425          NA                 34                    640                       557
         biomass

         Agriculture              92           5 566          NA                 10                    450                       412
         and fisheries

         Waste                    260           743            NA                16                   1 348                     2 011

     Table 6: Domestic resource in 2009 (ktoe)

                               Belgium Germany 8            Ireland       Luxembourg           the Netherlands           United Kingdom

         Woody                    NA           9 425          149               NA                     828                      1 087
         biomass

         Agriculture              NA           5 566          NA                NA                     NA                        476
         and fisheries

         Waste                    NA            743            60               NA                    1 157                     4 029

     Table 7: Domestic resource in 2010 (ktoe)

                               Belgium       Germany        Ireland       Luxembourg           the Netherlands           United Kingdom

         Woody                    NA           9 425          159               NA                     808                      1 224
         biomass

         Agriculture              NA           5 566          NA                NA                     NA                        439
         and fisheries

         Waste                    NA            743            64               NA                    1 168                     4 139

     7
       References: • Beurskens, 2011
     		             • Progress report Ireland, the Netherlands & the UK, 2012
     		             • Bundesrepublik Deutschland, 2012
     8
       In the progress report for 2009-2010 of the NREAP for Germany it is mentioned that there has been no substantial change to the availability
     of biomass in Germany in 2009 and 2010 in comparison to the detailed information provided in the NREAP for 2006.
23
22
Table 8: Expected amount of domestic resource in 2015 (ktoe)

                        Belgium       Germany          Ireland   Luxembourg   the Netherlands   United Kingdom

  Woody                    738         12 237           NA           59            370              1 063
  biomass

  Agriculture              198           NA             NA           45           4 414             1 874
  and fisheries

  Waste                    336          1 440           NA           25           2 155             9 055

* Best possible scenario and worst possible scenario

Table 9: Expected amount of domestic resource in 2020 (ktoe)

                        Belgium Germany 8              Ireland   Luxembourg   the Netherlands   United Kingdom

  Woody                    869         11 985           NA           85            573              1 567
  biomass

  Agriculture              443           NA             NA           72           7 787             6 967
  and fisheries

  Waste                    452          1391            NA           29           2 615             12 945

    Summary

    In 2006 Germany possessed the largest amount of domestic resources of woody biomass, as well as
    biomass from agriculture and fisheries. The UK possessed the largest domestic resource of biomass
    coming from waste.

    Other trends that catch the eye are the very large increases expected for biomass from agriculture and
    fisheries in Belgium, Luxembourg, the Netherlands and the UK, mainly between 2006 and 2015. Also for
    waste a large increase is expected in the UK (2006-2015). In Germany a slight decrease of woody biomass
    and biomass from waste after 2015 is expected.

For the Netherlands figures are very variable: a huge, almost impossible, increase of biomass from agriculture and
fisheries is expected, whilst woody biomass is expected to decrease with 40% between 2006 and 2015. This trend
is not coherent with available data for 2009 and 2010.

                                                                                                                     23
                                                                                                                     22
Table 10: Land used in 2006-2009-2010 for low impact energy crops

                                    Land for short rotation coppice (ha)        Land for other energy crops (ha)
                                                                                (reed canary grass, switch grass,
                                                                                Miscanthus, sorghum, ... )

        		                            2006           2009          2010           2006            2009              2010

        Belgium                         0             NA            NA              0             NA                 NA
        Germany                       1 200          2 300         3 600         1 100           1 800              2 100
        Ireland                         63            360           548            617           2 101              2 266
        Luxembourg                       0            NA            NA              0             NA                 NA
        the Netherlands                  0             12            8           10 000           NA                 NA
        United Kingdom                4 196           NA            NA            5 316           NA                 NA

     2.2.1 Developments after 2006-2007

     Germany:

     The Progress report from Germany states that there has been no substantial change to the availability of biomass
     in Germany in 2009 and 2010 in comparison to the NREAP for 2006 and 2007. There has been an increase in area
     under cultivation for biogas substrates, in particular maize. Well over a quarter of the area planted with maize is
     used for energy in Germany at the present time.

     Ireland:

     The largest single stream, forest based biomass, although increasing in absolute terms, remained at a consistent
     45% of total biomass for bioenergy over the period 2008-2010. The contribution from liquid biofuels has increased
     from 20% of total biomass in 2008 to 26% in 2010.

     the Netherlands:

     Most biomass for electricity generation and heating comes from waste from the Dutch domestic market. In
     addition, a great deal of waste wood is made available for energy purposes, for use both in the Netherlands and in
     other EU States. Another important stream is the importation of wood pellets for co-incineration in power stations.
     A large proportion of these comes from North America.
     For 2009 and 2010, no data are available on the origin and nature of raw materials for the production of biofuels
     for transport.

     UK:

     The single largest feedstock for renewable energy in UK transport in 2009 and 2010 was soy with 1 120 and 907 ktoe
     supplied, respectively. This was all imported from outside the EU. Sugar cane, primarily from Brazil also contributed
     a significant proportion of the energy. Oilseed rape is the largest EU feedstock with over 200 ktoe supplied in
     each year. The largest UK feedstock was sugar beet with 92 and 129 ktoe supplied in 2009 and 2010, respectively.
     There was a significant increase in the amount of used cooking oil (UCO) reported from all sources in 2010 reflecting
     the removal of the duty differential for all biofuels except those derived from UCO in April that year.

25
24
2.3. Share of local biomass & share of imported biomass9

In the NREAP there is little information available on the share of imported biomass today and in the future. That is
why in this chapter we make some assumptions for the future, deducted from 2.1. and 2.2.

From 2.1. it can be concluded that all 6 partners expect a serious increase between 2005 and 2020 in renewable
electricity, renewable heating and cooling and renewable transport. Mainly for renewable heating and cooling and
renewable transport a large share will be bioenergy. Biomass resources will thus have to increase, in combination
with the increase in energy efficiency.

In Germany domestic resources more or less seem to stagnate after 2015. From the statistics in 2.1. we can deduce
that they expect a small increase in bioenergy in this period. Time will tell how much import will be necessary to
meet these targets.

In the Netherlands, Belgium, Luxembourg and the UK large increases in domestic biomass are expected between
2006-2020. In the near future it will become clear if this increase will be enough to reach the expected bioenergy
targets. Because of the fact that Ireland, Luxembourg and Belgium are relatively small countries, it seems inevitable
that they will have to import quite a large share of biomass.

The expectations for 2020 in the NREAP and the information provided by the project partners more or less matches
these conclusions:

    • Belgium: Currently 1/3rd of biomass is being imported. The quantity of biomass which will have to be imported
      in 2020 is estimated at 3100 ktoe. The question of possible import countries depends on developments on the
      international biomass market. Belgium currently imports wood pellets from Canada, United States, Germany, the
      Netherlands, Portugal, Estonia, Latvia, Lithuania and South Africa.

    • Germany: gap of 9 500 ktoe between domestic supply and demand, however this will primarily be mobilised
      domestically by e.g. energy yield increases and increased energy use of forest wood. A “timber gap” however is
      expected. Also the import of biomethane over the gas grid might be realistic if policy and market situation will
      be adapted.

    • Ireland: two scenarios are presented. The first one estimates that imported biomass will account for about 350
      ktoe of total required biomass supply of 1 100 ktoe or 32%. The second one estimates that imported biomass will
      account for 510 ktoe of the total required biomass supply of 1 260 ktoe or 40%. The imported biomass is foreseen
      as coming from Canada (wood biomass), USA (wood biomass), Brazil (biofuels) and Russia (wood biomass).

    • Luxembourg: imports of biomass, in particular in the category ‘indirect supply of wood biomass for energy
      generation’ are expected to reach 45 ktoe by 2020. A large share of the renewable energy targets will be
      obtained by biofuel imports. Also around 35% of woody biomass for burning will have to be imported.

    • the Netherlands: the expected required biomass is approximately 8 Mtoe in 2020. In the Netherlands -depending
      on the scenario - approximately 5 Mtoe will be available for energy applications in 2020. Sectors which will al-
      most certainly have to import large amounts of biomass are combined burning in coal-fired power stations and
      biofuels for transport.

    • UK: at present the UK imports the majority of its biofuels, this may change over the decade as there are currently
      large ethanol refineries under construction in the UK. The UK also expects to have sufficient biomass resource
      potential to meet the demand for heat and power.

9
    NREAP, 2011
                                                                                                                           25
                                                                                                                           24
Chapter 3 - Overview of the different National
     Renewable Energy Action Plans and
     National Biomass Action Plans

27
26
3.1. NREAP10
In this chapter we will focus on the content of the different NREAP’s and make a comparison between different
strategies proposed by the member states. As ARBOR only deals with bioenergy aspects, strategies concerning
other renewables such as wind and geothermal energy will not be mentioned here. The main aim of this chapter
is to compare the different measures taken by the member states to increase their biomass availability and what
impact these measures may have on other sectors.

All the NREAPs were released in 2010.

3.1.1 NREAP targets

The different renewable energy and bioenergy targets mentioned in the NREAPs won’t be stated here as they are
fully in line with the targets from the EU directive 2009/28/EC that are mentioned in table 1 in chapter 1.

3.1.2 Mobilisation of new biomass sources

3.1.2.1 Perennial energy crops on degraded land and unused arable land

The amount of degraded land that is available for energy purposes:

• Belgium, United Kingdom, Luxembourg, the Netherlands, Ireland: no noteworthy amount mentioned in
  the NREAP, although in the ARBOR project special attention is given to SRC on industrial sites in Belgium and
  perennial energy crops on set aside lands in the Netherlands
• Germany: partly sealed, undeveloped brownfield and urban recycling areas that could be available for biomass
  production

The amount of unused arable land, available for energy purposes:

•      Belgium: 2 600 ha in the Flemish Region (2009), 12 319 ha in the Walloon Region (2008)
•      Ireland: 3 589 ha
•      the Netherlands, Germany and Luxembourg: no significant reserves of unused arable land
•      United Kingdom: 255 000 ha

Support measures for the establishment of perennial energy crops:

• Belgium: demonstration projects on SRC and phyto-remediation of degraded land
• Ireland: Bioenergy Scheme (establishment grants to farmers for up to 50% of the costs associated with
  establishing Miscanthus and willow) & Afforestation Grant Schemes (The scheme is open to farmers and non-
  farmers. Forests established under this scheme must meet full silvicultural standards and must be managed as
  a commercial crop for the realisation of a profit, 75% of the costs associated with the establishment of a forest)
• the Netherlands, Luxembourg, Germany: no support measures for energy crops on degraded land or unused
  arable land
• United Kingdom: grant rate is 50% of the actual establishment costs (2007-2013 Rural Development
  Programme for England’s Energy Crops Scheme)

       Summary

       The NREAP states that perennial energy crops can be grown on degraded land or unused arable land.
       Germany is the only partner where degraded land is available and the UK is the only one with a significant
       amount of unused arable land. It is clear that the UK and Ireland put most effort into promoting the
       establishment of perennial energy crops through grants.

10
     NREAP, 2011
                                                                                                                       27
                                                                                                                       26
3.1.2.2 Energy use of available primary material

     How will the available primary material be used:

     • Belgium: focus on improved collection of waste flows, usage for anaerobic digestion (AD), together with
       manure and compost, through support for investments and green certificates

     • Germany: former priority on accelerating biogas production from energy crops is still existent but with
       restrictions on mass percentage (maize max. 60%) and changes in tariffs. Focus on small scale manure digestion.
       Current policy headlines the fermentation of organic residues such as municipal organic waste or other organic
       residues that currently are not valorised, e.g. landscape material, flower stripes, straw, horse-cow-pig manure,
       clover, etc (Personal communication, Weiler K., Izes).

     • Ireland: focus on anaerobic digestion CHP through a number of capital grant aid schemes + a special tariff
       for AD to make use of animal manure and other wastes from secondary processing of agricultural products.
       Also focus on biomass co-fired with peat and use of wood coming from forests in heating through a number
       of capital grant aid schemes and a tariff to support the use of materials from the forestry sector (thinning and
       waste from sawmills)

     • Luxembourg: energy wood, old and scrap wood, manure, biogenic organic residue and sludge are the
       available primary materials already being used for energy, focus on the improvement and suitability of the
       current incentives (investment and feed-in tariffs) for the collection of organic waste as well as use of old and
       scrap wood

     • the Netherlands: focus on facilitating manure fermentation through financial support and by improving
       the legislative framework for the use of digestate as fertilizer and mineral concentrates as inorganic fertilizer
       substitutes

        UK: focus on anaerobic digestion of manure and slurry through financial incentive mechanisms for renewable
        energy, capital grant schemes, advice workshops for farmers and online advice services

        Summary

        All partners agree on the importance of AD for the energy use of their available primary material and would
        like to focus on manure as input material for AD. Ireland, Belgium and Luxembourg stress the importance
        of an improved collection of waste flows. Germany also considers crop residues as an important source
        for AD. Ireland is the only partner mentioning co-firing with peat and the exploitation of forests.

     3.1.2.3 Policies promoting the production and use of biogas

     Specific measures for biogas:

     • Germany
       • Gas Grid Access Ordinance: facilitate feed-in of 6 billion m³ per year by 2020 and 10 billion m³ per year
          by 2030
       • Integration of biogas plants in micro-grids
       • Energy concept 2050: targets for higher use of biomethane in transport sector
       • Biogas feed-in tariff law (see pg. 48)

     • Luxembourg
       • “Reglement grand-ducal” on the promotion and the development of the biogas production and the
          injection of the biogas into the natural gas grid

29
28
• United Kingdom
  • AD Implementation Plan: actions to increase the production of biogas (published 25th of March 2010),
     http: //archive.defra.gov.uk/environment/waste/ad/implementation-plan.htm
  • Government’s Coalition Agreement: the Government committed to ‘a huge increase in waste to energy
     through anaerobic digestion’
  • AD Demonstration Program: five projects will be built to demonstrate the ‘state of the art’ of AD
     (£ 10 million)
  • Quality protocol for production and use of digestate. The Anaerobic Digestate Quality Protocol was
     published in England and Wales in 2009. In July 2010 it was updated to enable use in Northern Ireland.
     Contains end-of-waste-criteria for digestate.
  • Feasibility study on the use of biogas in local transport (dating from 2006):
     http: //www.environmental-protection.org.uk/assets/library/documents/biogas_as_transport_fuel_june06.pdf

• Others
  • No specific measures for biogas

   Summary

   The United Kingdom, Luxembourg and Germany are the only partners with clear biogas promoting
   policies.

3.1.2.4 Planned measures to improve forest management techniques in order to maximise the extraction
of biomass in a sustainable way

• Belgium
  • Limited additional energetic potential of domestic forests

   Germany
   • Performance bonus for the independent industry-wide marketing of wood supply through a forestry
      association

• Ireland
  • Tools that show the location and size of forest biomass resources available from privately owned forests
      over a period till 2029
  • Programme for wood energy research that aims to investigate forest management techniques that
      maximise the level of sustainable biomass production
  • Funding to encourage private forest owners to work collectively in the marketing of forest products
  • Roading grants to assist the early thinning of plantations

• Luxembourg
  • The forest mobilisation, especially of private forests, is planned with a focus on the efficient management,
     e.g. management plans, reforestation, maintenance of younger plants, replacement of coniferous forests,
     and on the improvement and development of the forest infrastructure
  • In general, sustainability criteria apply for each type of forestation (Programme forestier national)

• the Netherlands
  • Clean & Efficient Work Programme: tasks set out for forestry sector
      • Promote more intensive landscape management
      • Conclude multi-annual agreements with energy companies for a constant take-up of biomass from
  		 the forestry sector

• United Kingdom
  • Forestry apprenticeship scheme to improve skills
  • Felling licences
  • Biomass Energy Centre (http: //www.biomassenergycentre.org.uk)
  • Forestry Standard: UK’s requirements for sustainable forest management is being revised
  • Roading grants to assist the early thinning of plantations
                                                                                                                   29
                                                                                                                   28
Summary

        The United Kingdom and Ireland have the most support mechanisms to maximise extraction of biomass
        through the improvement of forest management in place. Both aspire to do this through research,
        education and funding. Both Germany and the Netherlands will try to promote marketing of wood
        supply and a constant take-up of biomass from the forestry sector. Luxembourg will try to increase the
        sustainable extraction from private forests by improving forest infrastructure. In Belgium there is no
        significant potential for extraction of biomass from domestic forests.

     3.1.3 Impact on other sectors

     3.1.3.1 Monitoring of the impact of energy use of biomass on other sectors

     • Belgium
       • No green electricity certificates for flows that are reserved for industrial application or for recycling

     • Germany
       • Keeps track of number of biomass plants and capacities
       • Assesses import and export of relevant material flows

     • Ireland
       • Monitors the effect of feed-in tariffs on prices for raw material

     • Luxembourg
       • Preparation of analysis of the interactions between the different uses of biomass and area

     • the Netherlands
       • Yearly update of the prices for agricultural products for the last 10 years to analyse the impact of the
           promotion of bioenergy
       • Green Feedstock Platform to promote biomass in various sectors in the most balanced way possible

     • United Kingdom
       • Statistics on the area of non-food crops and roundwood and sawmill product deliveries to wood
          processing sectors, to wood fuel and to export
       • Focus on bioenergy supplies from purpose-grown energy crops and non-wood waste material to reduce
          the competition for wood feedstocks

     3.1.3.2 Expected development in other sectors that could have an impact on the energy use of biomass

     • Belgium
       • Improved use of residual flows
       • Improved use of wood residues from road shoulders, parks, nature reserves and gardens

     • Germany
       • Increased global food and feed demand > increased land use competition
       • Conservation targets for preservation of landscapes and habitats > restricted forest biomass use
       • Result: other potentials: forest wood residues, residues from landscape management, organic
          waste + integrated approach to energy and material use (cascade)

     • Ireland
       • Concentration of livestock produce > availability of animal wastes
       • Higher landfill levies > increased supply of waste
       • Wood production will grow by 80% by 2029 > significant proportion used for energy

     • Luxembourg
       • No developments mentioned in the NREAP

31
30
• the Netherlands
  • Revision of CAP may impact manure availability in the Netherlands. The emerging biorefinery business is
      not yet expected to impact biomass availability.

• United Kingdom
  • Increased yields of existing energy crops
  • Development of new energy crops

        Summary

        Germany expects an increasing global food & feed demand and increasing conservation targets. Both
        will lead to a decrease in biomass availability. That is why Germany suggests an increasing use of wood
        residues and landscape material and also Belgium stresses the importance of these two streams. In the
        UK much is expected from new and existing energy crops and Ireland expects an increasing availability
        of wastes and a big growth of wood production. The Netherlands mention the revision of the Common
        Agricultural Policy. For Luxembourg no significant developments that could have an impact on the
        energy use of biomass are mentioned.

3.1.3.3 Recent developments 11

• Germany
  Timber prices have risen in recent years due to strong demand. This strong demand follows from an improved
  economic situation and an increasing demand for wood for energy. Stronger competition internationally is
  also expected in the future for solid fuels.
  The influence of bioenergy use in Germany on international trade prices for cereals is estimated as being
  extremely low. The growth of biogas plants has led to increased rental prices for arable land in certain regions
  of Germany.

• Ireland
  In 2009 and 2010 biomass feedstocks had no detectable influence on commodity prices or land-use.

• the Netherlands
  In the case of woody biomass, there is no indication that demand from energy applications in 2009-2010 has
  led to changes in commodity prices. The price for energy maize however has risen about 25% over the last
  6 years. The increase in the use of maize for fermenting has not led to an increase in the area of maize or a
  change in land use.

• United Kingdom
  Although the demand for biofuels has risen dramatically over recent years, in the UK it will have had a very
  limited impact on food prices. Biofuels still represent a very small proportion of total agricultural commodity
  usage within the UK, and furthermore, the prices of agricultural commodities are largely set at a global level.

11
     Progress reports of Ireland, the Netherlands, the UK (2012) & Bundesrepublik Deutschland (2012).
                                                                                                                     31
                                                                                                                     30
You can also read