The Avengers Assemble: Forecasting and Business Intelligence Team Up to Ease Daily Revenue Management
←
→
Page content transcription
If your browser does not render page correctly, please read the page content below
Paper SA19-2012
The Avengers Assemble: Forecasting and Business Intelligence Team Up
to Ease Daily Revenue Management
Patrick M. Kelly, BlueCross BlueShield of Tennessee, Chattanooga, TN
Betsy Enstrom, IDeaS-A SAS Company, Bloomington, MN
ABSTRACT
An egregious amount of process automation and business intelligence is needed in forecasting and revenue
management. With the scale of large data and forecasting needs constantly increasing, combining insightful
data manipulations, business intelligence techniques, and the illustrious SAS High Performance Forecasting
is a necessity. They provide an innovative process for both aptitude and forecasting in revenue
management as it pertains to the hospitality industry. An experienced SAS programmer with access to the
HPF procedure will find this paper useful to illustrate how to build an insightful and sophisticated daily
strategy report complete with forecasts and well organized, pertinent daily metrics.
INTRODUCTION
Accurate forecasting requires large amounts of current, highly formatted, and normalized data. All of this
data does not just appear via the data fairy. In today’s business environments, data proliferates faster than
rabbits. Data does not just grow in centralized enterprise data warehouses, but also through smaller
specialized data marts and employees private process data; data grows in a data urban sprawl.
An analyst armed with modern Business intelligence techniques and SAS’s High Performance Forecasting
can sort through the deluge of data to design and insightful report that can assist in forecasting.
EXAMPLE
An experienced SAS programmer has many tools at his disposal to generate a coherent picture for his
customer. Consider PB&S Avengers Mansion, located in Manhattan, a 150 unit property needing reports
such as Daily forecasts that include daily metrics, competitor daily rates, Daily pick-up information on solds
and revenue, and possible other KPIs.
Forecasting and revenue management rely heavily on pertinent, time-based data. As the popularity of the
PB&J Avengers Mansion the greater their data expands, the more that they will need to rely on process
automation and exceptional business intelligence techniques to assemble insightful data manipulations,
Business Intelligence techniques, SAS High Performance Forecasting. Assemble all of this together and
they provide an innovative process for both aptitude and forecasting in revenue management as it pertains
to the hospitality industry.
Automaton is a necessity rather than manually extracting the data daily and assembling a report. Taking
advantage of SAS software and modern enterprise tools and automates the entire process from data
extraction, data processing, forecasting, and report building. The harnessing of modern business intelligence
techniques to focus on organizing key metrics is imperative rather than aimlessly searching and analyzing
data files individually. This enables the analyst to focus more on the complex forecasting and revenue
management metrics and deeper insight into the business.
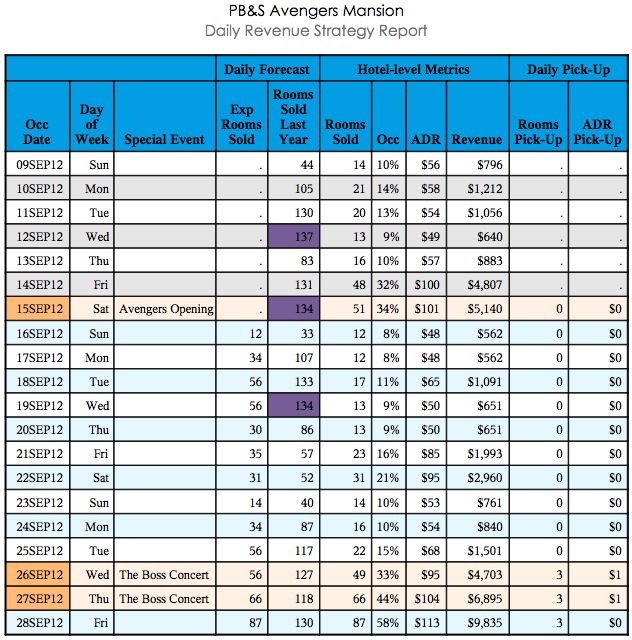
In Figure 1 and Figure 2 report examples of Avengers Mansion, you see at a daily strategy problem for a
property in the Hero Hospitality industry. It is clear that the multiple sources of data, daily data
manipulations, and forecasting would be an overwhelming manual task to a revenue manager. The revenue
manager’s finite resources are better spent monitoring the property’s competitive position, managing the
property’s channel distribution process, and guiding the property’s revenue generating process.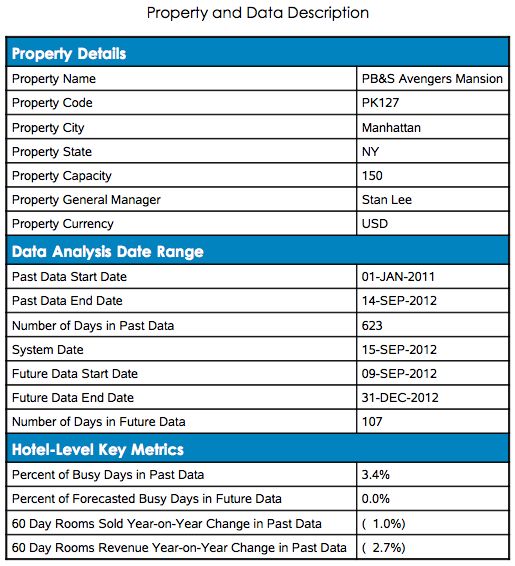
Figure
  1:
  Property
  and
  Data
  Description


Figure
  2:
  Daily
  Revenue
  Strategy
  Report
BUILDING THE REPORT


The hospitality industry, like many industries, is heavily dependent on time sensitive data. The daily report
for Avengers Mansion is dependent on today’s date. Today’s date, determined from the TODAY function in
SAS, drives input and output file names as well as determines both the analysis and comparison periods.


           data _null_;
            call symputx(’mtoday’, today());
           run;


In order to make this an automated daily report, file names need to be date centric both for the input and
output. This is accomplished by date macro variables and the INTNX function. The INTNX function
increments a date value by a given time interval, and returns a date value. To allow users to easily re-run
report for a previous date the mdate and mdatey date macro variables are dependent on the mtoday
rather than TODAY function.

           call symputx(’mdate’, put(&mtoday, mmddyy4.))
           call symputx(’mdatey’, put(&mtoday-1, mmddyy4.))

The mdate and mdatey date macro variables are used for import of today and yesterday’s raw data file,
respectively. The mdate macro variable is also used to name the output file so the Daily Strategy Reports
do not get overwritten.


After your daily strategy report runs without fail, you might want to also allow for special reports, changed
formatting, and special weekly reports say in another export format. For the additional report requirements,
the analyst takes advantage of the SAS WEEKDAY function, WEEKDAY returns an integer that corresponds
to the day of the week.


           call symputx(’mdow’,weekday(&mtoday))

To assist the revenue manager you can have your report have a daily export to PDF and weekly export to
Excel for manual input and manipulations.

The sample Daily Strategy Report covers roughly three months of data centered on the mtoday macro
variable. The reports take advantage of INTNX function with the BEGINNING and END option for the start
and end date, respectively. The mstart and mend date macro variables are dependent on mtoday, as
discussed earlier.

           mstart = intnx(’week’, &mtoday, 0, ’beginning’)
           mend   = intnx(’month’, &mtoday, 3, ’end’)
           call symputx(’mstart’, mstart)
           call symputx(’mend’,   mend)

For the forecasting, establish the number of days (mlead) that the HPF procedure will forecast, with the
LEAD option on the PROC statement. For this report, determine the number of days to forecast relative to
the end of the analysis period and today, macro variables mend and mtoday.

           call symputx(’mlead’, mend - &mtoday)

LOADING THE DATA


The Avengers Mansion, and as in many situations, data is sprawled about and needs to be brought to a
central location. In this example, there are four input data sets required for the Daily Strategy Report:
yesterday and today’s raw data export from property (CSV), a special event file created by revenue manager
(XLSX), and a general property information file (XLSX). In many situations, you may even be hitting
enterprise data warehouses housed on-site or off-site. The Avenges Mansion provides their daily raw data
exports which are daily sales information for roughly two years centered around today’s date. Yesterday’s
information is needed in order to calculate a daily pick-up, the difference in today and yesterday’s rooms
sold and revenue.
Special events around a property can impact forecasts. As you can imagine, Thor loves to have the gang
together and in town to rock out to The Boss in concert. Marking and labeling a day as a special event will
notify the revenue manager the day could be particularly busy, slow, or simply not reflective of past trends.
How else would Stan Lee going to plan for Thor and the gang want to be in town to catch The Boss’s special
two night show at the Radio City Music Hall? The revenue manager (RM) or consultant creates a file to store
special events. To identify The Boss concert in town, they need to identify the start date, end date, and an
event name. To expand the special event data to later align and merge by occupancy date with a DO loop in
a DATA step with the use of the OUTPUT statement
data selist2 (drop = StartDate EndDate);
set SEList (where = (prop = "&prop"));
do occupancy_date = StartDate to EndDate;
output;
end;
run;
It is important to identify if the occupancy date was special event last year as well. Subset the special event
data by last year’s start and end date, macro variables mstartLY and mendLY, respectively. Next, use the
INTNX function DOW aligns last year occupancy dates
data SElist2LY;
set SEList2 (keep = occupancy_date ShortName);
where occupancy_date >= &mstartLY and
occupancy_Daterun;
After the data has been summarized to occupancy date, the Daily Strategy Report requires calculations of
daily metrics like ADR, revenue per available room (RevPAR), occupancy, and busy night indicators.
if Rooms_Sold not in (0,.)
then adr = Room_revenue/Rooms_Sold;
if (capacity - ooo) not in (0,.)
then RevPAR = Room_revenue/(capacity - ooo);
if capacity not in (0,.)
then Occupancy = rooms_sold/capacity;
if Occupancy >= 0.90
then busy = 1; else busy = 0;
Similarly, calculate the daily metrics for last year’s data for a year-on-year analysis.
Prior knowledge is a necessity, knowing that Loki will attempt to overthrow the universe helps the Avengers
know he will likely try again. The number of days in the past is important because past data is an input to the
HPF. The HPF procedure uses a historical time series to forecast the demand on future occupancy dates for
Avengers Mansion. For this example, roughly two years of history is used to forecast. To find the minimum
and maximum occupancy dates of the past data use the MEANS procedure.
nodays = occupancy_Date_Max - Occupancy_Date_Min + 1;
call symputx(’mnd_p’, nodays);
To establish accurate forecasts, the number of busy days in the past is important because busy days, days
with greater than 90% occupancy, have a lower forecasting error. To flag these events in the data we create
an indicator variable named busy for each occupancy date where 1 = Busy and 0 = Non-Busy, and use the
MEANS procedure to find the percent of busy days in the past data
call symputx(’mnb’, max(0,busy_sum/nodays));
THE MAIN COURSE
Now, with the laborious task of daily data preparation complete, it is time to unleash the HPF procedure to
forecast the daily rooms sold, as The Hulk flexes his gamma-radiated mussels, and gain insight to the
Mansions’ data.
proc hpf data = hotel2 lead = &mlead
outfor = hpfCI;
where occupancy_date < &mtoday;
id occupancy_date interval = day;
forecast Rooms_Sold;
run;
As established earlier, the LEAD option on the PROC statement with the mlead macro variable tells the
HPF procedure how far out to forecast the Mansions’ occupancy. The OUTFOR option on the PROC
statement saves the forecast, confidence limit, and actual rooms sold to output data set to be used in Daily
Strategy Report. The ID statement tells the HPF procedure what level of granularity to forecast. The
FORECAST statement tells the HPF procedure which variable to predict.
MERGE, INPUT, AND CALCULATE FINAL METRICS
We have set the stage for the final show down and the turn. We assemble and merge all six input data sets
that include:
hotel2 -‐
Hotel-level solds and revenue information
selist2 -‐
Special event data for this year
selist2LY -‐
Special event data for last year
hotel2Y -‐
Yesterday’s hotel-level solds and revenue information
hotel2LY -‐
Last year’s hotel-level solds and revenue information
hpfci -‐
The HPF procedure’s daily rooms sold forecast
As assembling Avengers, you need to calculate rooms sold and ADR pick-up as the difference in today and
yesterday’s rooms sold and ADR, respectively.
room_pu = Rooms_Sold - yrs; adr_pu = adr - yadr;
To ease confusion with the report reader, add some logic to add clarity. If the hotel has more rooms on-
books than the HPF procedure forecasted, replace the forecasted value with actual rooms sold.
predict = max(predict, rooms_sold);
If the hotel has fewer rooms in its capacity than the HPF procedure forecasted, replace the forecasted value
with capacity
predict = min(predict, &mcapacity);
Note, this is a simple analysis model does not include a wash, no-show or overbooking analysis.
If the occupancy date was a busy day either in the past, last year, or forecasted, then create new variables
with their respective number of rooms sold.
if Rooms_Sold >= .9*&mcapacity
then bd = Rooms_sold;
if Rooms_SoldLY >= .9*&mcapacity
then bdLY = Rooms_SoldLY;
if predict >= .9*&mcapacity
then Ebd = predict;
As stated, the HPF procedure uses roughly two years of historical occupancy dates. Sub-setting the last 60
days of data both this year and last allows the RM to easily identify a change or seasonal trend. Using the
subset past 60 day data set, the MEANS procedure, and ODS, you can calculate the rooms sold and
revenue year-on-year effect, macro variables myoy and myoyrev, respectively.
call symputx(’myoy’, (Rooms_Sold_sum
- Rooms_SoldLY_Sum)/ROoms_SoldLY_Sum);
call symputx(’myoyrev’, (Room_Revenue_sum
- Room_RevenueLY_Sum)/Room_RevenueLY_Sum); university
Use the new Ebd variable, the MEANS procedure, ODS, and output of the HPF procedure to calculate the
percent of expected busy days
proc means data = hotel3 n;
ods output Summary=sumebd;
var ebd predict;
run;
data _null_;
set sumebd;
call symputx(’mnebd’, ebd_n/predict_n);
run;
DISPLAYING THE MULTI-FACETED DAILY STRATEGY REPORT


After the title page, display the Property and Data Description page which identifies the property details, date
details, and hotel-level key metrics.

The Daily Strategy Report creates a data set with level, titles, and caption variables and displays
them with the REPORT procedure. The data set contains the property details data, data analysis date
ranges, and hotel-level key metrics and all of their respective macro variables.


       data titles1;
        length level $40 titles $300 caption $400;
        level = "Property Details";
        titles = "Property Name";
        caption = "&mhotel";
        output;
       ...
       run;

Below is sample code used to generate the Property Data Description table in The Daily Strategy Report
with the REPORT procedure.


       proc report data = titles1 nowd split = ’ ’ noheader;
        column level titles caption;
        define level   /order order=data ’ ’ noprint;
        define titles /width=30 flow
         style(column)=[font_face=’Arial’ font_size = 10pt];
        define caption /width=40 flow
         style(column)=[font_face=’Arial’ font_size = 10pt];
        break after level/skip;
        compute before level/style=[just=l background=cx0083be
         font_size=12pt
         font_face=’ Century Gothic’ foreground=white
         font_weight=bold]; line level $30.;
        endcomp;
        break after level/skip;
       run;

In the REPORT procedure, use the COMPUTE block to turn on the traffic lighting. The following code also
helps make the distinction between past and future occupancy dates as well as special events.

       compute occupancy_date;
        line_count + 1;
        if occupancy_date  &mtoday and mod(line_count,2) = 0 then
         call define(_row_, 'style', 'style=[background = cxe5f7ff]');
        if shortnameLY ^= " " then do;
         call define(_row_, 'style', 'style=[background = cxfff9cc]');
         call define(_col_, 'style', 'style=[background = cxffe419]');
        if shortnameLY ^= " " then do;
        call define(_row_, 'style', 'style=[background = cxfff2e5]');
        call define(_col_, 'style', 'style=[background = cxffba75]');

Use the COMPUTE block to highlight busy nights in the past, forecasted, and last year.

       compute occupancy;
        if occupancy.sum > 0.9 then
         call define(_col_, ’style’, ’style=[background = cx775d97]’); endcomp;
       compute predict;
if predict.sum/(&mcapacity - ooo.sum) > 0.9 then
call define(_col_, ’style’, ’style=[background = cx775d97]’); endcomp;
compute Rooms_SoldLY;
if Rooms_SoldLY.sum/(&mcapacity - oooLY.sum) > 0.9 then
call define(_col_, ’style’, ’style=[background = cx775d97]’); endcomp;
Use the COMPUTE block to highlight occupancy dates with a large pick-up in ADR or rooms sold.
compute room_pu;
if occupancy_date < &mtoday then room_pu.sum = .;
if room_pu.sum >= 20 and room_pu.sum ^= . then
call define(_col_, ’style’, ’style=[background = cxb3e57f]’);
else if room_pu.sum = 20 and adr_pu.sum ^= . then
call define(_col_, ’style’, ’style=[background = cxb3e57f]’);
else if adr_pu.sumBetsy Enstrom
IDeaS-A SAS Company
8500 Normandale Lake Blvd. Ste. 1200
Bloomington, MN 55437
(952)698-4205
Fax: (952)698-4299
E-mail: betsy.enstrom@sas.com
www.ideas.com
SAS and all other SAS Institute Inc. product or service names are registered trademarks or trademarks of
SAS Institute Inc. in the USA and other countries. ® indicates USA registration.
Other brand and product names are trademarks of their respective companies.
You can also read