The Belgian Telecom Landscape - Study on the Belgian Telecom Sector - 1st edition 12 January 2015
←
→
Page content transcription
If your browser does not render page correctly, please read the page content below
The Belgian Telecom Landscape

Study on the Belgian Telecom Sector - 1st edition
12 January 2015

                                                    Arthur D. Little Benelux S.A. / N.V.
                                                    Avenue du Bourgetlaan 42
                                                    B - 1130 Brussels
                                                    Belgium
                                                    Telephone 32.2.761.72.00
                                                    Telefax       32.2.762.07.58
                                                    adlittle.brussels@ adlittle.com
                                                    Reference: P14004116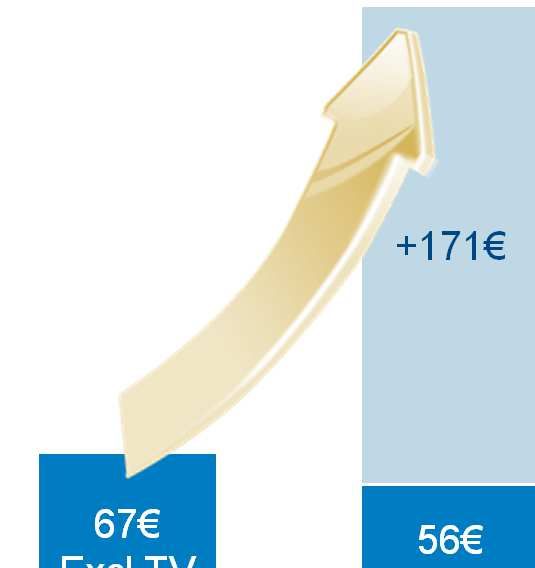
Content

1         The telecom sector is at the core of the Belgian society and economy

2         Telecom is the main engine for the digital eco-system

          Despite a difficult environment, telecom operators are sustaining their level of
3
          investment

4         For a digital New Deal fostering Telecom investments

                                                                                             2
1   The telecom sector is at the core of the Belgian society and economy

    Telecom services are part of our daily life

      By end 2013:

                      80%               of Belgian households have a                                                            68%               of the Belgian population
                      broadband internet connection and                                                                                 uses the Internet on a daily basis

                      61,5%                   have interactive digital TV

                                                                                                                                  Around    97%               of companies in

                      54%             of Belgians use high-speed mobile data and
                                                                                                                                             Belgium have Internet access

                      65%             watch videos

                                                                                                              48%              of people have bought something online
                      52%               of Belgians are active on                                                last year while the e-Commerce revenues of Belgian
                      social media
                                                                                                                                    companies account for          14%
    1) Population of 18+ persons living in Belgium
    Source: SPF Economie, ICT barometer 2014; Our mobile planet report 2013 by Google; Global Digital Statistics 2014 by We are Social; Havas MMS 2014 report; Arthur D. Little
          analysis
                                                                                                                                                                                  3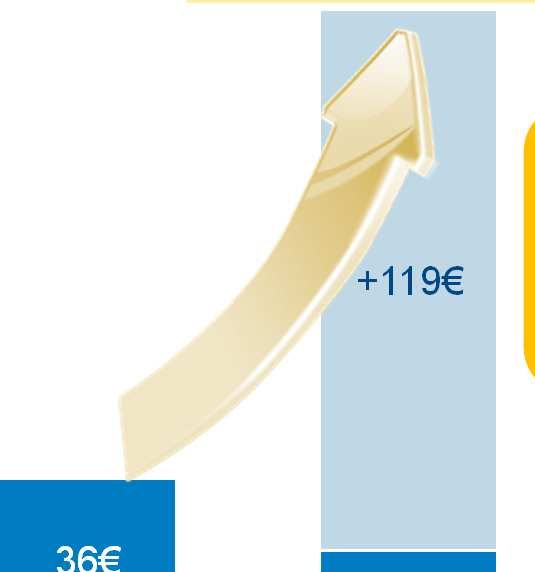
1   The telecom sector is at the core of the Belgian society and economy

    Telecom services usage is strongly growing while prices are falling down

    Telecom use strongly growing                                                   Telecom’s prices falling down
                                                                                     Base 100 in 2006,                             Not including discounts
        Mobile voice                    SMS              Mobile internet             consumer price index evolution                  on Telecom packs
         Billion minutes            Billion SMS               Billion Mb              150
              +30%                    +86%                        x15

                     17,3                    29,3                     10,6            140
        13,3                                                                                                                                 134; Electricity
                                 15,8                                                                                                        129; Postal services
                                                                                      130
                                                            0,7                                                                              126; Natural gas

        2009         2013        2009       2013           2009       2013            120                                                    117; Inflation
                                    Fixed
        Fixed voice1                                        Digital TV                                                                       109; Rail transport
                                  broadband                                           110
         Billion minutes          Million of lines         Million of users                                                                  107; Financial services
               -2%                      +22%                        +87%
                                                                                      100                                                    99; Parking
        11,6         11,3                       3,8                        3,5
                                   3,1                                                                                                       93; Telecom services2
                                                              1,9                      90

                                                                                       80
                                                                                         2006 2007 2008 2009 2010           2011 2012 2013
        2009         2013         2009         2013          2009      2013
    Source : Operators, IBPT, SPF Economie; Arthur D. Little analysis
    1) Including VoIP, 2) Telecom services: Fixed telephony, mobile telephony, internet and undiscounted telecommunication packs
                                                                                                                                                                   4
1   The telecom sector is at the core of the Belgian society and economy

    The share of Telecom services slightly decreased in Belgian households spending

    Evolution of Belgian Households Spending

      Average yearly spending per household, in €                                                                Telecom Services Share of households
        Share of wallet%                                                                                         spending (%)
               0,1%          35.430
                                               100%
               1,1%
               3,0%
                                                  Postal services
               4,2%
               5,0%                               Digital and multimedia devices 2
               6,4%                               Telecom services 1                                         3,24%
               7,7%                                                                                                                                               2,96%
                                                  Health                                                                                                                  -0,29 pts
               12,1%                              Clothing and shoes
                                                  Furniture, household equipment and maintenance
               15,2%                              Culture, leisure and training
                                                  Transport

               16,7%                              Food, beverages and tobacco
                                                                             3
                                                  Other goods and services
                                                  Housing, water, electricity, gas and other fuels
                                                                                                          2006                                                    2012
               28,7%

                              2012
                                                                                                     1)   Excluding telecom devices
    Source : SPF Economie, Arthur D. Little analysis                                                 2)   Including telecom devices, radios, televisions, computers and cameras
                                                                                                     3)   Including: traveling, body and personal care, hotel, restaurant and bar
                                                                                                          expenses, financial services…
                                                                                                                                                                                      5
1 The telecom sector is at the core of the Belgian society and economy
Operators provide a substantially better offering that generates 4 to 7 times more
value for money to the consumers
Mobile “Customer Surplus” Fixed “Customer Surplus”
Comparison of mobile post-paid offerings 2009-2013 Comparison of fixed offerings 2009-2013
>250-600 min Internet speed of 56 Mbps
AND unlimited SMS AND TV everywhere
AND 1-2 GB 3G/4G data AND Homespot Wifi
(avg. speed of 21 Mbps) AND National + EU voice
1.5-2x more minutes 5x more speed
Unlimited SMS + out-of-home TV
7x more speed +171€
+119€ and Internet
150-400 min + 0.5-2 GB 3G/4G Internet speed of 11
+ EU voice
OR 300-400 SMS mobile data Mbps
+ paid access to 2G/3G AND Basic TV
(avg. speed of 3 Mbps) AND National voice
67€ 56€
36€ Excl TV
20€ Excl TV
2009 2013 2009 2013
Monthly average invoiced amount per user1
“Customer surplus”: average 2013 telecom usage at 2009 prices, per user1
Source: Operators, Arthur D. Little analysis (1) Based on actual revenues and usage
61 The telecom sector is at the core of the Belgian society and economy
Business and administration productivity is supported by the telecoms industry
Improved productivity for
businesses and employees Savings for the Belgian Administration
+15% Profitability improvement for SMEs
due to telecoms:
50% of the population was in contact with the
public authority via internet over the past year
+7% due to cost savings
(supply, marketing…) Over 65% use Internet-based vehicle registration and
+8% increase of revenues over 73% tax-on-web submission
(client segmentation, geographic % of population
zones) 80
73
Reduction in transport costs 70 65
-7% thanks to telecommunication services
(phone, mail, conferences…)
60
Tax-on-web
50
40
28 Vehicles e-Registration
of employees carry out 75% of their 30
58% work with connected tools 21
0
2005 2006 2007 2008 2009 2010 2011 2012
Source : Cisco, Google, IDC, Arthur D. Little analysis Source : SPF Economie, ICT Barometer 2013; Arthur D. Little analysis
71 The telecom sector is at the core of the Belgian society and economy
Continuously increasing average broadband speeds, with the addition of new
services
Increasing bandwidths Enriched Content Offering New Services
Average bandwidth, 2009-2013 Up to 80 TV channels available Smart Home
Premium applications included
Possibility to watch live and catch-up TV
on mobile devices
Fixed Broadband x5
Cloud storage services
Fixed broadband speed: average speed,
weighted according to the number of
subscribers that have a broadband connection
with a certain bandwidth
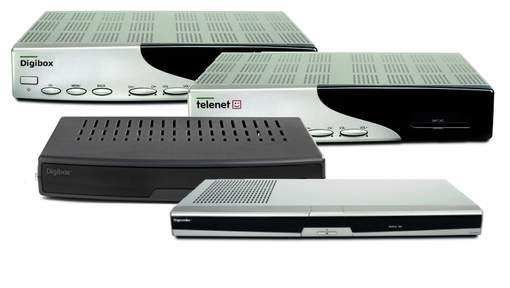
Transformation of the TV-box WiFi homespots and hotspots
Integrated hard drive
Mobile Broadband x7
PVR: Personal video
recording
Mobile broadband speed: average speed for the Multi SIM offers with several
Replay offer: TV on demand and
3 mobile operators according to Commsquare
catch-up TV complementary SIM cards for tablets
included in the contract
Source : Commsquare; Arthur D. Little analysis
8Content
1 The telecom sector is at the core of the Belgian society and economy
2 Telecom is the main engine for the digital eco-system
Despite a difficult environment, telecom operators are sustaining their level of
3
investment
4 For a digital New Deal fostering Telecom investments
92 Telecom is the main engine for the digital eco-system
Globally, the digital sector is enjoying strong growth across all segments
Revenues of the digital ecosystem by sub-sector1
In billion dollars Growth Illustrative companies
+39% 2007-2013
3,959 4,028
+215%
3,702 212 259
166 286 286 +2%
3,372
127 285
3,127 3,106 501 500 +35%
2,900 92 102 275
Internet 481
82 283 263
280 432
Content
414 399
Software & 371 1,316 1,322 +59%
IT services 1,201
1,076
924 938
Devices 830
205 191 -17%
208
225 205 212
Equipment 229
1,362 1,439 1,471 +33%
Network 1,190 1,199 1,249
1,107
operators
2007 2008 2009 2010 2011 2012 2013
Source: Thomson Reuters, Arthur D. Little analysis 1) Top 30 per category by 2013 revenues
102 Telecom is the main engine for the digital eco-system
Growth is strong in all parts of the world except in Europe
Revenues of the digital ecosystem by region1,2
In billion dollars +39% Growth 2007-2013
3,959 4,028
24 +18% Oceania
3,702 26
3,372 27
3,127 3,106 21
2,900 24 1,527 1,544 +57% Asia
21
Oceania 20 1,409
1,274
1,123 1,150
Asia 984 67 68
54 +102% South America
30 56
South America 34 36
1,566 1,692 1,786 +56% North America
North America 1,145 1,257 1,237 1,368
Europe 717 693 661 652 646 647 606 -16% Europe
2007 2008 2009 2010 2011 2012 2013
Source: Thomson Reuters, Arthur D. Little analysis 1) Top 30 per category by 2013 revenues
2) Nationality according to HQ location
112 Telecom is the main engine for the digital eco-system
Globally, telecom operators generate the vast majority of investment, while they
benefit only from a third of the added-value
Investment by sub-sector1 Free cash flows by sub-sector1
% of total ecosystem investment % of total ecosystem FCF
-2 pt +8 pts
-14 pts +6 pts
68% 66% 30%
28% 28%
22% 22%
+2 pts
+5 pts
+2 pt 14% - 6 pts
11% 13% 11%
19% -1 pts 10%
17% -1 pt +3 pt
+0 pt 6%
4%
6% 5% 4% 3% 5%
2% 2% 2%
Network Devices Equipment Software Content Internet Network Devices Equipment Software Content Internet
operators operators
2007 2013 2007 2013
Source: Thomson Reuters, Arthur D. Little analysis 1) Top 30 per category by 2013 revenues
122 Telecom is the main engine for the digital eco-system
The relative share of telecoms in the digital ecosystem varies dramatically by region of
the world; Europe is overweighed in telecoms (or underweighted in other segments…)
Turnover and market capitalization of top 30 players in each category by nationality1
Turnover – 2013 Market capitalization – 2013
In €B In €B
1,786 4,204
Internet 225
1,544 Internet 917
Content 184
Content 403
IT services
350
and software
IT services
853 1,097
and software
1,410
Devices 469 12
606 161
Telecom 82 4 Devices
26 936 199
89 54
equipment 75 0 Telecom 824 8
equipment 197 436 102
Network 527 20 127 0
469 391 Network
operators 81
operators 654 581 506
North America Asia Europe North America Asia Europe
Source: Thomson Reuters, Arthur D. Little analysis 1) Top 30 players by 2013 revenues in each category, geographic breakdown according to
headquarters location
132 Telecom is the main engine for the digital eco-system
In the Belgian digital ecosystem, telecom operators generated 59% of the revenues
while accounting for 87% of investments, 75% jobs and 90% of taxes in 2013
2013 Digital Eco-system Turnover, Investment, Employment and Taxes
Turnover1 Investments2 Direct employment3 Taxes4 5 OTT Internet players
6% 1% 3%
7% 6% 5 content providers
5% 16% 0% 2%
12% 0% 0%
1%
7%
19%
5 device manufacturers
4%
87% 89%
5 equipment vendors
75%
59%
5 telecom operators
Source : Trends Top, BelFirst, Annual Reports, 1) For LG Electronics and Apple, Benelux turnover pro rata of the share of the Belgian 2) Yearly average in terms of FTEs
National Bank Central Balance Sheet Office population. Facebook revenue calculated on the basis of the EU ARPU. Amazon 3) Incl estimates for own content production, incl. estimate for Google Data
Arthur D. Little analysis revenues calculated as a share of turnover in FR with respect to Belgian site visits. Center expansion investment 2013-2014
Google publicised revenue rescaled for reseller margin 4) Corporate taxes, excluding license fees for telecom players 142 Telecom is the main engine for the digital eco-system
1 euro invested in new high-speed broadband (fixed and mobile) networks creates 3
euros of GDP which represents 1,5 euros of revenue for the State
Multiplier effect of telecom investment on the economy and revenues for the Belgian State
In billion euros, cumulated from 2013 to 2022 Examples of induced
effects on the economy
Time and productivity
gains for enterprises
Belgian GDP in 2022:
45,4% of compulsory Time savings and
levy on GDP customer experience
+0,65pts to +0,83pts
improvement
15-19
Emergence of new
7-9 sectors of activities
6-7 and new players
Investments of telecom Creation of Compulsory Next to this, operators
operators in new very high cumulated taxes will invest in the same
speed networks (fixed and GDP in time frame €13-14
mobile) Belgium billion in IT, services,
the existing network…
with a multiplier of 1,5
∑(2013 – 2022) to 13
Source : Akamai, IDATE, Arthur D. Little Ericsson Chalmers university of technology « Socioeconomic effects of broadband speeds », Eurostat « Taxation trends in
the European Union », Etno Agenda for Europe, Arthur D. Little analysis
152 Telecom is the main engine for the digital eco-system
Besides, Belgian operators kept their employment levels stable
(the 5 main telecom operators employed >28.000 FTEs in 2013)
Employment Evolution in Belgium1
Base 100 in 2009
102 101
Telecom operators +1%
100 Water distributors + 0%
100
98
96
94 Railway network - 6%
94
Motorway network - 6%
92
90
90 Gas and electricity - 10%
88
The 5 main telecom
86 operators in Belgium
employed >28.000 Full-
84
Time Equivalents in 2013 82
82 Postal services - 18%
80
2009 2010 2011 2012 2013
1) Telecom operators: Base Company, Belgacom, Mobistar, Telenet and Voo; Water distribution: Watergroep,
Source : NBB, Annual reports, Arthur D. Little analysis
Société Wallonne des eaux, TMWV, Antwerpse waterwerken, Vivaque; Railway network: Infrabel; Motorway
network: Wegen en Verkeer; Gas and electricity: Electrabel, Elia, EDF Luminus; Postal services: Bpost
162 Telecom is the main engine for the digital eco-system
Telecom operators contribute heavily to Belgium’s GDP growth, unlike the
“GAFAM1”
Share of added value made in Belgium accounted
Value injected by the telecoms into the economy
for in the national GDP2,3 - 2013
In billion euros
45 bn€ 100%
3 bn€ other expenses (marketing,
7% distribution fees) to other suppliers
15% 6,6 bn€ to private shareholders
9,5 bn€ in the deployment,
21% enhancement and maintenance of the
telecom networks
9,7 bn€ to the state in taxes (excluding 9%
VAT), licenses and dividends
21%
Operators GAFAM
10,2 bn€ direct land indirect labour
costs and benefits
22%
6,2 bn€ to the state in effective net
value-added tax (VAT)
14%
>90% of the added value realised in Belgium by the
2007 - 2013 “GAFAM(1)” are not accounted in the Belgian GDP growth
1) Google, Apple, Facebook, Amazon, Microsoft
Source : Annual reports, TrendsTop, BelFirst, National Bank Central Balance 2) Publicised added value share of estimated added value. Estimated is the added value scaled
Sheet Office, Arthur D. Little Analysis for the effective revenues of internet players in Belgium
3) GDP is the sum of all publicized added value in Belgium 17Content
1 The telecom sector is at the core of the Belgian society and economy
2 Telecom is the main engine for the digital eco-system
Despite a difficult environment, telecom operators are sustaining their level of
3
investment
4 For a digital New Deal fostering Telecom investments
183 Despite a difficult environment, telecom operators are sustaining their level of investment
Despite decreasing margins in the industry, operators have continuously increased
the level of investment, raising the question of medium-term sustainability
Evolution of Turnover, CAPEX and cash flows - telecom operators in Belgium1,2
In percentage of Turnover
7,9 7,8 8,0
7,5 7,7
7,2 7,3
Turn-over
Investments
Cash Flow3
34%
27% 28%
25% 23%
22% 22%
16% 15% 15%
14%
20% 18%
17%
2007 2008 2009 2010 2011 2012 2013
1) Base Company, Belgacom, Mobistar, Telenet and VOO
Source: Annual reports, Operators, Arthur D. Little analysis
2) VOO is not included in 2007 and 2008 due to the unavailability of the data
3) Cash Flow = EBITDA - Investments
193 Despite a difficult environment, telecom operators are sustaining their level of investment
Telecom Operators have rolled out high-performance networks and are investing in
the networks of tomorrow
Fixed High-speed Broadband Coverage Mobile Broadband Coverage
Coverage as % of households Coverage as % of the population
100% 100%
3G Outdoor
90% 90% 3G Indoor
80% High-speed internet 80%
coverage (≥30Mbps)
70% 70%
4G
60% 60%
50% 50%
40% 40%
30% 30%
WiFi Homespot
20% /hotspot 20%
coverage
10% 10%
0% 0%
2008 2009 2010 2011 2012 2013 H1 2014 2008 2009 2010 2011 2012 2013 H1 2014
Source : Operators, IBPT, European Commission (Broadband coverage in Europe reports), Arthur D. Little analysis
203 Despite a difficult environment, telecom operators are sustaining their level of investment
Belgium is leading in fixed Next-Generation Access broadband coverage and
catching-up on 4G
Fixed High-speed Broadband Coverage Mobile: 4G Coverage
Next-Generation Access broadband coverage/availability in Outdoor coverage as % of the population
2013, as % of households
100% 100% SE
90% PT
80% 80% CH
70% NO
BE UK
60% 60%
FR
50%
DE
40% 40%
30%
IT
20% 20%
10%
0% 0%
BE
CY
HU
EE
SI
SE
BG
ES
CZ
IS
SK
IE
FR
HR
MT
NL
LT
LU
LV
DK
UK
NO
DE
FI
RO
EU
27
PL
EL
PT
AT
IT
Q1 Q2 Q3 Q4 Q1 Q2 Q3 Q4 Q1 Q2 Q3 Q4 Q1 Q2
11 11 11 11 12 12 12 12 13 13 13 13 14 14
Source : European Commission digital agenda, Exane, Arthur D. Little analysis
213 Despite a difficult environment, telecom operators are sustaining their level of investment
Telecom’s investment level in Belgium has reached a new record in 2013, exceeding
that of other network infrastructures
Telecom’s investment in Belgium Investment in network infrastructures in Belgium
2007 – 2013, in billion euros1 Yearly average, 2009 – 2013, in billion euros2
1,8 2,0
1,8
1,6 1,6
1,5
1,4 1,3
1,5 1,4
1,2
1,2 1,1
1,0 1,1
1,0
1,0
0,8 0,8
0,7
0,6
0,5
0,4
0,2
0,0 0,0
2007 2008 2009 2010 2011 2012 2013 Telecom Railway Electricity Motorway
transmission network
and
distribution
1) Excluding mobile license fees
Source : NBB, Annual reports, Operators, Arthur D. Little analysis 2) Telecoms: Base Company, Belgacom, Mobistar, Telenet and Voo; Railway: Infrabel; Motorway network:
Wegen en Verkeer and Direction générale routes et batiments; Electricity transmission and distribution:
Elia, ORES, Tecteo, Régie de Wavre, AIESH, AIEG, Sibelga, Eandis and Infrax 22Content
1 The telecom sector is at the core of the Belgian society and economy
2 Telecom is the main engine for the digital eco-system
Despite a difficult environment, telecom operators are sustaining their level of
3
investment
4 For a digital New Deal fostering Telecom investments
234 For a digital New Deal fostering Telecom investments
Given the strong growth in telecom services usage and the economic context, it is
critical to support the investment effort of the telecommunication operators
Usage of telecom services is growing Mobile internet volume from 2009 to
strongly x 15 2013
Number of fixed fast broadband
x 10 (>30Mbps) users from 2009 to 2013
Digital bonus: Operators provide a
substantially better offering that
Value received increases x 4-7 generates 4 to 7 times more value for
money to the consumers
Operators have nonetheless
Of the operators’ turnover have been
maintained their investment level in 24% invested in 2013
an uncertain environment
The telecom sector has a major Of cumulated GDP will be created
between 2013 and 2022 by the
boosting effect on the Belgian 15-19 bn€ operators’ investment in new super
economy fast broadband networks
Source: BIPT, Operators, Arthur D. Little analysis
244 For a digital New Deal fostering Telecom investments
Legal and regulatory cycles are not in line with the long cycles of telecom
investment
Misalignment between the length of economic, technology, regulatory and fiscal cycle
Investment
~15years
cycles1)
1994 : 2G
Technology
~10 years 2004 : 3G
cycles
2012 : 4G
European 2002 : 1st Telecom Package 2012 : Roaming II
Regulatory 2007 : Roaming I, amended in ‘09 2013: Projet de règlement CE
~5 years
Cycles 2007 : 2nd Telecom Package 2014 : 3rd Telecom Package
Belgian
Regulatory Market analysis by regulators
Cycles ~3 years
Belgian 2005-2014 : New telecom Act with yearly amendments
2012 : Telecom Law
Legislative
~1 year 2012 : VAT increase on digital TV
Cycles
2013 : Walloon regional and municipal tax on GSM masts
Source : Operators, BIPT, European Commission, Thomson 1) Average years needed to effectively amortize telecom assets. Calculated as being the inverse of the
Reuters, Moniteur Belge, Arthur D. Little analysis return on capital for Mobistar, Belgacom and Telenet as provided by ThomsonOne
NB: For technological cycles, licenses attribution in Belgium 254 For a digital New Deal fostering Telecom investments
For a digital New Deal that will foster telecommunication investment
Guarantee regulatory predictability to ensure necessary visibility for the telecom
1 investments
Set-up fiscal and financial incentives (reduction of over-taxation) to stimulate
2 private investment in high-speed networks
3 Set-up regulatory and fiscal level-playing field for all actors in the digital ecosystem
4 Build trust in the networks in this digital age
5 Public Authorities to stimulate the development of the digital economy
26Contact details
As the world’s first consultancy, Arthur D. Little Contact:
has been at the forefront of innovation for more
than 125 years. We are acknowledged as a Gregory Pankert
thought leader in linking strategy, technology Partner, Brussels
and innovation. Our consultants consistently Mobile: +32 473 997 227
develop enduring next generation solutions to Email: pankert.gregory@adlittle.com
master our clients' business complexity and to
deliver sustainable results suited to the
economic reality of each of our clients.
Arthur D. Little has offices in the most important
business cities around the world. We are proud
to serve many of the Fortune 500 companies
globally, in addition to other leading firms and
public sector organizations.
For further information please visit
www.adlittle.com
Copyright © Arthur D. Little 2014. All rights
reserved.
27You can also read