The best place and time to live in the Milky Way
←
→
Page content transcription
If your browser does not render page correctly, please read the page content below
Astronomy & Astrophysics manuscript no. 39507corr                                                                                       ©ESO 2021
                                               January 27, 2021

                                                                      The best place and time to live in the Milky Way
                                                                             R. Spinelli ‹1, 2 , G. Ghirlanda2 , F. Haardt1, 2, 3 G. Ghisellini2 , G. Scuderi4

                                                      1
                                                          Dipartimento di Scienza e Alta Tecnologia, Università dell’Insubria, Via Valleggio 11, 22100 Como, Italy
                                                      2
                                                          INAF – Osservatorio Astronomico di Brera, Via E. Bianchi 46, 23807 Merate (LC), Italy
                                                      3
                                                          INFN – Sezione Milano–Bicocca, Piazza della Scienza 3, 20126 Milano, Italy
                                                      4
                                                          Dipartimento di Fisica G. Occhialini, Università Milano–Bicocca, Piazza della Scienza 3, 20126 Milano, Italy

                                                      Received September 18, 2020; accepted

                                                                                                                    ABSTRACT
arXiv:2009.13539v2 [astro-ph.HE] 26 Jan 2021

                                                      Context. Counted among the most powerful cosmic events, supernovae (SNe) and γ´ray bursts (GRBs) can be highly disruptive
                                                      for life: Their radiation can be harmful for biota or induce extinction by removing most of the protective atmospheric ozone layer
                                                      from terrestrial planets (TPs). Nearby high-energy transient astrophysical events have been proposed as possible triggers of mass
                                                      extinctions on Earth.
                                                      Aims. We assess the habitability of the Milky Way (MW) throughout its cosmic history against potentially disruptive astrophysical
                                                      transients with the aim of identifying the safest places and epochs within our Galaxy. We also test the hypothesis that one long GRB
                                                      played a leading role in the late Ordovician mass-extinction event („ 445 Myr ago).
                                                      Methods. We characterised the habitability of the MW throughout its cosmic history as a function of galactocentric distance of TPs.
                                                      We estimated the dangerous effects of transient astrophysical events (long and short GRBs and SNe) with a model that connects their
                                                      rate to the specific star formation and metallicity evolution within the Galaxy throughout its cosmic history. Our model also accounts
                                                      for the probability that TPs form around FGK and M stars.
                                                      Results. Until about six billion years ago, the outskirts of the Galaxy were the safest places to live, despite the relatively low density
                                                      of TPs. In the last about four billion years, regions between 2 and 8 kpc from the center, which had a higher density of TPs, became
                                                      the best places for a relatively safer biotic life growth. We confirm the hypothesis that one long GRB played a leading role in the late
                                                      Ordovician mass-extinction event. In the last 500 Myr, the safest neighborhood in the Galaxy was a region at a distance of 2 to 8 kpc
                                                      from the Galactic center, whereas the MW outskirts were sterilized by two to five long GRBs.
                                                      Key words. Gamma-ray-burst: general, Galaxy: evolution, Astrobiology

                                               1. Introduction                                                              cm´2 ). This level of irradiation can produce stratospheric nitro-
                                                                                                                            gen compounds, which quickly destroy 90% of the ozone layer
                                               One of the primary goals of exoplanetary research is to find                 on average (Thomas et al. 2005a). As a first consequence, the
                                               habitable worlds. In order to assess the very notion of "habit-              higher solar UVB radiation that would reach the surface of Earth
                                               able", we must rely on our understanding of the reasons for the              would be harmful to life. Intense UVB radiation could also be
                                               presence and absence of lifeforms in the Solar System. Several               lethal to surface marine life such as phytoplankton, which is cru-
                                               factors determined the appearance and development of life on                 cial for the food chain and oxygen production. Moreover, the
                                               planet Earth. In addition to particular intrinsic properties of the          opacity of the NO2 produced in the stratosphere would reduce
                                               planet (e.g., geology and magnetic field) and solar characteris-             the visible sunlight that reaches the surface, causing a global
                                               tics (e.g., spectrum and irradiation), it is understood that a key           cooling. As argued by Herrmann & Patzkowsky (2002) and Her-
                                               requirement for the development of life on Earth is the presence             rmann et al. (2003), the late Ordovician mass-extinction event
                                               of liquid water on the planetary surface. Potentially habitable ex-          („445 Myr ago), which is one of the five great mass extinctions
                                               oplanets are identified based on their location within the circum-           on Earth, has some climatic signatures that can be interpreted by
                                               stellar habitable zone (CHZ; e.g., Kasting et al. 1993; Kopparapu            invoking an extra-terrestrial cause such as a nearby GRB (Melott
                                               et al. 2013).                                                                et al. 2005).
                                                    In addition to local factors, planetary habitability could also
                                               be affected by the galactic environment, for example, by as-                     The lethality of transient astrophysical events depends on
                                               trophysical events outside the Solar System that can irradi-                 their energy released as high-energy radiation and their occur-
                                               ate the planet. As many studies suggest (e.g., Ruderman 1974;                rence rate in the Galaxy: more powerful events can be lethal for
                                               Thorsett 1995; Dar et al. 1998; Gehrels et al. 2003; Melott &                a planet over larger distances, while a high event rate can also re-
                                               Thomas 2011; Svensmark 2012), high-energy transients such as                 duce the ability of the planet to recover from the environmental
                                               supernovae (SNe) and gamma-ray bursts (GRBs) could be life-                  effects induced by the radiation of the event. Piran & Jimenez
                                               threatening and a potential cause of mass extinctions. A GRB,                (2014) and Li & Zhang (2015) consistently found that long-
                                               with a typical isotropic equivalent energy of 1052 erg located               duration GRBs (with an observed duration ą2 s; LGRBs here-
                                               within „1 kpc from the Earth, would irradiate its atmosphere                 after) are the most dangerous astrophysical events for the Earth,
                                               with a γ-ray (i.e., keV–MeV) fluence ě100 kJ m´2 (108 erg                    even more so than short-duration GRBs (lasting ă 2 s; SGRBs
                                                                                                                            hereafter) and SNe. This is mainly due to the high energy 1051´54
                                                ‹
                                                    email:r.spinelli@studenti.uninsubria.it                                 ergs (isotropic equivalent) released by LGRBs, which compared
                                                                                                                                                                        Article number, page 1 of 11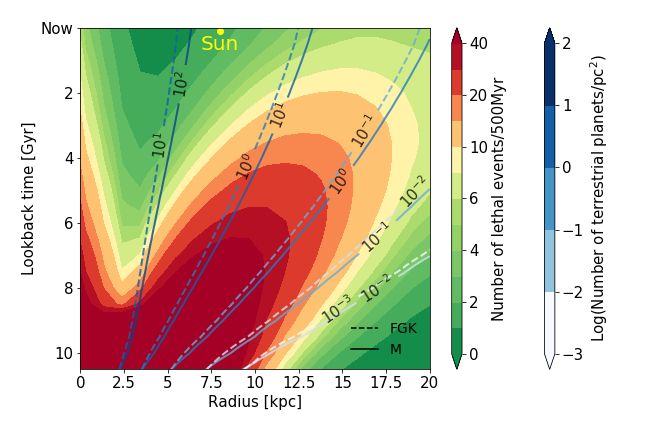
A&A proofs: manuscript no. 39507corr

to SNe compensates for their lower intrinsic rate („ 5 ˆ 10´6            2. Methods
yr´1 per galaxy according to Wanderman & Piran 2010). In par-
ticular, the probability is non-neglibile (50% according to Piran        2.1. Cosmic rate
& Jimenez 2014) that in the last 500 Myr the Earth could have            For a generic population of astrophysical sources described by
been illuminated by one long lethal GRB (precisely „0.93 ac-             a function ξ in the luminosity-redshift (L ´ z) space, the cosmic
cording to Li & Zhang 2015).                                             rate (number of events per unit comoving volume and time) at
    The rate of astrophysical events is linked to the properties         any cosmic epoch is
(and their variation with cosmic time) of the environment in              dN
                                                                                  ż
which they occur. The rate of LGRBs, which is connected to the                  “ ξpL, zqdL.                                           (1)
end life of massive stars (e.g., Woosley 1993), is expected to be        dVdz       L
proportional to the efficiency of converting gas into stars (i.e., the
star formation rate, SFR). However, their progenitors are thought        2.2. Scaling down to the Milky Way
to have a low metallicity to conserve the angular momentum re-
quired to efficiently launch the jet (Woosley & Heger 2006; Yoon         In order to estimate the rate of a population of astrophysical
et al. 2006). This argument roughly agrees with the observed             sources within the MW, we rescaled its known cosmic rate at
preference of LGRB to occur in relatively low-metallicity host           any cosmic epoch within the cosmological volume occupied by
galaxies (e.g., Japelj et al. 2016; Palmerio et al. 2019). When          the Galaxy,
the evolution of the rate of LGRBs within the Galaxy is com-                          ż
                                                                         dNMW pzq
puted, the possible evolution of the SFR and the gas metallicity                    “ ξpL, zqVMW pzqPpzq dL,                        (2)
with cosmic time and within the Galaxy therefore need to be ac-              dz
counted for.
                                                                         where VMW pzq “ M‹ pzq{ρ‹ pzq is the cosmological volume oc-
    The ever-increasing number of extrasolar planets („4330 at           cupied by the MW at a given redshift, ρ‹ pzq is the average stellar
present) motivates the extension of these studies to the whole           density as a function of redshift ρ‹ pzq “ 1017.46´0.39z Md Gpc´3
Galaxy. The outer regions of the MW appear to be the most fa-            (Li & Zhang 2015; Mortlock et al. 2015), and M‹ pzq is the stel-
vorable for preserving life (Piran & Jimenez 2014; Li & Zhang            lar mass of the evolving Milky Way (§3.2). Ppzq is the prob-
2015; Vukotić et al. 2016) because the SFR is reduced. How-             ability that astrophysical sources (i.e., LGRB, SGRB, and SN)
ever, Piran & Jimenez (2014) and Li & Zhang (2015) scaled the            occur within the MW at a given cosmic epoch (the cosmic time
cosmological rate of LGRBs in proportion to the stellar mass of          is here represented as the redshift z). This probability depends
the MW disk, assuming constant metallicity and a specific star           on the cosmic evolution of the MW properties (e.g., sSFR and
formation rate (sSFR). In this work we account for the radial            metallicity in the case of LGRBs), which can inhibit or favor the
distribution and the inside-out evolution of metallicity and SFR         occurrence of the lethal transient sources under consideration.
within the Galaxy.
    Gowanlock et al. (2011), Spitoni et al. (2014), and Vukotić         2.3. Rate of lethal events within the MW
et al. (2016) defined a Galactic habitable zone (GHZ) by con-
                                                                         The fluence produced by astrophysical transients in a planetary
sidering only SNe as possible deleterious events and focused on
                                                                         atmosphere is the primary ingredient leading to possible lethal
TPs orbiting FGK stars. It is worth extending these studies by
                                                                         effects. Thomas et al. (2005a,b) estimated in a 2D atmospheric
considering GRBs and M stars, which are the most powerful as-
                                                                         model that a γ–ray fluence of 10 kJ m´2 can on average induce
trophysical events and the most abundant stellar population in
                                                                         a 68% depletion of the ozone layer at an altitude of 32 km on a
the MW, respectively.
                                                                         timescale of a month. Higher fluences, for instance, 100 kJ m´2
    We examine the astrophysical constraints for life in the MW          and 1000 kJ m´2 , would produce depletions up to 91% and
and for the first time consider all the most energetic transient         98%, respectively. We consider a depletion of 91% of the ozone
events (SGRBs, LGRBs, and SNe). We link their rates to the               layer sufficient to produce mass extinctions (see also Thomas
sSFR within the Galaxy and to its variation with cosmic time             et al. 2005a,b; Li & Zhang 2015). We therefore define as astro-
through a semianalytical model describing the evolution of the           physical lethal events that are capable of illuminating a planetary
MW. For LGRBs we consider the variation of the metallicity               atmosphere with a fluence (i.e., energy flux integrated over the
of the MW. Finally, with a similar method as was used by Spi-            event duration) Fě100 kJ/m2 (i.e., 108 erg cm2 , Fc ).
toni et al. (2017), we account for the probability that TPs (also             Given a population of astrophysical events, the lethal effect
dependent upon metallicity) form around FGK and M stars (Za-             on a planet can be quantified by computing the rate of lethal
ckrisson et al. 2016). Throughout the cosmic history of the MW           events. At any cosmic time, the rate per unit time of lethal events
we identify the safest (from an astrophysical perspective) loca-         (i.e., with a fluence ě Fc ) for a planet at distance R from the
tions. These are sites suitable for the presence of planets with         Galactic center is
long-lasting biospheres.                                                                   ż
                                                                         dNMW pR, zq
    Our work is organized as follows. In §2 we present the meth-                        “ ξpL, zqVMW pzqPpd, z|Rq dL,                    (3)
                                                                                dz
ods for estimating the number of lethal events as a function of
the position within the Galaxy and of the cosmic time. In §3 we              where Ppd, z | Rq (see §2.4) is the portion in mass of the
present model assumptions and the model we adopted to com-               Galaxy contained within the region where an event with energy
pute the evolution of the star formation, metallicity, and plane-        E is lethal for a planet at R (i.e., the portion of the MW within
tary density within the MW. In §4 and §5 we present and discuss          a distance d from R) and describes the probability that lethal
our results. In §6 we summarize our results. We adopt a ΛCDM             events occur (i.e., with an energy and distance producing a flu-
cosmological model with ΩM “ 0.3, ΩΛ “ 0.7, and H0 “ 70                  ence ě Fc ) within the MW given its local properties. The integral
km s´1 Mpc´1 .                                                           is performed over the entire luminosity distribution.
Article number, page 2 of 11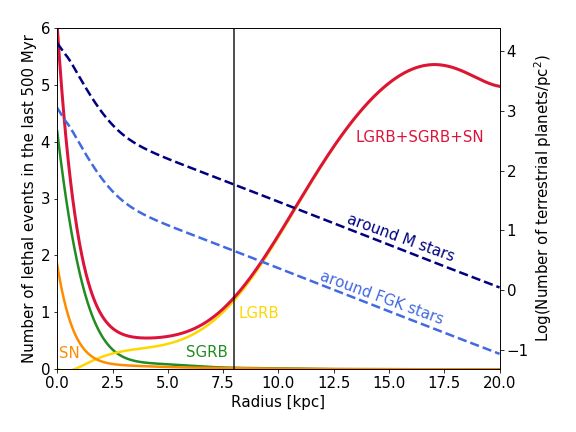
R. Spinelli et al.: The best place to live in the Milky Way
3.1. Luminosity function
We assume a broken power law φpLq for LGRBs (Wanderman
& Piran 2010; Salvaterra et al. 2012; Pescalli et al. 2016) and
for SGRBs (Guetta & Piran 2005; Wanderman & Piran 2010;
D’Avanzo et al. 2014; Ghirlanda et al. 2016), defined between
Lmin and Lmax ,
$´ ¯´α
& L if Lmin ă L ă Lb
L
φpLq “ n0 ´ b ¯´β (6)
% L if L ă L ă L
Lb b max,
where n0 is the present-day (i.e., z “ 0) rate at the break luminos-
ity Lb . GRBs are jetted sources, thus only the GRB jets pointing
at the planet can be harmful. Here n0 is the observed rate (not
corrected for collimation) and L is the isotropic equivalent lumi-
nosity (see §3.4 for details). n0 is the ratio between ρ (i.e., the
cosmological rate at z=0, Table 1) and the integral of φpLq with
unit normalization. We assume that the LGRB and SGRB distri-
butions have a characteristic duration centered on τ of 20s and
2s, respectively (Kouveliotou et al. 1993). The energy (necessary
to calculate the fluence) is derived from the luminosity L assum-
ing that the burst with a duration τ has a triangular shape. This is
a fairly good approximation for SGRBs but an oversemplifica-
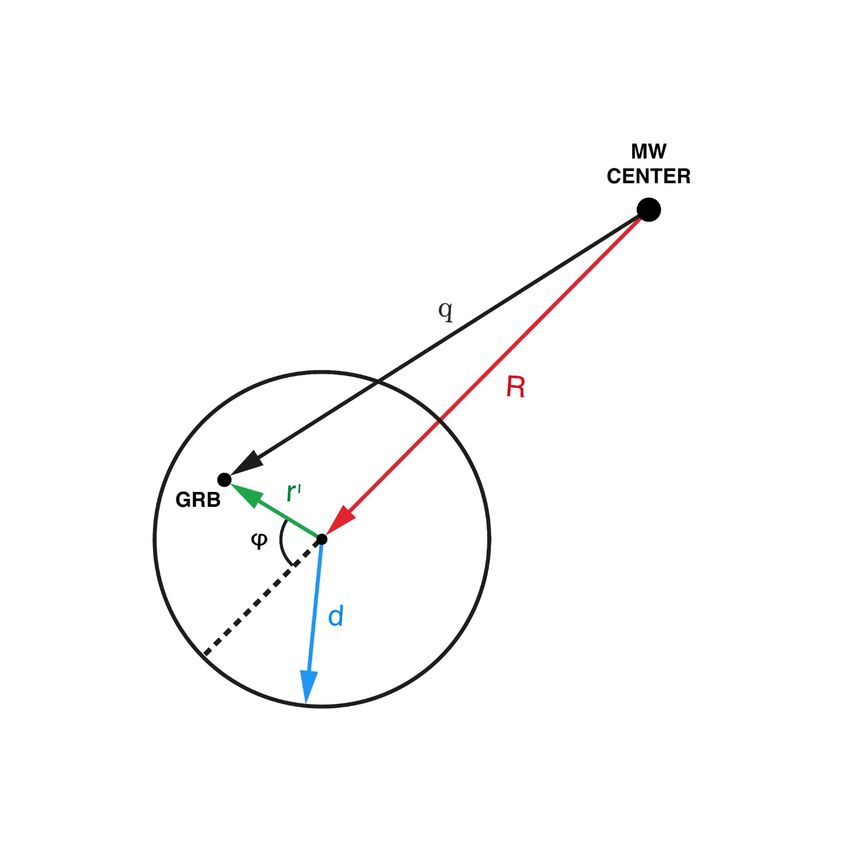
Fig. 1. Portion of the Galaxy where an event with energy E is lethal for tion of the complexity of LGRB light curves. For long and short
a planet at R (solid black circle). The hazard distance d identifies the GRBs we adopt the parameter values reported in Table 1.
circular region within which a GRB of energy E ě 4πd2 Fc can produce For SNe, we consider the cosmic rate at z “ 0 derived by
a lethal fluence. q represents the galactocentric distance of the GRB. In Maoz & Mannucci (2012) and Li et al. (2011). The distribu-
this sketch the center of the polar coordinate system (identified by the tion of the energy output of SNe can be described as Gaus-
arrow R) is the location of the planet. sians (Hatano et al. 1997; Cappellaro et al. 1999; Richardson
et al. 2002; Barris et al. 2004; Botticella et al. 2008; Yasuda &
2.4. Portion of the Galaxy Fukugita 2010) with parameter values reported in Table 2. We
further distinguish between the three different classes of SNe Ia,
We define the hazard distance dpE, Fc q of an astrophysical event Ibc, and IIp.
with energy E as the (lethal) distance within which its fluence is
higher than Fc ,
c 3.1.1. Redshift distribution
E
dpE, Fc q “ . (4) The association of LGRBs with envelope-stripped SNe (Galama
4πFc
et al. 1998; Stanek 2003; Hjorth et al. 2003; Malesani et al. 2005;
Assuming that GRBs and SNe follow the stellar distribution Pian et al. 2006; Campana et al. 2006; Sparre et al. 2011; Me-
within the Milky Way, Ppd, z | Rq at a given time t can be calcu- landri et al. 2012; Xu et al. 2013) and the properties of their
lated by integrating the MW stellar surface density Σ‹ pR, zq (see hosts (e.g., Fruchter et al. 2006) probe their origin from the core-
§3.5) within a distance d from the position of the planet (R), collapse of rapidly rotating massive stars (Woosley 1993; Mac-
1
ż Fadyen & Woosley 1999). Because it is generated by the ex-
Ppd, z | Rq “ Σ‹ pR, zq da. (5) plosion of short-lived massive stars, the redshift distribution of
M‹ pzq S
LGRBs and SNIbc/IIp is expected to follow the cosmic star for-
We adopt a polar coordinate system (see Fig. 1), centered at mation history (CSFR; e.g., Madau & Dickinson 2014; Hopkins
the position at distance R from the Galaxy center, to calculate & Beacom 2006),
Ppd, z | Rq,
p1 ` zq2.7
dpL, Fc q2 2π
ż1
ψ‹ pzq “ 0.015 Md yr´1 Mpc´3 ,
ż
(7)
Ppd, z | Rq “ dφ µ Σ‹ pq, zq dµ 1 ` rp1 ` zq{2.9s5.6
M‹ pzq 0 0
which is represented by the blue line in Fig. 2. However, dif-
b ferently from SNIbc/IIp, the rate of LGRBs deviates from the
q “ R2 ` r1 2 ` 2d Rµ cospφq CSFR (Firmani et al. 2004; Daigne et al. 2006; Le Floc’h et al.
2006; Guetta & Della Valle 2007; Kistler et al. 2009; Virgili et
r1 ” µd with 0 ď µ ď 1. al. 2011; Salvaterra et al. 2012). This corresponds to a steeper
(with respect to the CSFR) increase in the GRB rate with increas-
ing redshift (Pescalli et al. 2016) up to a peak corresponding to
3. Model assumptions z „ 3.5 (i.e., higher than the CSFR peak at z „ 2). This could
be interpreted as caused by the GRB bias (i.e., preference) for
For GRBs and SNe it is customary to factorize ξpL, zq “ low-metallicity progenitors (Woosley & Heger 2006). Studies
φpLqψpzq. Here φpLq describes the luminosity distribution of the of the host metallicity have suggested that GRBs in most cases
event rate at z “ 0, while the dimensionless function ψpzq is its occur in galaxies whose metallicity Z is lower than a threshold
redshift evolution. value „ 0.7 Zd (Vergani 2018; Palmerio et al. 2019). Population
Article number, page 3 of 11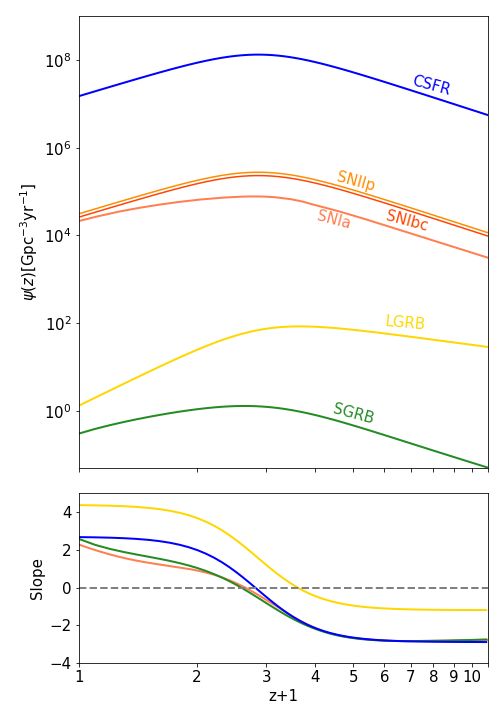
A&A proofs: manuscript no. 39507corr

                                ρ                α              β                  Lb                Lmin          Lmax         τ
                          [Gpc´3 yr´1 ]                                        [ergs s´1 ]        [ergs s´1 ]   [ergs s´1 ]    [s]
                 LGRB       1.3 ˘ 0.6        1.2 ˘ 0.9     2.4 ˘ 0.77          1052.5˘0.2            1049          1054        20
                 SGRB      0.3 ˘ 0.06       0.53 ˘ 0.88     3.4 ˘ 2.2      (2.8˘2.1) ˆ 1052        5 ˆ 1049        1053         2
Table 1. Parameters of the broken power-law luminosity function of LGRBs and SGRBs (Wanderman & Piran 2010; Ghirlanda et al. 2016) and
burst durations. ρ is the cosmological rate at z “ 0.

studies (Bignone et al. 2017, 2018) suggest that this metallic-
ity threshold lies in the range 0.3–0.6 Zd . Assuming a threshold
value Zc “ 0.4 Zd (Bertelli et al. 1994; Virgili et al. 2011), we
therefore modeled the LGRB population under this hypothesis
and express their cosmic rate (orange line in Fig. 2) as
                 ψ‹ pzq ΘZăZc pzq
ψLGRB pzq “                       yr´1 Gpc´3 ,                      (8)
                 ψ‹ p0q ΘZăZc p0q
where ΘZăZc pzq is the fraction of stars with a metallicity lower
than Zc . We calculated ΘZăZc p0q by assuming that the metallicity
of the local Universe has a mean value [Fe/H]0 =-0.006 with a
normal dispersion σ “ 0.22 (Gallazzi et al. 2008; Madau &
Dickinson 2014). As we show in §3.3, the final rate of LGRBs
within the MW does not depend on ΘZăZc pzq, but only on its
value at z=0.
     SGRBs are thought to be produced by the mergers of com-
pact objects, as recently proved by the multimessenger observa-
tions of the event GW/GRB170817 (Abbott et al. 2017a,b). It
is expected that their redshift distribution does not directly fol-
low the CSFR because of the delay between their formation as a
binary and their merger. The delay-time distribution is a power
law with slope ´1 between a few million and a few billion years
(Guetta & Piran 2005; Nakar & Gal-Yam 2005; Guetta & Piran
2006; Wanderman & Piran 2015; Virgili et al. 2011). Ghirlanda
et al. (2016) derived the SGRB formation rate from available
observational constraints and found that it is indeed consistent
with a delayed cosmic SFR history. We here adopt the paramet-
ric function obtained by their work (green line in Fig. 2),
                1 ` 2.8z
ψSGRB pzq “                  yr´1 Gpc´3 .                           (9)   Fig. 2. Top panel: Cosmic density rate of the three classes of high-
              1 ` pz{2.3q3.5                                              energy transients considered: LGRB (yellow line), SGRB (green line),
                                                                          and SNe (orange lines). LGRB and SGRB rates are not corrected for
     For SNIa we assumed the redshift distribution derived by
                                                                          the collimation angle, i.e., they represent the fraction of bursts whose
Maoz & Mannucci (2012). This function is derived by convolv-              jets are pointed toward the Earth. The CSFR (blue line) is in units of
ing the star formation history of Hopkins & Beacom (2006) with            Md yr´1 Gpc´3 . All the curves are normalized to their respective local
a power-law delay-time distribution (DDT „ t´1 ). This DDT,               rate (see Table 1 and Table 2 for GRBs and SNe, respectively). Bottom
in addition to ensuring an excellent fit to the observed SN rates,        panel: Derivative of the formation rate curves shown in the top panel.
supports the hypothesis of a double-degenerate progenitor origin          The color-coding is the same. The derivative of SNIbc, IIp coincides
(i.e., a merger of two white dwarfs) for SNe Ia (Webbink 1984).           with that of the CSFR (blue line in the bottom panel). The horizontal
The SNIa rate is shown with the red line in Fig.2.                        line identifies for each curve the redshift z corresponding to the maxi-
     The cosmic rates of the three classes of transients consid-          mum of the rate curve.
ered in this work are compared in Fig. 2. ψSGRB pzq and ψSNIa pzq
peak at a lower redshift than ψ‹ pzq because of the delay between
their formation as a binary and their merger. ψLGRB pzq peaks at a        that describes the fraction of the sSFR within the MW,
higher redshift because of the metallicity bias.                          sS FRpR, zq, with respect to the specific cosmic star formation
                                                                          rate of the Universe at the same epoch sS FRpzq. sS FRpR, zq is
                                                                          estimated (§3.5) through a model (Naab & Ostriker 2006, 2009)
3.2. Star formation factor                                                that describes the evolution of the radial profile of the star for-
In order to account for the preference of LGRBs and core-                 mation and stellar surface density of the MW. The local cos-
collapse SNe (Ib/Ic/IIp, CCSNe) to occur in regions character-            mic specific star formation rate sS FRpzq is defined as the ra-
ized by a high SFR, we define (similarly to Li & Zhang 2015)              tio of the local star formation rate ψ‹ pzq (Madau & Dickinson
the sSFR correction factor                                                2014) and the average stellar density as a function of redshift
                                                                          ρ‹ pzq “ 1017.46´0.39z Md Gpc´3 (Li & Zhang 2015; Mortlock et
                 sS FRpR, zq                                              al. 2015). As expected, when we combine eq. 8 and eq. 10, the
fsSFR pR, zq “                                                   (10)     terms ψ‹ pzq cancel out (i.e., the global cosmological evolution of
                  sS FRpzq
Article number, page 4 of 11
R. Spinelli et al.: The best place to live in the Milky Way
the SFR is irrelevant when we consider a specific galaxy), only SN type Rate (z=0) Burst energy
the present-day value ψ‹ p0q counts as a normalization factor. 104 Gpc´3 yr´1 [erg]
Ia 2.2˘ 0.3 [a] 1046˘1 [c]
Ibc 2.6˘ 0.4 [b] 1046˘1 [d]
3.3. Metallicity factor
IIp 3.1 ˘ 0.5 [b] 1044˘1 [e]
In order to account for the preference of LGRBs to occur in low- Table 2. Parameters for the populations of SNe: cosmic rate and re-
metallicity environments, we define the correction factor leased energy (ESN ) for each SN type, as reported by Melott & Thomas
(2011). [a] Maoz & Mannucci (2012), [b] Li et al. (2011), [c] Höflich &
ΘZăZc pR, zq Schaefer (2009), [d] Soderberg et al. (2008), and [e] Schawinski et al.
fFe pR, zq “ (11) (2008)
ΘZăZc pzq
as the fraction of stars with a metallicity lower than Zc “ 0.4Zd
(at any R and t) in the MW divided by the fraction of stars with
the same metallicity threshold in the local Universe. This defini- 3.5. Galaxy model
tion is similar to what was adopted by Li & Zhang (2015), but In order to track the evolution and distribution of stellar surface
we consider for the first time the metallicity profile and its time density, SFR, and metallicity of the Galaxy, we used the inside-
evolution within the MW. out formation model of Naab & Ostriker (2009), which repro-
As explained in sec 3.1.1, ΘZăZc pzq is elided with the same duces several observable properties of the present-day MW (Ta-
term as in Eq. 10. Eq. 8 becomes ble 3). In this model the authors incorporated the bulge, which
ż instead was neglected in the 2006 version of the model (Naab
1 & Ostriker 2006). In the following we summarize this galaxy
Ppd, z | Rq “ Σ‹ pR, zq fsSFR pR, zq fFe pR, zq da. (12)
M‹ pzq S model.
The progenitor difference of SGRBs and LGRBs accounts Naab & Ostriker (2009) assumed that the formation and evo-
for the preference of LGRBs to reside in environments of high lution of MW proceeds in two phases. In the first phase (i.e., for
star formation and low metallicity. Conversely, there is no ev- cosmic time tA&A proofs: manuscript no. 39507corr
Fig. 3. Star formation surface density as a function of the galactocentric Fig. 4. Metallicity as a function of the galactocentric radius R and look-
radius R and lookback time. The color-coding (left color bar) is on a back time. The shaded regions (left color code) represent Z{Zd on a
logarithmic scale and in units of Md pc´2 Gyr´1 . logarithmic scale.
Propriety Value
M‹ 5 ˆ 1010 Md
dΣ‹ pR, zq “ `ΣSFR pR, zqdz ´ Kins pR, zqdz` Mgas 1 ˆ 1010 Md
´Klate pR, zqdz.
(18) Σ‹,d 35 Md pc´2
Σg,d 15 Md pc´2
In order to account for the different star formation histories of SFR 3 Md yr´1
bulge and disk, a formulation derived by Kennicutt (1998) based
Table 3. Present-day Milky Way proprieties reproduced by model: total
on the local dynamical time (rotation period) of the system is mass in stars, total mass in gas, stellar surface density at the solar radius,
assumed, that is, gas surface density at the solar radius, and global SFR.
Σg pR, zq
ΣSFR pR, zq “ , (19)
τpR, zq
suggest, close-orbit giants form in metal-enriched environments,
where “ 0.1 is the star formation efficiency and τpR, zq “ while in a very low metallicity environment, planet formation is
2πR{vpR, zq the orbital period, with v as the local circular ve- inhibited. The model, based on the assumption that close-orbit
locity. Because of smaller radii, higher gas surface density, and giants destroy the prospect of harboring TPs, assumes that the
higher circular velocity, the star formation in the bulge is ini- probabilities of forming TPs (PFTP ) and close-orbit giants (PFG )
tially very high (Fig.3), and most of its initial gas reservoir is are functions of the metallicity of the environment. Following
then rapidly consumed. Lineweaver et al. (2004), the probability for a star to harbor a TP
Fig.3 shows the SFR surface density as a function of the is defined as
position within the Galaxy (i.e., galactocentric radius R) versus
lookback-time. The density contours clearly show the increase
in SFR surface density from the inner part of the Galaxy toward PHTP “ PFTP p1 ´ PFG q. (20)
the peripheral regions (inside-out star formation): while the in- Zackrisson et al. (2016) approximated the probability of
nermost part of the Galaxy shows little evolution of the star for- forming close-orbit giants as a function of the metallicity rFe{Hs
mation after the early stage, the outskirts experienced an increase and of the stellar mass M‹ (Gaidos & Mann 2014),
by several orders of magnitude. Fig. 4 shows the evolution over
cosmic time of the radial profile of the metallicity (on a lorgarith-
mic scale; left color bar). Consistently with the increase in star PFG prFe{Hs, M‹ q “ f0 10arFe{Hs M‹b , (21)
formation in the MW outskirts, the metallicity at larger distances
from the Galaxy center also increased over the last Gyr. where f0 “ 0.07 is a constant factor and the parameter values are
a “ 1.8p1.06q for FGK (M) stars and b “ 1 (Gaidos & Mann
2014). The probability of forming TPs is (Zackrisson et al. 2016)
3.6. Planetary formation
TPs are typically defined as having a solid surface with radius PFTP “ fTP kpZq, (22)
and mass in the ranges 0.5´2.0RC and 0.5´10MC , respectively
(where RC and MC are the radius and mass, respectively, of with fTP “ 0.4p1q for FGK (M) stars. kpZq is a function with a
Earth). TPs might develop habitable conditions (Alibert 2014). cutoff at low-metallicity values,
In order to estimate the surface number density of TPs within $
the MW as a function of cosmic time and galactocentric dis- &0 if [Fe/H] ă -2.2
Z´0001
tance, we adopted the model of Zackrisson et al. (2016). As kpZq “ 0.001´0.0001 if -2.2 ď [Fe/H] ď -1.2
%
simulations and observations (radial velocity and transit surveys) 1 if [Fe/H] ą -1.2.
Article number, page 6 of 11R. Spinelli et al.: The best place to live in the Milky Way
Combining these equations with the Galaxy model of Naab
& Ostriker (2009) (§3.2), we can compute PHTP pR, tq accounting
for the metallicity radial distribution and its evolution within the
Galaxy. The number surface density of TPs as function of time in
the MW was computed using the star formation surface density
derived in §3.2 and assuming a Salpeter initial mass function: we
computed the fraction of M stars fM (with masses in the range
0.1-0.6 M@ ) and FGK stars fFGK (with masses in the range 0.6-
1.2 M@ ). Assuming an average mass for M stars of 0.35 M@ and
0.9 M@ for FGK stars, we derived the number surface density of
TPs around M and FGK stars with the following equation:
f ΣSFR pR, zqPHTP pR, tq
żz
ΣTP pR, zq “ dz, (23)
zform ăMą
where zform “ 3 is the formation redshift of the MW in the
model of Naab & Ostriker (2009).
Fig. 5. Number of lethal astrophysical transient events (solid red line)
4. Results in the past 500 Myr as a function of distance from the Galactic center.
The individual contributions of SGRBs (solid green line), LGRBs (solid
Figure 5 shows the number of lethal astrophysical transient yellow line) and SNe (solid orange line) are shown. The surface number
events in the past 500 Myr as a function of distance from the density of TPs around M stars (dashed dark blue line) and around FGK
Galactic center. At the position of Earth (8 kpc, vertical solid stars (dashed light blue line) are reported (left vertical axis). The vertical
black line), the number of lethal events (predominantly LGRBs) solid black line at 8 kpc marks the position of the Solar System at which
the total number of lethal events (predominantly LGRBs) is „1.3.
is about one to two within the past 500 Myr. This agrees with the
hypothesis ascribing the Ordovician mass-extinction event to a
LGRB (Melott et al. 2005). The minimum in the solid red line number of lethal events toward the Galaxy periphery (red to or-
(i.e., LGRBs+SGRBs+SNe) identifies a region between „2 and ange contours in Fig. 7). This is due to the increased conversion
„8 kpc from the Galaxy center in which life in the past 500 Myr rate of gas relatively little polluted by metal into massive stars
might have experienced ď1 lethal events. In the outskirts (Rą10 in the outer regions of the MW. This global trend determined the
kpc) and in the center (Ră1.5 kpc) of the MW the number of formation of an increasingly larger, safer region of the MW lo-
lethal event is ą2. In the outskirts of the Galaxy, the predomi- cated at intermediate galactocentric distances R P p2 ´ 8q kpc. In
nant lethal events are LGRBs because of the low metallicity in this second green valley, the main contribution of lethal events
the environment, while in the star-forming of the center, SGRBs is still due to LGRBs, but the increase in metallicity due to the
and SNe occur predominantly. The outskirts of the MW are not intense star formation suppresses the incidence of LGRBs. The
favored to host life because only a few TPs are located there higher density of TPs in this region makes it the most favorable
(dashed lines) and because lethal LGRBs are very frequent. region in the Galaxy for the development and resilience of life to
Figure 6 shows the number of lethal events ozone depletion induced by transient astrophysical events in the
(SGRBs+LGRBs+SNe) in bins of 500 Myr as a function last 4 Gyr. In general, the early stages of the MW evolution (from
of the distance from the Galactic center (x-axis) throughout the its formation until 6 billion years ago) witnessed extremely poor
cosmic history of the Milky Way (y-axis). The line contours conditions for life development because lethal events occurred
(corresponding to the blue-scale color bar) show the surface throughout almost the entire Galactic disk (R ă 10 ´ 12 kpc), in
number density of TPs around M stars (solid lines) and FGK which TPs are present in a considerable number.
stars (dashed lines). Although it is not clear how many mass extinctions can pre-
The individual contributions of SNe, SGRBs and LGRBs to vent the habitability of a planet, based on what happened to
Fig.6 are show in Fig.7 and Fig.8. SGRBs and SNe (Fig.8) are Earth, we consider that one lethal event within 500 Myr at most
concentrated in the central regions of the Galaxy because the is a conservative tolerable rate of lethal events for life as we
stellar density is high and their occurrence is independent of know it to survive. The number of terrestrial potentially habit-
the metallicity of the environment. On the other hand, the in- able planets orbiting M and FGK stars as a function of Galacto-
cidence of LGRBs as lethal events (Fig.7) develops throuhout centric distance and cosmic time is shown in fig. 9 and fig. 10,
the MW history with an inside-out pattern: They dominate the respectively. We first calculated the probability of having fewer
rate of lethal events at the early stages of the MW evolution in than two life-threatening events in 500 Myr as a Poisson distri-
the central regions, where most of the stars are formed, but are bution, with mean the number of lethal events/500 Myr shown in
progressively suppressed by the increase in metallicity, and they Fig 6, and then multiplied by the number of TPs around M and
become more prominent in the outskirts where the star formation FGK stars, obtained by integrating the planet surface density in
is relatively higher and the metal pollution is not yet high. annuli of constant width “ 1 pc.
There are two so-called green valleys within the MW disk
and its cosmic history. The first is in the outer regions of the disk
(i.e., R ą 12 kpc) that experienced a relatively low incidence of 5. Discussion
lethal events during the first 6 Gyr of Galaxy evolution. This re-
gion has the lowest TP surface density, however. Starting about We measured the lethal power of the three classes of tran-
6 Gyr ago, LGRBs became the dominant lethal sources for life sients considered from their energetics, event rates, and the sur-
within the MW because of their energetics, with an increasing face density of TPs in the MW. We found that LGRBs are the
Article number, page 7 of 11A&A proofs: manuscript no. 39507corr Fig. 6. Number of lethal events per bins of 500 Myr as a function of the Galactic radius and loockback time. Shaded contours (corresponding to the green, yellow, and red color bar) show the number of lethal events (SSGRBs+LGRBs+SNs) per 500 Myr as a function of the distance from the Galactic center (x-axis) throughout the cosmic history of the Milky Way (y-axis). The line contours (corresponding to the blue-scale color bar) show the surface number density of TPs around M stars (solid lines) and FGK stars (dashed lines). The current position of the Solar System is marked by the yellow dot. The Galaxy disk portion that extends „2 and „8 kpc away from the Galaxy center, where the TP density is relatively higher, represents the place in which life in the past 4 Gyr might have experienced less frequent major damages as a result of ozone depletion induced by transient astrophysical events. Fig. 7. Number of lethal LGRBs per bins of 500 Myr as a function of Fig. 8. Number of lethal SGRBs and SNe per bins of 500 Myr as a the Galactic radius and lookback time. function of the Galactic radius and lookback time. dominant life-threatening transients for planets at R ą 2 kpc 5.1. Transients throughout the entire cosmic history of the MW (Fig.7). This is mainly due to their high energy (1051´54 ergs, isotropic equiv- The fluence threshold we considered harmful for life (i.e., & 108 alent), which compared to the energy of SNe compensates for erg cm´2 ” 100 kJ m´2 ) would induce a » 90% depletion their lower intrinsic rate. Instead, SGRBs (which compete with of the ozone layer. This reduction can trigger mass extinctions LGRBs in terms of energetics) and SNe dominate the counts of (Thomas et al. 2005a). The choice of the threshold value af- hazardous transients in the central regions of the MW, especially fect the estimate of the rate of lethal events, but not on their during the earliest evolution (Fig. 8), because their occurrence is spatial and temporal trends within the MW. If we were to con- mainly driven by stellar density and SFR. We discuss the effect sider the lower threshold fluence of 10 kJ m´2 (able to induce of the many assumptions we made in our analysis in this section. a 68% depletion of the ozone layer), for example, then there Article number, page 8 of 11
R. Spinelli et al.: The best place to live in the Milky Way

                                                                                                       0.3 Zd    0.4 Zd     0.5 Zd
                                                                                            8 kpc        1.5       1.2        1.0
                                                                                            17 kpc       2.9       5.3        7.4
                                                                             Table 4. Number of lethal LGRBs at 8 kpc and at 17 kpc in the past 500
                                                                             Myr considering different metallicity thresholds.

                                                                             low-luminosity SGRBs would be higher. These events, however,
                                                                             are characterized by relatively short hazard distances (Eq. 4) and
                                                                             our results would be practically unaltered.
                                                                                 We linked the LGRB and the formation rate of TPs to the
                                                                             metallicity evolution within the MW. We considered that LGRBs
                                                                             preferably form in evironments with Z ă 0.4Zd (Bignone et al.
                                                                             2017, 2018). Assuming a different metallicity threshold (Tab. 4)
                                                                             mainly affects the rate of lethal LGRBs in the outer regions of
                                                                             the Galaxy, where the metallicity is indeed close to the threshold
                                                                             we did adopt.

Fig. 9. Number of TPs around M stars that experienced fewer than two
                                                                                 We did not take the effect of cosmic rays into account. In
lethal events in 500 Myr. The number is obtained from the surface den-       a recent work, Marshall et al. (2020) suggested that the moder-
sity of planets integrated in annuli of constant width (“ 1 pc).             ate extinction event at the end of the Devonian period (Hangen-
                                                                             berg event, „360 Myr) was associated with ozone depletion
                                                                             and a consequent higher solar UV-B radiation on Earth. This
                                                                             may explain the discovery of malformed land-plant spores in
                                                                             terrestrial Devonian-carboniferous boundary sections from East
                                                                             Greenland. Although a GRB cannot be excluded as the cause of
                                                                             this extinction event, Fields et al. (2020) proposed cosmic rays,
                                                                             accelerated in a nearby SN and magnetically confined inside the
                                                                             SN remnant for „100 kyr, as the trigger of the ozone-layer de-
                                                                             pletion followed by the Devonian extinction.

                                                                             5.2. UV flash

                                                                             An effect we did not explicitly consider is the effect caused by
                                                                             UV flashes. Galante & Horvath (2007) and Martín et al. (2009)
                                                                             suggested that the UV flash resulting from the transmission of
                                                                             the γ-rays through the atmosphere could have important short-
                                                                             term effects on life forms, especially for planets with thin atmo-
                                                                             spheres. In contrast, Thomas (2009) argued that only long-term
                                                                             and extended effects on Earth-like life forms caused by ozone-
                                                                             layer depletion can trigger biological catastrophes of the type
                                                                             we considered here. A UV flash is indeed a very short-lived phe-
Fig. 10. Same as fig. 9, but for FGK stars.                                  nomenon, occurring on the timescale of the γ–ray event („1 s
                                                                             and 10 s for SGRB and LGRB, respectively), and it is local-
would be lethal events at larger distances, hence increasing the             ized on half of the planet surface. However, a short but strong
total rate at any R and at any time. In contrast, a higher thresh-           kick could be much more harmful than constant pressure over
old fluence of 1000 kJ m´2 (98% depletion of the ozone layer),               years, such as that caused by the depletion of the ozone layer.
for instance, would select only the most powerful transients                 Moreover, a UV flash (1-10 s) and ozone depletion (10 yr) are
that explode closer to any given planet. These events are rela-              essentially instantaneous compared to the ecological timescales
tively rare given the corresponding steep luminosity function of             of recovery after extinctions (Kirchner & Weil 2000).
LGRBs and SGRBs. The threshold adopted in our study is higher                     Rodríguez-López et al. (2020) showed that a UV flash can re-
than the lethal dose typically considered for Earth biota, that              duce a significant fraction (20-60%) of phytoplankton biomass,
is, 105 erg cm´2 for eucaryotic multicellular lifeforms (Scalo               the very basis of the ocean food chain and oxygen production.
& Wheeler 2002) and 107 erg cm´2 for prokaryotic microbes                    To estimate the UV flash effect, they considered an event able to
(Balbi & Tombesi 2017). This allowed us to extend our results                hit the top of the atmosphere with a γ-ray fluence of 100 kJ/m2 .
also to planets without an ozone layer.                                      Because this is the same critical fluence we assumed in our work,
    The lethal impact of SGRB, which dominate the central re-                this effect of a UV flash can be added to that of the ozone-layer
gions of the Galaxy (Fig.8), was computed assuming the lumi-                 depletion. If a lower γ-ray fluence at the top of the atmosphere
nosity function derived by Ghirlanda et al. (2016). Alternatively,           produces an UV flash that can trigger a mass extinction, the to-
if we had considered a steeper faint-end of the SGRB luminos-                tal rate of lethal events increases, but their spatial and temporal
ity function (such as in Wanderman & Piran 2015), the rate of                distribution within the MW (Fig. 6) remains unchanged.
                                                                                                                      Article number, page 9 of 11
A&A proofs: manuscript no. 39507corr
5.3. Planets in the central regions of the Galaxy. Searches for exoplanets har-
boring life forms probably will have more chances of success in
As suggested by O’Neill et al. (2020), planets forming early on the direction of the Galactic center, within 5 kpc from the Sun,
in the MW history tend to have low Fe/Si ratios and thus strong because of the combined effect of a high density of TPs (dashed
activity of the tectonic plates, which appears to be an important line in Fig.5) and of the low occurrence of lethal transients (solid
factor for the development of life as we know it. However, as red line in Fig.5).
we showed, planets were subject to a very high rate of possibly We identify two green valleys within the MW disk and its
lethal events at the early stages of the Galaxy. cosmic history (Fig.6). The first is located in the outskirts of the
The adopted planet formation model (Zackrisson et al. 2016) galactic disk (i.e., R ą 12 kpc). These regions experienced a
implies that gas giants with orbital period . 2 yr (i.e., warm and relatively low incidence of lethal events during the first 6 Gyr of
hot Jupiters, see Gaidos & Mann 2014) hinder the presence of the Galactic evolution. However, the probability that life would
TPs. However, this assumption is likely to overstate the effect of emerge is hampered by the the low TP surface density. The other
close-orbit giants on TPs, as there are examples of warm Jupiters green valley is located at intermediate galactocentric distances
in systems with rocky members (Steffen et al. 2012; Huang et al. R P p2´8q kpc. Here the dominant lethal transients were LGRBs
2016). Our estimate of the surface density of TPs should there- until 7-6 Gyr, but later on, the progressive increase in metallicity
fore be regarded as a lower limit. due to the intense star formation suppressed the lethal incidence
of LGRBs. The higher density of TPs in this region makes it the
5.4. The Galaxy most favorable place of the Galaxy for the resilience of life to
mass extinction induced by transient astrophysical events over
The Naab & Ostriker galaxy model does not take any azimuthal the last „4 Gyr. The inner region of the MW hosts most of the
inhomogeneities into account. The innermost regions could be planets with the lowest probability to be at danger distance from
even more unfavorable to life if a galactic bar were present that more than one lethal event every 500 Myr (Fig 9 and Fig 10).
would enhance the rate of lethal events (Fig 6, R< 4 kpc). The This is due to the high stellar density and high metallicity, which
same applies to the regions contained within the spiral arms. inhibits the formation of LGRBs. This result is in agreement with
Neglecting the distinction between thin- and thick-disk stars Gowanlock & Morrison (2018).
is highly justified in our study, as the thick disk accounts for In conclusion, the most powerful cosmic explosion jeopar-
»10% of the stars in our galaxy, predominantly low-mass stars dized life within most of the Milky Way in the past, but no
that do not produce the dominant lethal events (CCSNe and longer. In particular, until „6 Gyr ago, the entire Galaxy was
LGRBs). Moreover, the range (a few kiloparsec) of the domi- very frequently sterilized by transient events. At the early stage
nant lethal events in the disk (led by LGRBs) is larger than the of the Galaxy evolution, life as we know it must have been more
average thickness of the thick disk, and the segregation in metal- resilient to high radiation irradiance in order to survive. When
licity between thick- and thin-disk stars (Yan et al. 2019) is likely we exclude the green valley at the bottom right side of Fig. 6,
marginal in the probability of planet formation. which has the lowest TP surface density, the Galaxy overall is a
We did not consider other aspects that were investigated in safer place to live on a planet today than it was in the past. When
recent works in the context of Galactic habitability. For exam- we assume that the Sun did not significantly migrate along the
ple, the combined action of tidal disruption events (Pacetti et galactocentric radius during its lifetime, the Earth, from its birth
al. 2020) and the active phase of the central black hole (Balbi until today, experienced an ever lower rate of potential mass-
& Tombesi 2017) further reduce the habitability of the bulge. extinction events and gradually became an increasingly safer
Moreover, a detailed evaluation of the habitability of the bulge place.
should also account for the relatively higher probability of stel- Finally, we note that the very existence of life on planet Earth
lar encounters that can perturb planetary orbital configuration, today demonstrates that mass extinctions do not necessarily pre-
but on the other hand, also favor lithopanspernia (Melosh 1988; clude the possibility of complex life development. On the con-
Wesson 2010). trary, mass extinctions occurring at the right pace could have
played a pivotal role in the evolution of complex life forms on
our home planet (Sepkoski 1985; Raup 1994; Jablonski 2001;
Krug & Jablonski 2012; Stroud & Losos 2016).
6. Conclusions
Acknowledgements. R.S. acknowledges the Brera Observatory for the kind hos-
We have investigated the impact of the most energetic transient pitality during the completion of this work. The authors thank F. Borsa for useful
events on planetary habitability inside the MW and throughout discussions. Funding support is acknowledged from Prin-INAF 1.05.01.88.06
its cosmic history. We considered LGRBs, SGRBs, and SNe (Ia, “Towards the SKA and CTA era: discovery, localisation, and physics of tran-
sient sources”; 1.05.06.13 Premiale 2015 “FIGARO”; Accordo Attuativo ASI-
Ibc, and IIp). These are the most energetic transients and can INAF n.2017-14-H.0. We acknowledge support from PRIN-MIUR 2017 (grant
irradiate a planetary atmosphere with a γ-ray fluence & 100 kJ 20179ZF5KS).
m´2 (108 erg cm´2 ). Our main results are summarized below.
We confirmed that at the position of Earth, one LGRB may
have occurred within the past 500 Myr. This may have played a
leading role in the Ordovician mass extinction. References
We demonstrated that the evolutionary pressure due to the Abbott, B. P., Abbott, R., Abbott, T. D., et al. 2017, Phys. Rev. Lett., 119, 161101
considered astrophysical events is not negligible during the evo- Abbott, B. P., Abbott, R., Abbott, T. D., et al. 2017, Phys. Rev. Lett., 119, 141101
Alibert, Y. 2014, A&A, 561, A41
lution of our Galaxy. The safest zone in the past 500 Myr is Balbi, A. & Tombesi, F. 2017, Scientific Reports, 7, 16626
within about 2-8 kpc. Different from what has been claimed in Barris, B. J., Tonry, J. L., Blondin, S., et al. 2004, ApJ, 602, 571
recent works, we find that the outskirts are not favored to host Bertelli, G., Bressan, A., Chiosi, C., et al. 1994, A&AS, 106, 275
life because they host few TPs (dashed lines in Fig.5) and many Bignone, L. A., Tissera, P. B., & Pellizza, L. J. 2017, MNRAS, 469, 4921
Bignone, L. A., Pellizza, L. J., & Tissera, P. B. 2018, New A, 65, 73
lethal LGRBs, which hinders the emergence of a long-lasting Botticella, M. T., Riello, M., Cappellaro, E., et al. 2008, A&A, 479, 49
biosphere. SGRBs and SNe are the dominant lethal events only Campana, S., Mangano, V., Blustin, A. J., et al. 2006, Nature, 442, 1008
Article number, page 10 of 11R. Spinelli et al.: The best place to live in the Milky Way
Cappellaro, E., Evans, R., & Turatto, M. 1999, A&A, 351, 459 Soderberg, A. M., Berger, E., Page, K. L., et al. 2008, Nature, 453, 469
Dar, A., Laor, A., & Shaviv, N. J. 1998, Phys. Rev. Lett., 80, 5813 Sparre, M., Sollerman, J., Fynbo, J. P. U., et al. 2011, ApJ, 735, L24
Daigne, F., Rossi, E. M., & Mochkovitch, R. 2006, MNRAS, 372, 1034 Spitoni, E., Matteucci, F., & Sozzetti, A. 2014, MNRAS, 440, 2588
D’Avanzo, P., Salvaterra, R., Bernardini, M. G., et al. 2014, MNRAS, 442, 2342 Spitoni, E., Gioannini, L., & Matteucci, F. 2017, A&A, 605, A38.
Fields, B. D., Melott, A. L., Ellis, J., et al. 2020, arXiv:2007.01887 doi:10.1051/0004-6361/201730545
Firmani, C., Avila-Reese, V., Ghisellini, G., et al. 2004, ApJ, 611, 1033 Stanek, M. J. 2003, Acoustical Society of America Journal, 113, 1788
Fruchter, A. S., Levan, A. J., Strolger, L., et al. 2006, Nature, 441, 463 Steffen, J. H., Ragozzine, D., Fabrycky, D. C., et al. 2012, Proceedings of the
Gaidos, E. & Mann, A. W. 2014, ApJ, 791, 54 National Academy of Science, 109, 7982. doi:10.1073/pnas.1120970109
Galama, T. J., Vreeswijk, P. M., van Paradijs, J., et al. 1998, Nature, 395, 670 Stroud J.T. & Losos, J.N. 2016, Annual Review of Ecology, Evolution, and Sys-
Galante, D. & Horvath, J. E. 2007, International Journal of Astrobiology, 6, 19. tematics, 47, 507-532
doi:10.1017/S1473550406003545 Svensmark, H. 2012, MNRAS, 423, 1234
Gallazzi, A., Brinchmann, J., Charlot, S., et al. 2008, MNRAS, 383, 1439 Thomas, B. C., Jackman, C. H., Melott, A. L., et al. 2005, ApJ, 622, L153
Gehrels, N., Laird, C. M., Jackman, C. H., et al. 2003, ApJ, 585, 1169 Thomas, B. C., Melott, A. L., Jackman, C. H., et al. 2005, ApJ, 634, 509
Ghirlanda, G., Salafia, O. S., Pescalli, A., et al. 2016, A&A, 594, A84 Thomas, B. C. 2009, International Journal of Astrobiology, 8, 183.
Gowanlock, M. G., Patton, D. R., & McConnell, S. M. 2011, Astrobiology, 11, doi:10.1017/S1473550409004509
855 Thorsett, S. E. 1995, ApJ, 444, L53
Gowanlock, M. G. 2016, ApJ, 832, 38 Vergani, S. D. 2018, Mem. Soc. Astron. Italiana, 89, 175
Gowanlock, M. G. & Morrison, I. S. 2018, arXiv:1802.07036 Virgili, F. J., Zhang, B., Nagamine, K., et al. 2011, MNRAS, 417, 3025
Guetta, D. & Piran, T. 2005, A&A, 435, 421 Vukotić, B., Steinhauser, D., Martinez-Aviles, G., et al. 2016, MNRAS, 459,
Guetta, D. & Piran, T. 2006, A&A, 453, 823 3512
Guetta, D. & Della Valle, M. 2007, ApJ, 657, L73
Wanderman, D. & Piran, T. 2010, MNRAS, 406, 1944
Hatano, K., Fisher, A., & Branch, D. 1997, MNRAS, 290, 360
Wanderman, D. & Piran, T. 2015, MNRAS, 448, 3026
Heger, A., Fryer, C. L., Woosley, S. E., et al. 2003, ApJ, 591, 288
Webbink, R. F. 1984, ApJ, 277, 355
Herrmann, A.D., & Patzkowsky, M.E. (2002) Astrobiology 2, 560-561
Herrmann, A. D., Patzkowsky, M. E., & Pollard, D. 2003, Geology, 31, 485 Wesson, P. S. 2010, Space Sci. Rev., 156, 239
Hjorth, J., Sollerman, J., Møller, P., et al. 2003, Nature, 423, 847 Woosley, S. E., Langer, N., & Weaver, T. A. 1993, ApJ, 411, 823
Höflich, P. & Schaefer, B. E. 2009, ApJ, 705, 483 Woosley, S. E. 1993, ApJ, 405, 273
Hopkins, A. M. & Beacom, J. F. 2006, ApJ, 651, 142 Woosley, S. E. & Heger, A. 2006, ApJ, 637, 914
Huang, C., Wu, Y., & Triaud, A. H. M. J. 2016, ApJ, 825, 98. doi:10.3847/0004- Xu, D., de Ugarte Postigo, A., Leloudas, G., et al. 2013, ApJ, 776, 98
637X/825/2/98 Yasuda, N. & Fukugita, M. 2010, AJ, 139, 39
Jablonski, D. 2001, PNAS, 98, 5393-5398 Yoon, S.-C., Langer, N., & Norman, C. 2006, A&A, 460, 199
Japelj, J., Vergani, S. D., Salvaterra, R., et al. 2016, A&A, 590, A129 Zackrisson, E., Calissendorff, P., González, J., et al. 2016, ApJ, 833, 214
Kasting, J. F., Whitmire, D. P., & Reynolds, R. T. 1993, Icarus, 101, 108
Kennicutt, R. C. 1998, ApJ, 498, 541
Kirchner, J. W. & Weil, A. 2000, Nature, 404, 177. doi:10.1038/35004564
Kistler, M. D., Yüksel, H., Beacom, J. F., et al. 2009, ApJ, 705, L104
Kopparapu, R. K., Ramirez, R., Kasting, J. F., et al. 2013, ApJ, 765, 131
Kouveliotou, C., Meegan, C. A., Fishman, G. J., et al. 1993, ApJ, 413, L101
Krug, A. Z. & Jablonski, D. 2012, Geology, 40, 731
Le Floc’h, E., Charmandaris, V., Forrest, W. J., et al. 2006, ApJ, 642, 636
Li, Y. & Zhang, B. 2015, ApJ, 810, 41
Li, W., Leaman, J., Chornock, R., et al. 2011, MNRAS, 412, 1441
Lineweaver, C. H., Fenner, Y., & Gibson, B. K. 2004, Science, 303, 59
MacFadyen, A. I. & Woosley, S. E. 1999, ApJ, 524, 262
Madau, P. & Dickinson, M. 2014, ARA&A, 52, 415
Malesani, D., Moretti, A., Romano, P., et al. 2005, GRB Coordinates Network,
Circular Service, No. 3087, #1 (2005), 3087
Maoz, D. & Mannucci, F. 2012, PASA, 29, 447
Marshall, J. E. A., Lakin, J., Troth, I., et al. 2020, Science Advances, 6, eaba0768
Martín, O., Galante, D., Cárdenas, R., et al. 2009, Ap&SS, 321, 161.
doi:10.1007/s10509-009-0037-3
Melandri, A., Pian, E., Ferrero, P., et al. 2012, A&A, 547, A82
Melosh, H. J. 1988, Nature, 332, 687
Melott, A. L., Thomas, B. C., Hogan, D. P., et al. 2005, Geophys. Res. Lett., 32,
L14808
Melott, A. L. & Thomas, B. C. 2011, Astrobiology, 11, 343
Mortlock, A., Conselice, C. J., Hartley, W. G., et al. 2015, MNRAS, 447, 2
Naab, T. & Ostriker, J. P. 2006, MNRAS, 366, 899
Naab, T. & Ostriker, J. P. 2009, ApJ, 690, 1452
Nakar, E. & Gal-Yam, A. 2005, American Astronomical Society Meeting Ab-
stracts
Ostriker, J. P. & Tinsley, B. M. 1975, ApJ, 201, L51
O’Neill, C., Lowman, J., & Wasiliev, J. 2020, Icarus, 352, 114025
Pacetti, E., Balbi, A., Lingam, M., et al. 2020, MNRAS,
doi:10.1093/mnras/staa2535
Palmerio, J. T., Vergani, S. D., Salvaterra, R., et al. 2019, A&A, 623, A26
Pescalli, A., Ghirlanda, G., Salvaterra, R., et al. 2016, A&A, 587, A40
Pian, E., Mazzali, P. A., Masetti, N., et al. 2006, Nature, 442, 1011
Piran, T. & Jimenez, R. 2014, Phys. Rev. Lett., 113, 231102
Pescalli, A., Ghirlanda, G., Salvaterra, R., et al. 2016, A&A, 587, A40
Raup, D.M. 1994, PNAS, 91, 6758-6763
Ruderman, M. A. 1974, Science, 184, 1079
Richardson, D., Branch, D., Casebeer, D., et al. 2002, AJ, 123, 745
Rodríguez-López, L., Cardenas, R., González-Rodríguez, L., et al. 2020,
arXiv:2011.08433
Salvaterra, R., Campana, S., Vergani, S. D., et al. 2012, ApJ, 749, 68
Scalo, J. & Wheeler, J. C. 2002, ApJ, 566, 723
Schawinski, K., Justham, S., Wolf, C., et al. 2008, Science, 321, 223
Sepkoski, J. J. 1985, The Search for Extraterrestrial Life: Recent Developments,
112, 223
Article number, page 11 of 11You can also read