The bicycle capitals of the world:
 Amsterdam and Copenhagen
←
→
Page content transcription
If your browser does not render page correctly, please read the page content below

The bicycle capitals of the world:
 Amsterdam and Copenhagen
The bicycle capitals of the world: Amsterdam and Copenhagen
Contents

          Preface                                                                             5

    1     Introduction                                                                        7
    1.1   Continuous and integral municipal bicycle policies                                  7
    1.2   Cycling cities in Europe                                                           10

    2     Copenhagen: city (full) of bicycles                                                14

    3     Amsterdam: the blessings of bicycles                                               30

4                                                              Fietsberaad Publication number 7A
Preface

This special Fietsberaad-publication 7A is specially issued for the occasion of the Velo-city
2010 conference in Copenhagen. This is an excerpt of Fietberaad-publication 7: “Bicycle
policies of the European principals:continuous and integral” and it comprises the Introduction
and the chapters on Copenhagen and Amsterdam from this publication.

To download the complete Fietsberaad-publication 7 and find a lot of extra knowledge and
experience on bicycle policy surf to www.fietsberaad.org.

Fietsberaad Publication number 7A                                                                5
6 Fietsberaad Publication number 7A
1.    Introduction

      ‘Continuous’ and ‘integral’. These two words together reflect the essence of explanations for
      high degrees of bicycle use at a local level, as has become apparent from various studies in
      recent years. Continuous, consistent bicycle policies. Policies incorporated into a wider policy
      context of locally deeply-felt objectives.

1.1   Continuous and integral municipal bicycle policies

      Continuous
      The above-mentioned words, with the emphasis on continuous, have already been the sub-
      ject of a 1999 study by Stichting Historie der Techniek (SHT), attempting to explain differences
      in the development of bicycle use in a number of European cities. In this study giving bicycle
      use a long-term and, in retrospect, mature place in traffic policy early on is considered to be
      an important explanation for the fairly exceptional development of bicycle use in the Nether-
      lands, compared to cities in neighbouring European countries.

       Albert de la Bruhèze, A.A. and F.C.A. Veraart (Stichting Historie der Techniek), Fietsverkeer
       in praktijk en beleid in de twintigste eeuw. Overeenkomsten en verschillen in fietsgebruik
       in Amsterdam, Eindhoven, Enschede, Zuidoost-Limburg, Antwerpen, Manchester,
       Kopenhagen, Hannover en Basel, RWS-publicatie 63, April 1999.

      For this historical research three cities in the Netherlands have been studied with a relatively
      high degree of bicycle use (Amsterdam, Eindhoven and Enschede) as well as an urban area
      with a low degree of bicycle use (Zuidoost-Limburg: Kerkrade-Heerlen). In neighbouring
      countries five cities were studied: cycling town Copenhagen, Manchester (where bicycles are
      absent) and Antwerp, Basel and Hannover, that are intermediate between the two in bicycle
      use.

      Reconstructed trend lines of bicycle percentages in total number of trips by car, bicycle, moped
      and public transport, 1920-1995 (in %)

      The curves in all nine trend lines are highly similar. From 1900 onwards the bicycle, initially a
      recreational vehicle for a small elite, very quickly became a utilitarian mass product for the
      middle and lower classes. All cities demonstrate, albeit to different degrees, a relatively high
      degree of bicycle use up until the 1950s. Differences in bicycle percentages among cities

      Fietsberaad Publication number 7A                                                                   7
before the Second World War bear little or no relation to the position of the automobile, but
    are correlated to the degree to which townspeople go on foot and in particular to the (early)
    development of a good public transport system (as was the case in Manchester). The sharp
    decline in bicycle use, particularly in the 1960s, is due to the rapid advance of the private car.
    From the 1970s onwards a stabilisation or renewed growth of bicycle use may be discerned
    everywhere.

    In addition to the general similarities in the trend lines in the figure strikingly demonstrates
    the differences. The SHT report draws the conclusion that the final differences between the
    cities in the 1990s can clearly be explained:
    • A high bicycle percentage (over 30%) for Amsterdam, Eindhoven, Enschede and
        Copenhagen, where a public transport system never developed that cannibalised bicycle
        use and where bicycles had always been a standard component of traffic policy:
        ‘Accepting the cyclist as a ‘normal’ traffic participant with equal rights in the 1950s and
        1960s has been (...) a crucial factor: the realisation of an infrastructure for cars does not
        occur at the expense of cyclists; the collective bicycle image is quite positive and above all
        else ‘rational’’
    • An average bicycle percentage (approx. 20%) for Zuidoost Limburg and Hannover. Here
        the advance of the car led to a more distinctly pro-car policy and an urban planning that
        was more focused on cars.
    • A low bicycle percentage (approx. 10% or less) in Antwerp, Manchester and Basel, where
        the strong influence of an early and highly functional public transport system (Manchester)
        as well as car-oriented traffic policies provide the explanation: ‘The decline caused by the
        arrival of the private car continues continuously and without obstructions, as all relevant
        factors of influence are pointing in the same direction: a negative collective image, a
        highly car-focused policy, implementation of large-scale car infrastructure, strong sub-
        urbanisation (...).’

                                                                                                                  photo : Philips concernarchief

    Eindhoven, end of the working day at Philips factories at Emmasingel, 1939.

8                                                                                 Fietsberaad Publication number 7A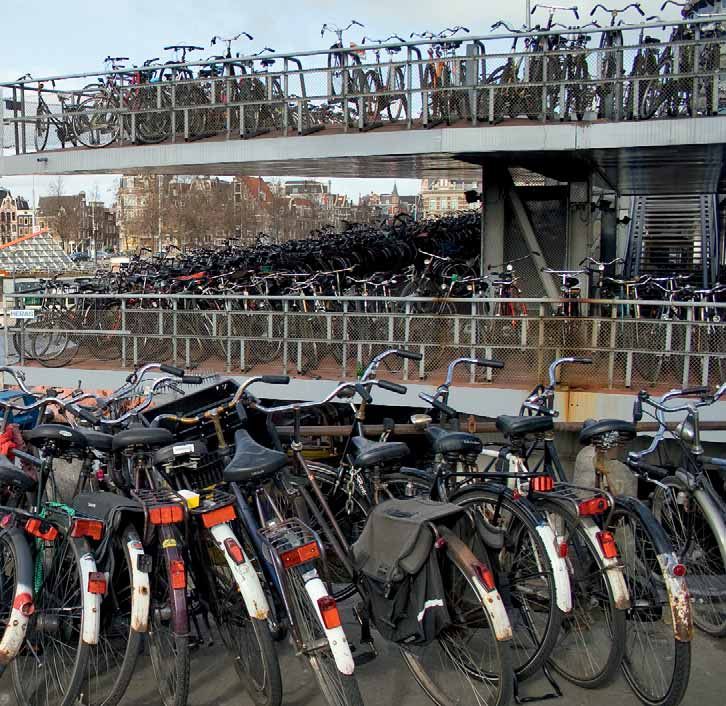
photo: Historisch-topografische Atlas Gemeentearchief Amsterdam
Amsterdam, Stadhouderskade with Overtoom to the right, February 1939.

The three cities with a relatively low percentage of bicycle use – Antwerp, Basel and
Manchester – have for decades conducted emphatic and explicit policies strongly aimed at
facilitating car use. These policies were based on socially supported ‘images’ representing the
future role of the bicycle as limited. From the 1950s onwards bicycle infrastructure was
actually ‘removed’: bicycle paths were turned into car lanes, bicycle lanes became parking
lanes. In Antwerp in 1939 cyclists were obliged to cycle one after the other, as they were felt
to take up too much space. In Basel the local council wrote in 1944: ‘Prinzipiell ist heute zu
sagen, daß in der eigentlichen Stadt Radfahrwege nicht mehr erwünscht sind.’ (‘As a matter of
principle it might be stated that nowadays bicycle paths are no longer advisable in the town.’)
Even worse: in 1951 the use of the public bicycle parking facilities was made obligatory, in
combination with a maximum length of stay of one to two hours!
This is in contrast to cities with a relatively high percentage of bicycle use: Amsterdam,
Eindhoven, Enschede and Copenhagen. There the actual traffic situation, including the role
played by the bicycle, remained the basis for policies, without any highly normative pre-
conceptions about the future. In the 1950s and 1960s most of the cities in the Netherlands
demonstrated at least a certain degree of tolerance of bicycle traffic in their traffic policies.
It is this acceptance of reality that even now is largely responsible for the constant, high
percentage of bicycle use in the Netherlands.

 Comparative bicycle history of Germany and the Netherlands
 In 2009 a thesis was published by the German scientist Anne-Katrin Ebert: Ein Ding der
 Nation: Das Fahrrad in Deutschland und den Niederlanden, 1880-1940. Ebert, too, describes
 divergent developments after the Second World War, among others the space allocated to
 cars in the reconstructed German cities, as opposed to the ancient inner cities in the
 Netherlands that were badly accessible to cars. Her main emphasis is however on the
 preceding decades, the First World War and the interbellum period. Even at that time, she
 states, the bicycle had become typical for the Netherlands. Ebert feels the explanation is
 primarily provided by the status of bicycle use. In the Netherlands the bicycle long
 remained a symbol of the middle class, whereas in Germany it soon became the means
 of transport for the lower classes. The position of the Dutch middle class was stronger
 anyway. The German middle class, after all, was stuck to a higher extent between the old
 aristocracy and the rapidly increasing working class in industrial Germany. A striking exam-
 ple is provided by the difference between the largest bicycle-promoting organisations.
 In the Netherlands ANWB was a bourgeois association with liberal and nationalistic values.
 In Germany Solidarität was the largest cycling union – a workers’ union.

Fietsberaad Publication number 7A                                                                                                              9
photo: Gemeentearchief Enschede
           Enschede, Hengelosestraat. Bicycle parking at the rear of V&D department store, 1939.

           Integral
           The emphasis on ‘integral’ traffic policy is readily apparent in recent studies attempting to
           statistically explain the differences in bicycle use between cities. On behalf of Fietsberaad
           Research voor Beleid has drawn up an explanatory model of municipal bicycle use in 2006,
           on the basis of previous attempts. The explanatory model, encompassing 11 different factors,
           has in statistical terms an R2 of 0.726, indicating its explanatory value. That means that
           almost 73% of the variance in bicycle use between cities is explained by these factors. That is
           very high and we may therefore consider this a model with a high explanatory value. More
           than one third of the explanatory value of this model is provided by the four factors represen-
           ting elements of ‘integral traffic policy’ (travel time ratio between bicycle and car, car parking
           fees, percentages of bus, tram, underground and surface built-up area).

1.2        Cycling cities in Europe

           The ten reports presented here are chiefly specifications of the general trend of ‘continuous’
           and ‘integral’. Each town has its own story, with a different emphasis due to particularly local
           circumstances. The similarities and differences between the ten reports will be analysed in
           more detail at the end of this publication, in chapter 12. Ten cities with respectable bicycle
           use.

           Often higher bicycle percentages are claimed. Upon closer examination, however, these only
           refer to local trips within municipal boundaries, or specific segments like commuter traffic.
           The table above and the national surveys below only provide data that are known to relate to
           the bicycle percentage in all trips (by inhabitants of the town or country concerned). These
           figures are derived from many sources; at least two per town (minor differences having been
           erased).

      10                                                                                      Fietsberaad Publication number 7A
Bicycle use in ten European ‘cycling cities’, in descending order of bicycle percentage
bicycle % in all
inhabitants inhabitants’ trips
Groningen 182.000 37%
Zwolle 116.000 36%
Münster 272.000 36%
Veenendaal 62.000 32%
Kopenhagen 502.000 32%
Enschede 154.000 31%
Amsterdam 747.000 28%
Odense 187.000 26%
Freiburg (im Breisgau) 218.000 22%
Gent 237.000 17%
The Netherlands, Denmark, Germany and Belgium are the countries with the highest bicycle
use in Europe. Within these countries, the ten cities discussed here really are foremost as
far as bicycle use is concerned. Bicycle use in these countries and cities is of an altogether
different level than elsewhere in Europe:
• In The Netherlands the bicycle percentage in the model split has been approx. 26% over
the last decades. The top cities score between 35% and 40%; cities with the lowest bicycle
use rank between 15% and 20%.
• In Denmark the bicycle percentage is between 15 and 20%. Differences in bicycle use
between the cities are relatively small; bicycle use in the cities is quite commonly at a
level of 20% of all trips. Only Odense and Copenhagen (far) surpass this: Odense approx.
26% and Copenhagen nearer to 32%.
• In Germany on average 10% of all trips are made by bicycle. The western federal states
have a higher average bicycle use, especially Nordrhein-Westfalen. Next to Münster and
Freiburg there are more cities with bicycle percentages between 20% and 30% there. In
other federal states bicycles are by no means absent either; Berlin for instance has a
bicycle percentage of approx. 10%.
• Belgium has an average bicycle percentage of not much more than 8%. Many cities in
Flanders approach the level of Ghent: somewhat over 15%. The town of Bruges even has
a slightly higher bicycle percentage.
For many European countries and cities low bicycle percentages certainly do not auto-
matically imply a high degree of car use. There are also large differences between coun-
tries and cities as far as numbers of pedestrians and particularly public transport users are
concerned. South European cities are often characterised by high ‘walking’ percentages,
for instance San Sebastian in Spain: 3% bicycle against ‘only’ 34% car, because public
transport plays an important role in San Sebastian (19%), but mainly walking - a striking
44% of all trips. London has a similar pattern, albeit slightly less extreme: only 1% bicycle,
as compared to 18% public transport and 37% walking, and therefore a mere 44% car.
The lowest car percentages are found in cities with relatively high scores for walking,
cycling and public transport. Many cities in Switzerland show a somewhat comparable
pattern: over 20% walking, over 10% bicycle and approx. 30% public transport – resulting
in a relatively low car use (approximately 30% in Basel, Bern and Zürich).
Although average bicycle use is much lower in other European countries, there are some
striking extremes:
• In Great Britain bicycle use is on average only 2% (London even slightly lower), but there
are several incidental cases with a much higher degree of bicycle use (York and Hull 11%,
Oxford and particularly Cambridge close to 20%). A similar pattern – even slightly more
extreme – can be discerned in Sweden and especially Italy.
Fietsberaad Publication number 7A 11Västerås
• Ireland scores 3% - 4%, with virtually no upward extremes (Dublin 5% at most).
• In Sweden bicycle use is on average 7% of all trips; for cities this is 10%. Peaks: Lund and
Malmö 20%. The small town of Västerås (115,000 inhabitants) has an incredible 33% bicycle
percentage according to a source quoted time and time again.
• In the Czech Republic, as in other Eastern European countries, there are a few cities with
some degree of bicycle use (Ostrava, Olomouc and Ceské Budejovice, between 5% and
10%) and some with an even higher bicycle use (Prostejov 20%). However, average use is
low: far below 5%.
• Austria has an average bicycle percentage of 9%, with Graz (14%) and Salzburg (19%) as
extremes.
• Switzerland scores approximately 11% for bicycle use, with several cities at a slightly
higher level, like Bern (15%), Basel (17%) and particularly Winterthur (approx. 20%).
• France has a low average bicycle use (5%), nor has it many extremes: Strasbourg 12%,
Avignon 10%.
• Although in Italy average bicycle use is as low as 5% , with Rome even far below 1%,
there are a number of striking exceptions. Especially the Po valley, with cities like Parma
(over 15%) and with Ferrara as the best-known extreme example: around 30% bicycle
percentage. Another remarkable town elsewhere in Italy is Florence (over 20%).
This survey clearly indicates how much bicycle use varies within Europe, by country and in
particular by town. Nowhere are the Dutch levels of bicycle use even approached, Denmark
and Nordrhein-Westfalen coming closest. At the same time, however, it is obvious that even
in non-cycling countries there are nevertheless some cities with respectable levels of bicycle
use, for instance in Great Britain, the Czech Republic, Sweden and Italy.
12 Fietsberaad Publication number 7AFietsberaad Publication number 7A 13
2.        Copenhagen: city (full) of bicycles

          Unlike most large cities in Europe, Copenhagen has a true bicycle tradition. Bicycle use is
          widespread among all groups of residents. As usual, part of the explanation is rooted in
          history, but at the same time the systematic and large-scale bicycle policies of Copenhagen
          local authorities have been remarkable in recent years.

          In 1920 the compact city of Copenhagen had 225,000 inhabitants, by 1950 this had grown to
          more than 770,000. This strong growth at a time when bicycles, unlike cars, were available to
          all, is a major element in explaining the high degree of bicycle use. This also marks the start
          of a true tradition, a lifestyle where cycling is perfectly normal, in a way that is comparable to
          the Netherlands. Since the 1950’s bicycle use fell strongly, in accordance with overall trends
          in Europe (as well as the number of inhabitants: back to 550,000), but this trend has reversed
          from the early 80’s onwards. Presently (2009) Copenhagen has 518,000 inhabitants. The
          Copenhagen metropolitan area has over 1.5 million inhabitants, which is particularly high in
          relation to the overall number of Danes: 5 million. Copenhagen is more or less equivalent to
          Denmark.

          General and increasing bicycle use
          Since the mid-70’s bicycle use in Copenhagen has been increasing, particularly in the town
          centre and its immediate surroundings. Counts on major routes around the town centre
          clearly demonstrate this:

                                                                     Trends in bicycle use in Copenhagen:
                                                                     cyclists towards the town centre over
                                                                     inner city cordon, morning peak hour
                                                                     1950-2005

     14                                                                      Fietsberaad Publication number 7A
The figure clearly demonstrates the essence of the Copenhagen story: over the past 30 years
the number of cyclists visible in the confines of the quite compact inner city has quadrupled
in the morning rush hour; and doubled over the past 15 years…
All data on bicycle use show positive trends only. The percentage of bicycles in all trans-
portation of Copenhagen residents has grown to 32%, considerably higher than the average
in the Netherlands. Significantly higher than bicycle percentages in that other European
bicycle capital, Amsterdam, as well (even though that city with its 756,000 inhabitants is
considerably larger and therefore less easy to cycle). There bicycles account for some 28%
of all transportation:
Copenhagen Amsterdam
public transport 15% 18%
bicycle 32% 28%
car 26% 27%
walking 24% 24%
other 3% 3%
For sure, several towns in the Netherlands have considerably higher percentages for bicycle
use, as much as 40% even. But those are small towns – less than 200,000 inhabitants.
Copenhagen local authorities mainly release data on commuter traffic. And usually not simply
the commuting behaviour of Copenhagen residents, but the reverse: the modal split towards
jobs in Copenhagen. That is the meaning of the 37% in 2008 mentioned among other data in
the policy monitor (see below) - and in many presentations on Copenhagen. This number is
high anyway for Copenhagen as many employed live in or near the city; much more so than
is usual in the Netherlands, particularly in Amsterdam. These circumstances provide part of
the explanation. In addition it is still truly remarkable that in 1996 a mere 30% of all
Copenhagen employees commuted by bicycle whereas at present this has grown to no less
than 37%.
Overwhelming bicycle use – and a particular cycling culture
Observing the Copenhagen morning rush hour is a phenomenon. Even for Dutchmen who
know all about bicycle towns. The numbers of cyclists continuously visible on the busiest
routes, are incredible. One thing stands out immediately: Copenhagen truly is a ‘city of
bicycles’ – in the sense that bicycle use is overwhelming. On the busiest routes more than
30,000 cyclists a day. These are numbers unknown elsewhere in Europe. In rush hour this
provides unique images: continuous overtaking, a kind of bicycle caterpillar slowly spinning
round itself. And at every traffic light a queue of cyclists – three abreast.
Fietsberaad Publication number 7A 1516 Fietsberaad Publication number 7A
To a Dutchman these numbers are impressive, but so are the characteristics of the cyclists
themselves, as these differ greatly from what is common in the Netherlands:
- highly visible: considerable numbers of cyclists are wearing a helmet; approximately 1 in 6.
- the bicycles are almost without exception nice, well-maintained, new – and often the
   sporty type.
- the manner of cycling is sporty as well. A considerable number of people pedal at a fierce
   pace. At traffic lights almost half of all cyclists are actually panting.
- certainly the morning rush hour consists nearly completely out of commuters and hardly
   any children on their way to secondary schools.
- cyclists obey traffic regulations quite well. In Copenhagen people do not feel this way,
   as other road users complain in considerable and increasing numbers about cyclists’
   behaviour. But compared to cycling in the Netherlands, everything is extremely tidy and
   disciplined. Over 90% of cyclists stop at a red light. Riding three abreast, with passengers
   on the back, mobile phone in use – rare occurrences. Choosing your own route across any
   type of public space, as long as it is a shortcut from X to Y – is compared to the Dutch
   cyclists’ behaviour almost never to be seen.

 Behaviour of cyclists crucial??
 In the Copenhagen bicycle monitor harsh statements are made concerning cyclists’ un-
 desirable behaviour. That is because 63% of drivers are ‘sometimes or often’ angry about
 cyclists’ behaviour. Over 80% feel cyclists to be breaking traffic regulations ‘sometimes or
 often’. These surveys are taken extremely seriously. The conclusion is: ‘Cyclist education
 should be taken seriously if Copenhagen is to continue to improve as a city for cyclists.’
 The mere phrasing of the questions might certainly warrant a more laconic approach.
 Sometimes, occasionally, angry at a cyclist....gosh!

Extremely utilitarian
Probably everything is connected to everything else. And an ‘external factor’ like the relatively
extremely low risk of theft will certainly be a crucial variable in all of this: better bicycles/other
cyclists.

Fietsberaad Publication number 7A                                                                        17
But the most striking feature is that Copenhagen appears to possess quite a specific cycling
     culture. Maybe basically different from the predominant cycling culture in the Netherlands.
     Two catchwords appear to apply to Copenhagen cyclists:
     - conscious: the conscious choice of a proud adult.
     - rational: a deliberate choice, based on the clear advantages of bicycle use. There is a good
         reason for Copenhagen cyclists to say they cycle mainly because it is fast, simple and
         healthy.
     The word lifestyle may be highly appropriate, since this refers more or less to a conscious
     decision by individuals, whereas the word culture refers more to an individual’s environment.
     The very word lifestyle is frequently used by policymakers and people connected to the
     Copenhagen bicycle scene.
     That cycling lifestyle translates into a different street scene when compared to the Nether-
     lands. Cycling is less of a statement there, less conscious, less emphatic. Cycling in the
     Netherlands often looks less utilitarian as well, more relaxed.

     Differences in cycling culture between Copenhagen and (for instance) Amsterdam should not
     be exaggerated, of course. From a European point of view, after all, the similarities are much
     more striking. With a bicycle percentage of 32% it is almost inevitable that bicycle use is high
     among all age and social categories. In recent years bicycle use has grown particularly
     among the elderly. Cyclists are evenly distributed over all income categories, unlike car
     owners (mainly higher incomes) and public transport users (mainly lower incomes).
     Cycling is simple ‘socially accepted’. In Copenhagen it is pointed out that it is not unusual to
     see ministers and local authorities cycling to work.

18                                                                     Fietsberaad Publication number 7A
Effecting a bicycle lifestyle
Nevertheless there are differences in cycling culture and lifestyle at official and political
levels in urban cycling policies that should not go unmentioned.
First of all: officially cycling policies are a mature and particularly independent issue.
Copenhagen possesses a bicycle team of currently 6 people. Projects are implemented
everywhere in the organisation; the bicycle team is a clear and well-known information and
co-ordination point. And within the bicycle team cycling culture, lifestyle and promotion of
Copenhagen as bicycle town is an important issue.
Witness the presentations, among them by manager Andreas Røhl, on cycling in Copen-
hagen: mainly dealing with the position of the bicycle in Copenhagen – and much less with
the details of cycling infrastructure. The main emphasis is on what cycling means for the city
and its inhabitants. External champion is Gehl Architects, the bureau of the famous Jan Gehl,
strongly contributing to positioning Copenhagen as ‘a people approach’: urban design
specifically for people. Gehl Architects uses to this end the striking images of streets full of
cyclists versus empty streets or streets full of cars. And catchy slogans: A city full of bicyclists
is a friendly city – a people city.
The Copenhagen bicycle team is also involved in more theoretical foundations of promotion:
‘mainstreaming’ bicycle traffic
“A mainstream bicycle culture needs to be flexible
enough to embrace both mass culture and individual sub
cultures in order to be thoroughly successful. Cycling
being as mainstream as it is, there is need for a common
debate on the positive aspects of everyday cycling . (…)
To meet these demands, the City of Copenhagen has set
off a new campaign based on the brand “I bike CPH”.
This brand communicates positivity, participation and
ownership - and a sense of community that is as flexible
as the bicycle culture out on the streets. The campaign
includes happenings on street level as well as an inter-
active web 2.0 community.”
Fietsberaad Publication number 7A 19Pro-cycling politics
Secondly: in local politics cycling policy is very much an item. To a certain degree it was a
political issue in the latest local elections. And it is generally assumed that pro-cycling choices
of nominee politicians were truly effective in those elections. Andreas Røhl provides several
reasons for political support for cycling. The well-known social advantages (less congestion,
environmental concerns, health, urban life) but he also mentions the possibility of some more
inherently political motives: projects can often be implemented within a single term in office;
bicycle policies are relatively inexpensive and highly visible. And finally, emphatically: 60% of
voters has a bicycle as their main mode of daily transport…
This stronger political drive behind local bicycle policies goes with radical and clear objec-
tives that are communicated as much as possible, too: 50% share of cycling to work and
school (previous target 40%); 50% fewer casualties; 80% of all cyclists to feel comfortable.
And that in 2015, an emphatic and major element in a larger ambition: becoming the world’s
eco-metropolis.
Perfect monitoring
The attention paid to interaction with
the inhabitants in Copenhagen
cycling policy is matched by heavy
monitoring of that policy. In the
Bicycle Account biennial develop-
ments in bicycle use and safety have
been recorded since 1996, as well as
facts about the immediate results of
municipal cycling policy. However,
the most important and most
frequently used part of the Bicycle
Account is a standard bicycle satis-
faction survey. There cyclists award
scores on eight essential elements of
cycling policy. The data in Bicycle
Account 2008 (published in 2009):
Scores awarded by cyclists on eight essential elements of Copenhagen bicycle policy, 1996-2008
1996 1998 2000 2002 2004 2006 2008
Copenhagen city for cycling 7 8 8 8 8 8 9
Cyclist sense of security in traffic 6 6 6 6 6 5 5
Amount of cycle paths 6 6 7 6 6 6 6
Cycle path width 7 7 6 5 5 5 4
Cycle track maintenance 5 5 4 5 5 5 5
Road maintenance 2 3 2 3 3 3 3
Feasibility of combining cycling and public transport 5 4 5 5 5 6 5
Bicycle parking in town 4 3 4 3 3 3 3
20 Fietsberaad Publication number 7AThe overall judgement of the cyclists (Copenhagen cycling city) is high and has been rising since 1996. Nevertheless there is a clear gap between the very high appreciation of the general issue of Copenhagen as a cycling city and the verdicts on actual bicycle facilities. There is hardly a positive trend there, on the contrary. The greatest decline is in the width of Copenhagen bicycle paths. This appears to be a direct consequence of the policy’s success: increasing numbers of cyclists on the same infrastructure – leading to crowding. The numbers in recent years may actually now lead to congestion on bicycle paths along certain stretches of roads and in rush hour. Bicycle paths with a width of 2.20 metres can only handle approxi- mately 2,000 cyclists an hour. Whereas rush hour numbers are approaching 3,000 cyclists on the busiest routes. Widening to 3 metres is advisable on the busiest routes and is being considered by local authorities. Raised adjoining bicycle paths Remarkable cyclists, remarkable numbers of cyclists - but certainly also remarkable bicycle facilities in Copenhagen. The range of facilities is severely limited. Where many other towns demonstrate a wide range and combination of bicycle lanes and bicycle paths, depending on time of construction and local circumstances, Copenhagen has almost no bicycle lanes separated from car lanes by markings only (18 km of bicycle lanes compared to 338 km of bicycle paths). Standard the bicycle paths, on either side of the road, are at least 2 metres, often 2,5 metres wide. A typically Copenhagen phenomenon is that these are usually ‘(raised) adjoining bicycle paths’, according to Dutch terminology. The Dutch ‘separate bicycle paths’, with a clear distance/verge between car lane and bicycle path, are rare in Copenhagen. And ‘solitary bicycle paths’, with their own route, can occasionally be found, but then emphatically as part of a specific network, the green routes (see below). The raised adjoining bicycle paths are a success in Copenhagen. No one is advocating fundamentally different types of facilities. Which is remarkable, particularly when combined with high numbers of cyclists. In the Netherlands it might be a cause for concern: no more than a kerb between the bicycle path and motorists; a great risk of falling when overtaking and landing among the cars. Not so in Copenhagen, maybe partly due to the fact that people seem to be cycling 2 (or 3) abreast relatively less often. Fietsberaad Publication number 7A 21
Highly similar bicycle facilities along highly similar roads. Because that is certainly also a
     factor: the Copenhagen bicycle network is concentrated along heavy radials, meant for
     motorists as well. Which leads to situations along stretches of road and at intersections that
     are or may be more or less similar. The best standard solutions are looked for in inter-
     sections, just like along the stretches of road (with raised adjoining bicycle paths). Where
     ‘best’ usually translates into ‘safest’.
     Since the bicycle path is so close to motor lanes, the most logical and common mechanism is
     essentially turning inwards at intersections. Making cyclists more visible. Copenhagen bicycle
     paths usually change into bicycle lanes a few metres before an intersection, lead straight
     across the intersection (since the 90’s often marked in blue with white bicycle symbols) and
     change back into bicycle paths beyond the intersection.
     Experiences with the blue intersection markings are positive. Studies show an increase in
     safety. In particular the number of accidents between cyclists going straight ahead and
     on-coming left-turning motorists has clearly fallen.

     The search for the best solution is however still on regarding intersections with lengthened
     or shortened raised-adjoining bicycle paths. The solution for some of the conflicts is clear:
     cyclists meeting a red light should be positioned somewhat closer to the intersection than
     motorists waiting as well. Problems are caused by cyclists arriving at the intersection when
     lights are green. And that happens a lot, due to the huge numbers of cyclists on those radials
     and the long green phases on those radials for bicycles and cars (together). That makes right-
     turn lanes for cars highly advisable anyway. At the busiest moments, however, the situation is
     visibly ‘wrong’. Motorists will eventually use even the tiniest gap in the rows of fast bicycles.
     In this respect it seems inevitable that increasingly a decision is made in favour of conflict-
     free solutions between cyclists going straight ahead and cars turning right.

     Implementation of the bicycle network
     Bicycle facilities in Copenhagen go back a long way. Initially these were mainly recreational
     bicycle paths along arterial roads. The first bicycle path dates from 1920. By 1930 this had
     already grown to 130 km of bicycle paths. After 1945 the main issue was segregation of traffic
     types on the busiest main roads. Many bicycle paths were constructed particularly along new
     main roads. Presumably thanks in part to these facilities bicycle use stood its ground, even in
     the decades of decline and minimal attention by policymakers. The network of bicycle paths
     has since been almost completed - almost one hundred years of bicycle path construction
     bears fruit. Overall there is approximately 340 km of bicycle path nowadays (2009). And
     although this is by and large complete, there is still some degree of expansion every year.
     In 2008 another 5 km of bicycle path was added (and 4 km hugely improved). According to
     local planners there is still some 50-60 km to go.

22                                                                     Fietsberaad Publication number 7A
Network choices: traditional radials versus park routes
The bicycle network of raised adjoining bicycle paths covers to a large degree exactly the
same routes as car traffic. The busiest bicycle routes are the traditional radials that are also
preferred routes for motor vehicles. This decision in favour of ‘convergence’ has a number of
consequences. Cycling in Copenhagen means cycling in the noise and pollution of motor
vehicles. At the same time it is also a very direct route - and cyclists are relatively little
bothered by traffic lights on the radials themselves, as they are carried along in the long
green phases for the neighbouring motor vehicles.
Huge numbers of cyclists do this on a daily basis, as the radials are so attractive – both to
cyclists and motorists. Just look at the map: the busiest routes in Copenhagen are the last
3-4 km of five clear radial routes. As well as the route along Langebro and Andersens
Boulevard, slightly less typically radial.
Data on bicycles in Copenhagen
Note: west of the city centre is an area displaying hardly any bicycle
routes. This is the independent municipality of Frederiksburg, completely
enclosed by Copenhagen.
The convergence of bicycles and cars on those radials also explains most of the emphasis in
Copenhagen bicycle policies. The large amount of attention to safe bicycle infrastructure on
intersections is closely linked to the large numbers of intersections on those radials and their
heavy load. And it is no more than fitting that Copenhagen should be one of the first cities to
introduce green waves for cyclists. The first route where this was realised was a 2200-metre
stretch of road with no fewer than 12 traffic lights…
Green wave Nørrebrogade (2004)
Nørrebrogade is the main bicycle axis in Copenhagen. Near the town centre at the time
30,000 cyclists a day, alongside 17,000 cars. A little over 2 km further along there were
15,000 cyclists and 16,000 cars. The effects of the green wave along 12 traffic lights (with
considerable green phases in the main direction anyway) with a standard speed of 20
km/h, could easily be demonstrated. In the morning rush hour towards the town centre the
advantage to cyclists was 2.29 minutes (6 stops less); in the opposite direction 1 stop was
gained as well as 35 seconds. Effects in the afternoon were more difficult to gauge, as
there is no clear rush hour. The effect (out of the town centre) is smaller, but still clear:
1.13 minutes advantage thanks to 3 stops less.
Fietsberaad Publication number 7A 23Green routes
All attention has gone, both in the past and the present, to the bicycle facilities along these
busy radials. The alternative has been positioned radically different in Copenhagen. Alongside
or in contrast to the adjoining bicycle paths along arterial routes there are no routes with the
same function through residential neighbourhoods, along low-traffic roads. There are only
‘green cycle routes’. Literally green: to a large extent winding through parks and complete
car-free areas. There has been a distinct search for routes over longer distances and complete
routes; even a complete network. There are some 22 green routes planned, each on average
5 km long. Of the overall 110 km some 41 km have been realised at this time. The speed is not
impressive: in 1995 there were already 29 km in existence.
The network of green routes is emphatically not meant to be utilitarian. Copenhagen states:
“The green cycle routes are for recreation, bicycle exercise, running, walking, skateboar-
ding and other games on wheels. In addition, they offer anybody cycling to their place of
work or education the opportunity to cycle all or part of their daily journey through peace-
ful, green, car-free and bus-free surroundings.”
24 Fietsberaad Publication number 7AInevitable network choices: low(er) car traffic
Few direct routes, only to a slight degree aimed at the major destinations, slow to be effected
– it will be clear that in this way there will not be an alternative for the functional ‘convergence’
routes for a long time. And therefore the inevitable problems on the convergence routes will
have to be addressed on their own. There are various solutions possible – and the beginnings
can be discerned in Copenhagen as well:
- if the numbers of cars and bicycles become prohibitive at the busiest intersections, the
time has come for the best but also most expensive solution: different levels. Copenhagen
has more or less started on this road.
The numbers of bicycle bridges and tunnels are still quite low, but increasing. As well as
the realisation that this is necessary.
- if the numbers of cyclists on those busy radials outgrows the available room, additional
room will have to be found. At the expense of motor vehicles. It is quite remarkable that
this is already occurring in Copenhagen, and without too many problems: parking spaces
are being sacrificed in favour of raised adjoining bicycle paths. All over the town the
desire to decrease the number of lanes for car traffic will be growing. By now there is a
precedent: Nørrebrogade has been closed to through traffic since 2008. This caused 40%
fewer motor vehicles in rush hour, which pleased 67% of the local residents and added
aprox. 5000 cyclists to the aprox. 30.000 that daily passed the most popular part of the
street before the redesign.
Nevertheless Copenhagen – cycling capital in numbers of cyclists – is remarkable for the
room still afforded to cars very close to the town centre. Heavily-used car routes at a distance
of less than a kilometre from the town centre. Remarkably short car queues outside rush
hour. The most extreme example: the intersection Gyldenløvesgade/Søgade: the radial route
has 9 lanes for cars, at 900 metres’ distance from the market (Nytorv). There Copenhagen
appears to be a true car city!
Indirectly, without much ado and very cautiously, steps have been taken towards a kind of
alternative network along low-traffic roads. Nørrebrogade is a first instance: closure for motor
vehicles has shifted this route to some degree from the ‘convergence-radials network’
towards a ‘low-traffic network’. The bicycle bridge in a green route across the busy Ågade/
Åboulevard (2008) makes that route much more functional and to a certain extent radial as
well. The bicycle bridge Bryggebroen across the harbour at Islands Brygge (2006) created a
new functional route - and attracted 3,000 cyclists from the very first day, a number that at the
latest count (2009) had increased to 8500.
Fietsberaad Publication number 7A 25Bicycle plan
The 2002-2012 Copenhagen bicycle plan concerns not only these issues of network and
bicycle paths, even though financially at least this will be essential. Copenhagen spent on
average between 10 and 15 million Euro on bicycle facilities over the past few years.
The remaining task is financially still considerable. The 50-60 km of bicycle path that are yet to
be effected and the extra 70-plus km of green routes that are planned will require overall not
much less than 100 million Euro… That will take some years yet!
The way in which the Bicycle Account is put to use is interesting. First of all there is a focus
on present-day cyclists. After all, one-fifth of cyclists find Copenhagen not a pleasant place for
cycling at all. Concrete improvements must prevent this group from giving up.
The subjective perception of safety is taken very seriously in Copenhagen. Whether justified
or not, a perception of danger results in fewer cyclists than possible. Objectively safety is
improving.
Bicycle use and safety mutually reinforcing
A phenomenon well-known in
all bicycle towns and countries
can clearly be discerned in
Copenhagen as well: a conside-
rable increase in bicycle use is
coupled with a considerable
decrease in the number of
casualties. Reducing the risks
for cyclists even more. In
Copenhagen from the late 90’s
the number of serious casualties
fell from over 200 a year to less
than 100 a year from 2006
onwards.
Nevertheless the perception of safety is not optimal by far. The bicycle plan 2002-2012
proposes not to attempt an increase in safety (perception) by realising bicycle paths, but
to completely focus on intersections instead.
Comfort requires a lot of attention as well, as demonstrated by the Bicycle Account: over half
of all cyclists are dissatisfied about maintenance. Local authorities are therefore more than
willing to tackle this issue in the bicycle plan.
Cyclists have long been not impressed by the maintenance of the routes. This is partly due
to the high impact of bad surface over short distances, as actually 82% of the routes are well-
maintained and 13% are acceptable. Annually this will require approximately 1 million Euro
to improve and maintain quality.
In addition a plan has been drawn up to also sweep at weekends the approximately 50 km
of bicycle paths that appear to be littered fastest. Snow-clearing will occur earlier in the
mornings, well before rush hour. Sweeping and clearing now cost over 1 million Euro a year.
26 Fietsberaad Publication number 7AFietsberaad Publication number 7A 27
Moreover, bicycle parking is an issue
     that needs to be addressed more
     (witness the low marks in the Bicycle
     Account) and is actually being addres-
     sed of late, at destinations and train
     stations. In 2006 a start was made in
     removing abandoned bicycles. Simple
     parking facilities have been added in
     large numbers. Copenhagen meticu-
     lously records this: 20,500 ‘on-road
     parking spaces’ in 2004; no fewer than
     34,800 in 2008! Many, but at the same
     time much less than Amsterdam placed
     in the street (The officials of
     Amsterdam estimate approx. 200.000).

     Guarded parking? This does not appear to be an issue in Copenhagen, partly due to the low
     risk of theft, and also in part due to the fact that on many locations bicycles may be parked
     indoors or on private property. In combination with public transport the issue is not so much
     surveillance to protect against theft either. The more so since it is allowed to carry bicycles
     along on trains and underground. But most certainly also because cyclists do not perceive the
     need. At the Copenhagen main stations, Central Station and Nørreport Station, hundreds of
     bicycles are visible, as well as far too few parking facilities. The need for racks is obvious, not
     so for surveillance.

     What makes them cycle so much?
     When all is said and done, it is still confusing to see the huge numbers of cyclists on the
     cycling axes in Copenhagen. In part this is some sort of optical illusion, a result of the strong
     clustering of all cyclists on those radials. Nevertheless Copenhagen is still the cycling capital
     of Europe, even in percentage of cycling. The quality and quantity of the bicycle infrastructure
     clearly match this. At the same time, however, the quality of the cycling network does not
     appear to be the cause for the numbers of cyclists and their rapid increase. In bicycle infra-
     structure Copenhagen is far less of a capital. And by no means is Copenhagen the car-free
     capital.

28                                                                       Fietsberaad Publication number 7A
So after all still a ‘culture’ or ‘lifestyle’ – whatever that may be? To a certain degree this may
be so. But some more tangible factors can be discerned, particularly when compared to
Dutch towns:
1. the low numbers of car ownership in Denmark, in particular Copenhagen, due to high
purchasing costs (almost twice as high as in the Netherlands). In the Netherlands car
ownership per head is 21% higher than in Denmark. Amsterdam has 42 cars per 100
inhabitants, Copenhagen 22 – although it is not sure the data are comparable.
2. few opportunities for parking cars in the Copenhagen town centre. Of course this holds for
visitors in many other towns as well. But Copenhagen appears to be exceptional: even
employees struggle to find parking space. Major companies do not have private parking
garages to a much lesser degree.
3. Low numbers of bicycle theft. Even in the Netherlands we know the spiral may be upward
or downward: less theft, better bicycles, nicer to cycle, cycle more often, et cetera.
Yet it remains hard to explain. And the reality remains overwhelming: Copenhagen is indeed
a city (full) of cyclists. And because it is so hard to explain and in several respects it appears
the cycling climate may be improved a lot, a continued increase of bicycle use seems to be
likely.
- provided cyclists will demand their rightful place, even in traffic behaviour…
- provided Copenhagen will reduce the role of cars near the town centre, as dozens of other
towns in Europe have done…
- provided cycling will be even nicer and more relaxed by additional improvements in the
network…
City-bikes
The Copenhagen city bikes are known all over the world, particularly among tourists. A true
attraction by now, these ‘white bicycles’ (2,000 of them at present) are currently available at
110 locations across the town centre, the area where they may be used at will and for free.
Only a small deposit is required (a DKK 20 coin).
Initially the Copenhagen white-bicycle project had the same problems as many other similar
projects elsewhere in Europe: many technical shortcomings and huge numbers of stolen
bicycles almost caused a decision to stop. By 1996 however some major technical improve-
ments have been effected and theft fell (by stepping up control outside the area of use). It
has been a success ever since, particularly among tourists. Even though by now the concept
is somewhat antiquated in view of the smart bikes sweeping over Europe.
Fietsberaad Publication number 7A 293. Amsterdam: the blessings of bicycles
Amsterdam: the capital and in many respects also the exception of the Netherlands.
Certainly as regards bicycle use and all that this entails (theft included). Leading in problems
but most certainly also leading in solutions.
‘Count your blessings’. In Ria Hilhorst’s conversations on Amsterdam bicycle policy, the
emphasis is on what needs to be done yet, what can be improved, which problems are still
unsolved. She is the coordinating cycling official at Dienst
Infrastructuur Verkeer en Vervoer (DIVV) of the Amsterdam
municipality. And it is by no means strange to find policy-making
officials mainly involved in what is still necessary, what needs to
be solved. To outsiders, however, this is remarkable. Particularly
since cycling in Amsterdam has been an enormous success story
over the past decades. In ultimate effect (bicycle traffic versus car
traffic), but most certainly in obvious policy results as well, in
bicycle routes and bicycle parking.
30 Fietsberaad Publication number 7AModal split of Amsterdam residents, 1988-2007
What has occurred in Amsterdam streets since 1988; which choices did travellers make –
partly due to the implementation of traffic policy? Local authorities regularly and meticulously
investigate this. It is clear that bicycle use is increasing at an amazing pace:
Source: Gemeente Amsterdam/Dienst Infrastructuur, Verkeer en Vervoer.
Taken all residents into account, the picture is extremely positive. Since 1990 bicycle use
has increased from 21% of all trips to 28%. These types of shift in modal split do not occur
frequently. For the first time Amsterdam residents now use their bicycles more often than
their cars (27%).
There are considerable differences among districts. Residents of the district Centrum use their
bicycles most often – no surprise there – (41% versus an average of 28%) and their cars least
often (18% versus an average of 27%). Local authorities are well aware of the main reason:
‘This can be attributed to the restrictive parking policies introduced since the 1990s.’ At
present parking charges are in effect in almost the entire area within the A-10 ring road.
At the Singelgracht cordon the trend is clearly demonstrated by counts. In 1990 235,000 cars
were registered entering and leaving the area a day. By 2006 that number had fallen to
172,000. Over the same period the numbers of bicycles passing that location grew from
86,000 to 140,000. Roughly 55,000 fewer cars and more bicycles into and out of the town
centre. That is definitely a clear trend!
Traffic casualties
In such a busy central city cycling is bound to be dangerous, outsiders might think. And cer-
tainly, for inexperienced outsiders Amsterdam (bicycle) traffic may appear to be dangerous.
The data however tell a different story:
Source: SWOV/Cognos
Fietsberaad Publication number 7A 31The number of serious casualties (fatalities and hospitalisations) among cyclists fell steadily
for a number of years, from approximately 400 a year in the late 1980s to 150 a year immedia-
tely after 2000. Since that time it has however increased considerably, to approximately 300
a year. The fall and rise demonstrate a similar pattern as the data for pedestrians and the
various types of mopeds. The number of serious casualties among motorists has fallen
considerably less.
It is by no means certain that the low numbers of serious casualties around 2004 in this graph
actually reflect reality. Data on casualties may easily be distorted by inaccurate reporting –
and there are indications that this was (more) prevalent in Amsterdam at the time. Anyway,
the overall picture over the past 20 years remains for cyclists, too, one of more or less con-
stant numbers of serious casualties. Considering the growth in inhabitants, people in the
streets, bicycle use and certainly car use as well, that constancy or limited decrease is no
mean result anyway. Cycling is getting safer per kilometre, that is an undisputable fact.
Integral at three levels
The data demonstrate that Amsterdam traffic policy is extremely effective and that the role of
the bicycle has by now become crucial to all objectives behind traffic policy. A result to be
proud of, and achieved within an extremely complex organisational structure. This is another
example how incomparable Amsterdam is where bicycle policy is concerned: it is the only
town in the Netherlands where three levels of government are involved in traffic policy to a
considerable extent. Stadsregio Amsterdam subsidises to a considerable extent the realisa-
tion of a regional bicycle network and is as such a major participant as far as bicycle facilities
are concerned. Within Amsterdam local government the town districts (currently 14; from
May 2010 7) are of major importance, certainly in bicycle policy, in addition to Centrale Stad
(central authorities). The town districts play a major part since public space is at stake in bicy-
cle routes and bicycle parking and details carry a great deal of weight.
Fietsersbond Amsterdam
The Amsterdam branch of Fietsersbond is special. First of all, in a way it is the cradle of
Fietsersbond. Also the branch that has for years been a trendsetter in professionalism, up
to and including paid employees (partly thanks to funding by local authorities). Moreover it
is the largest branch, with some 4500 members. Fietsersbond has been and still is very
active in reporting bottlenecks and providing possible solutions. The website is filled with
‘bottlenecks solved’ and the remaining unsolved ones. As such Fietsersbond is a force
keeping bicycle policy focussed on concrete issues, ‘aimed at the street’.
Three government institutions for local bicycle policy – that is sure to cause a lot of bureau-
cracy and complex procedures. Ria Hilhorst: ‘Of course it takes time and sometimes it is
frustrating. But over the years we have managed to divide the responsibilities quite well. And
by now the entire structure is quite effective.’ In the process of realising a high-grade bicycle
route network experience on how best to cooperate has led to clarity – also on what is still
problematical.
Collaborating on bicycle network
Centrale Stad has defined the main bicycle network, Hoofdnet Fiets. The first versions date
back to the early 1980s; in 2005 a final version has been defined by the town council as the
‘ideal picture’ – including the quality requirements that entails. The term main bicycle network
may be somewhat confusing. That suggests a coarse complex of a limited number of main
bicycle routes. Nothing could be further from the truth. In complete compliance with the
lessons learned in the Netherlands (bicycle route network Delft!) the Amsterdam main net-
work has as a matter of course a mesh size of only 300 by 300 metres.
32 Fietsberaad Publication number 7AQuality requirements have been drawn up for this main bicycle network. Mentioned and explained in a few pages of the 2005 Beleidskader Hoofdnetten; design requirements specified in five pages of Leidraad Centrale Verkeerscommissie Amsterdam. In part this is a repetition of general guidelines or legal requirements, for instance on when a bicycle lane has a legal status. But most design requirements are specific Amsterdam choices. The most remarkable are: - in the main network as few intersections as possible and as much as possible priority for cyclists at intersections; - routes of the main network may run along neighbourhood connector roads (30 km/h) when car volumes do not exceed 3000 mv/24h; - always a preference for bicycle paths in shopping streets (due to bustle and parking), even when these are neighbourhood connectors; - in case of district connectors bicycle paths; bicycle lanes only under strict conditions and never in combination with parking; - one-way bicycle paths should be at least 1.80 m wide in pre-war neighbourhoods and at least 2.00 m in post-war neighbourhoods; a width of 2.50 m is desirable – in order to allow two people cycling side by side to be overtaken by another cyclist; - restraint in construction of two-way bicycle paths, because of their relative dangers, but in principle ‘2*2 for bicycle in case of 2*2 for cars’: two-way bicycle paths on either side of a road with twice two lanes for car traffic. - average waiting time at traffic lights at most 30 seconds; - radius of curve in bicycle paths at least 4 metres; - gradient at most 1:10, preferably 1:20. The ferries for pedestrians and cyclists across the IJ, between Amsterdam-Noord and Centraal Station Fietsberaad Publication number 7A 33
Green wave
      Amsterdam intends to utilise dynamic traffic management for cyclists: an experiment has
      been conducted with dynamic route information panels at the IJ ferries: departure times
      of the ferries in relation to the recommended bicycle route. Another striking example is a
      project with a wave of green traffic lights for cyclists. This has been realised on Raadhuis-
      straat in Amsterdam in the autumn of 2007. Between Dam and Prinsengracht cyclists are
      confronted by no fewer than 11 traffic lights over a distance of a little over 500 metres.
      At an average speed of 18 kilometres an hour the cyclists (some10,000 per 24 h) now
      encounter a green light 11 times in a row. The green wave is active in both directions.
      The calculated reduction in cyclists’ travel times is 1 minute (when cycling west) and well
      over 40 seconds (when cycling towards the town centre). This is not very much, but it
      definitely is over a distance of 500 metres!

     Of course Hoofdnet Fiets meets these quality requirements by no means everywhere, and the
     requirements are carried out to the letter by no means in all changes/redesigns, but this is the
     widely accepted and formal ambition. In this respect the Centrale Verkeerscommissie (CVC) is
     crucial. This commission consists of officials of the various (central) municipal departments –
     in particular DIVV. In addition a number of outside agencies receive the agenda and may send
     their reactions to CVC. These outside agencies are Fietsersbond, Fire Brigade and the
     Amsterdam Organisation for the Handicapped. CVC assesses all projects by the town districts
     – the road authorities – which may affect the main networks for cars, bicycles and public
     transport. According to the Leidraad CVC:
     ‘CVC is an official advisory body charged with providing to local authorities, through the
     alderman for Traffic, solicited or unsolicited advice on planned measures affecting these main
     networks or within their immediate sphere of influence.(..) The objective of Leidraad CVC is to
     provide third parties with information on the traffic engineering standards CVC applies.
     Leidraad should be considered a manual for road authorities within the town of Amsterdam
     in order to obtain information into this assessment, prior to consideration in CVC.’
     Of course, as Ria Hilhorst acknowledges, everyday practice is much more complicated and
     regularly remarkable things happen. Nevertheless she is distinctly positive concerning the
     relationship districts /CVC: ‘Smart district officials will of course visit DIVV at an early stage to
     find out which design has the best chance of being approved. Which is only efficient. The for-
     mal position of and assessment by CVC really does ensure a high quality for bicycles in new
     projects, and much more easily.’

34                                                                        Fietsberaad Publication number 7A
You can also read