The Breeding Birds of Tommy Thompson Park - Toronto and Region Conservation Authority
←
→
Page content transcription
If your browser does not render page correctly, please read the page content below
The Breeding Birds of
       Tommy Thompson Park
                                     2018

    First Cliff Swallow Nests Under Construction at Tommy Thompson Park (A. Cui)

Toronto and Region Conservation Authority

                                 Prepared by
                         Don Johnston and Ian Sturdee

                                February, 2019
Table of Contents

1. Introduction

   1.1   Study Area (Tommy Thompson Park) ……………………………………………………...............      1

2. Colonial Waterbirds and Managed Waterfowl

   2.1   Project Background…………………………………………………………………………………….                       1

   2.2   Population Estimate Methodology…………………………………………………………………….                2
         2.2.1 Tree Nest Survey Methodology………………………………………………………………..              2
         2.2.2 Ground Nest Survey Methodology…………………………………………………………….              2

   2.3   Results …………………………………………………………………………….…………………….                           3
         2.3.1 Managed Waterfowl …………….………………………………………………………………                    5

3. Landbirds and Non-colonial Waterbirds

   3.1   Project Background………………………………………………………………………..……………                      6
         3.1.1 Rationale………………………………………………………………………………………….                        6
         3.1.2 Change in Data Reporting………………………………………………………………………                 6

   3.2   Methodology……………………………………………………………………………………………..                          6
         3.2.1 Variable Circle Plot (VCP) Point Count Protocol…………………………………………….   7
               3.2.1.1 VCP Station Vegetation Protocol…………………………………………………..        7
         3.2.2 Nest Searching and Monitoring Protocol……………………………………………………..        7

   3.3   Results
         3.3.1 Variable Circular Plot Point Count Results………………………………………………….       8
               3.3.1.1 VCP Station Vegetation Survey..…………………………………………………..         8
               3.3.1.2 VCP Observations..………………………………………………………………….                11
         3.3.2 Nest Searching and Monitoring Results……………………………………………………..         15
               3.3.2.1 Changes in Nest Density for Each Zone ……………….………………………..    18
               3.3.2.2 Nest Productivity……………………………………………………………………..               19
               3.3.2.3 Parasitism by Brown-headed Cowbirds…………………………………………...      20

   3.4   The Overall Picture in 2018……………………………………………………………………………                  22

4. Acknowledgments……………………………………………………………………………………..........                       23

References…………………………………………………………………………………………………………                                 23

                                               i
Tables, Figures and Appendices

                         Colonial Waterbirds and Managed Waterfowl

Tables
2.1 Colonial Waterbird Nests at TTP, 2008 – 2018 …………………………………………………….                  5

Figures
2.A Colonial Waterbird Nesting Areas, 2018 …………………………………………………………….                     3
2.B Double-crested Cormorant Nests at TTP by Sub-colony, 1998 – 2018 ………………………….        4
2.C Black-crowned Night-Heron Nests at TTP by Sub-colony, 1998 – 2018 ………...………………      4

                            Landbirds and Non-colonial Waterbirds

Tables
3.1 VCP Station Information ………………………………………………………………………………                               7
3.2 Primary Habitat Type by Zone ……………...………………………………………………..………                         8
3.3 2010 - 2016 VCP Station Vegetation Analysis …………………………………………………….                   10
3.4 VCP Species Lists and Total Birds Detected by Species Within 100 Metres …………..………   12
3.5 Total Nests by Species from 2009 to 2018 …..……………………………………………………..                  16
3.6 Species Reaching New Nest Highs in 2018 ………………………………………………………..                     17
3.7 Nest Productivity from 2009 to 2018 ……………….……………………………………….………                      19
3.8 Summary of Species Detected During Breeding Season From All Studies .………..………….     20
3.9 Brown-headed Cowbird Parasitism Rates from 2009 to 2018 ……………………………………              21
3.10 Species Recorded Only By VCP Counts Versus Species Recorded Only By Nests ………….    23
3.11 2018 Effort by Nest Searching Project Participants (hours) ………………………………………         23

Figures
3.A Annotated Map of Tommy Thompson Park with VCP Station Locations ……………………….           9
3.B Total Bird Abundance per VCP Station .……………………………………………………………                       14
3.C Species Richness per VCP Station ….……………………………………………………………..                        14
3.D Nest Searching Effort per Zone from 2009 to 2018 ………………………………………………..               15
3.E Nest Density by Zone …………………………………………………………………………………                                18
3.F Known Nest Failure Rate Trend …………...…………………………………………………………                         19
3.G Brown-headed Cowbird Parasitism Rate Trend ……………………………………………………                     22

Appendices
A Description of VCP Stations (Habitat Pictures and Sketches) ……………………………………….          26
B Map of TTP Breeding Bird Zones …………………………………………………………………........                      35
C Species Accounts …………………………………………….…………………………………….........                            36
D Map of 2018 Landbird Nest Locations ……………….……….……………….………………………                       42
E Breeding Status Codes for Each Species Detected in 2018 …………………………………………              43

                                               ii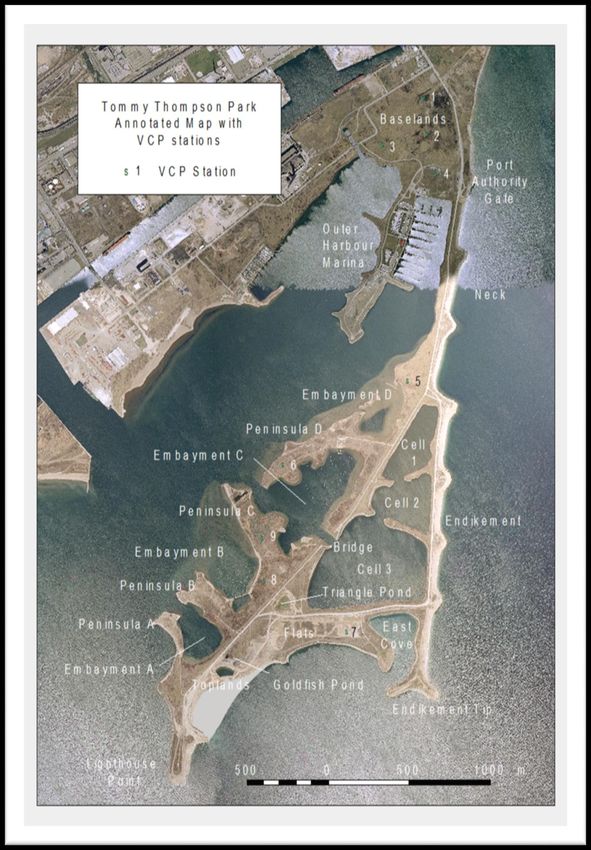
1. Introduction

     1.1 Study Area
                                                          Tommy Thompson Park is located on the Leslie Street Spit, a
                                                          471-ha, 5-km long man-made peninsula extending into Lake
                                                          Ontario in Toronto. When construction of the Spit began in
                                                          1959 by the Toronto Harbour Commission (now Ports
                                                          Toronto), the intention was to create new lands for port
                                                          related facilities. However, for a variety of reasons port
                                                          related expansion did not occur and natural succession was
                                                          allowed to progress. As such, the Province of Ontario
                                                          awarded Toronto and Region Conservation Authority (TRCA)
                                                          the responsibility of creating a Master Plan for a public park.
                                                          Landform construction was ongoing until 2015, and while the
                                                          final size of the Spit (including waterlots) is complete,
                                                          occasional works will be required into the future to maintain
                                                          shoreline stability.

               TTP Aerial View (TRCA, 2014)                Over the years, the Spit evolved into the largest area of
                                                           natural habitat on the Toronto waterfront, both through
natural succession and habitat enhancement projects by the TRCA. A variety of vegetation communities, including
successional forests, meadows, coastal wetlands and sand dunes, provide diverse habitats for a wide range of
species. Gulls and terns began nesting in the early 1970s, and continued nesting by these species and night-herons
earned TTP the designation of an Environmentally Significant Area in 1982. Further, in 2015, this designation was
extended to the entire Spit due to rare species and/or rare communities, and significant ecological functions.

The diverse habitats at the park, along with the geographical position have made it a critical site for birds throughout
the year. To date, 323 species have been recorded at the park, and in 2000, the Leslie Street Spit/TTP was named an
Important Bird Area by BirdLife International. This designation is due to the globally significant populations of nesting
colonial waterbirds, the continentally significant numbers of overwintering waterfowl, and nationally significant numbers
of migratory birds.

2.     Colonial Waterbirds and Managed Waterfowl

     2.1 Project Background
                                                          Colonial waterbirds have a long history at Tommy Thompson
                                                          Park and are one of the reasons the park was designated a
                                                          globally significant Important Bird Area in 2000 (Wilson et al.,
                                                          2001).

                                                          In 2018, six species of colonial waterbirds nested at Tommy
                                                          Thompson Park, namely two species of tree-nesters (Black-
                                                          crowned Night-Heron and Great Egret), three species of
                                                          ground-nesters (Common Tern, Herring Gull and Ring-billed
                                                          Gull), and one species which nests both in trees and on the
                                                          ground (Double-crested Cormorant).

                                                          Double-crested Cormorant (D. Johnston)

                                                          -1-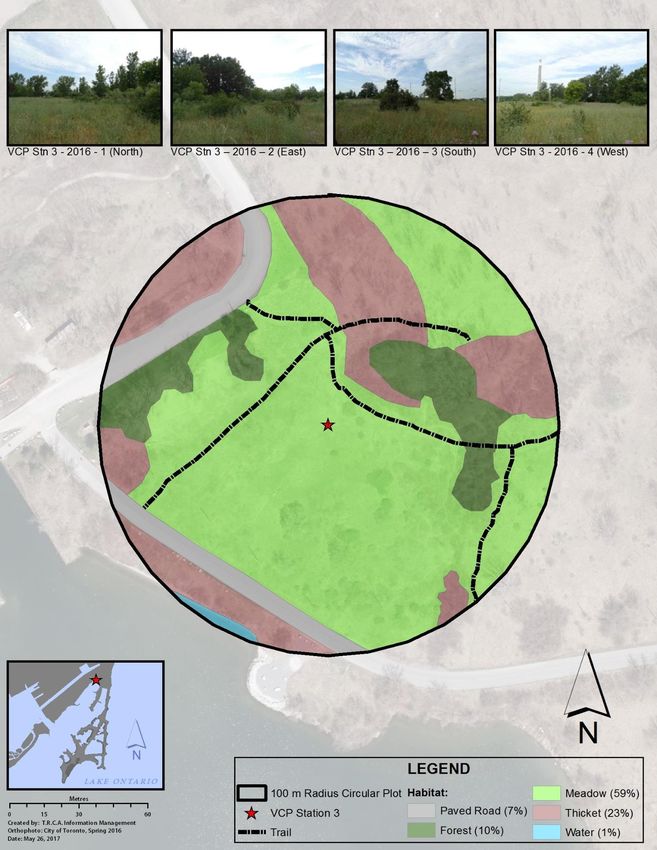
2.2 Population Estimate Methodology
Population estimates for tree nesting waterbirds, Double-crested Cormorants and Common Terns are conducted
annually, while population estimates for Ringed-billed Gulls typically occur every 5 to 10 years with the 10-year
survey coinciding with the Canadian Wildlife Service (CWS) decadal census. Individual Herring Gull nests are
monitored by the CWS for ongoing contaminant research, and TRCA does not usually undertake a population
census for this species. Caspian Terns are typically counted each year; however, they were absent from 2004 to
2011 and were not counted in 2012 due to their proximity to the ground nesting cormorant colony. Since 2014
Caspian Terns are counted following the Ground Nest Survey Methodology. Population estimates for any species
may also be undertaken more frequently in relation to other projects/studies or to address a population concern. All
estimates and analysis are conducted by trained TRCA staff and researchers, using in-field techniques. Upon
completion of the survey Microsoft Excel is used to store and analyze the population data.

   2.2.1 Tree Nest Survey Methodology

   Each spring an annual census is conducted during mid-June, at the peak nesting period to determine the
   number of breeding Double-crested Cormorant, Black-crowned Night-Heron and Great Egret pairs, and their
   nest distribution. Active nests of these species are counted by a team of observers who move systematically
   through the colony recording the tree number, tree species and number of nests of each bird species. As noted
   in Jarvie et al. (1999), each tree containing a nest is marked with a circular 2.5 cm metal tag bearing a unique
   number (National Band and Tag #85, 0.050 mm thick) attached with a single 5 cm galvanized roofing nail which
   is left out approximately 2.5 cm to allow for the growth of the tree without damage. Coordinates of each tree are
   recorded by GPS. All new nest trees are tagged and coordinates recorded. Every tree evaluated is marked with
   tree marking paint to identify that it has been counted. The tree coordinates and associated nest data are
   mapped with ArcView GIS software. Additionally, a sample of nest trees are evaluated in the late summer to
   assess their health.

   2.2.2 Ground Nest Survey Methodology

   The census for Common Tern and Ring-billed Gull is conducted at the peak nesting period, typically the last
   week of May or the first week of June to determine their breeding population. The Common Tern colonies nest
   on three floating reef-rafts and one artificial island. The colonies can be subject to predation/disturbance
   pressures that can result in asynchronous nesting, making it difficult to obtain a reliable estimate of the breeding
   population. Therefore, depending on the circumstances of the sub-colony, multiple population counts may be
   conducted throughout the breeding season. The reef-rafts are approximately 24m2, so all nests can be counted,
   noting the nest contents, by walking or canoeing the periphery of the raft. The artificially created tern island in
   the Cell One wetland is approximately 120m 2, and is more challenging to count because of its size and tall
   vegetation. Observers carefully walk the island in a grid pattern and note nests and nest contents. Since 2016, a
   single population count has been conducted for Common Tern colonies in mid-June by aerial photography from
   a helicopter. Individual nests can be seen in the images and are counted using GIS software by placing a dot on
   each nest.

   Ring-billed Gulls are surveyed at least every 10 years with the CWS decadal surveys, however CWS also
   monitors individual Herring Gull nests annually. Because of the large nesting area, the colony is divided into
   smaller, discrete sections, and all active nests are counted by section using the rope transect method. Ropes
   are used to delineate 1m wide transects and observers carefully walk the transect counting all active nests with
   a manual handheld tally counter and marking each nest with survey paint to identify that it has been counted.
   Herring Gull nests are recorded on a field data sheet and not included in the tally counter. The ropes are then
   moved to the next transect line until all active nests within the colony are counted. In years where individual
   nests are not counted, trained staff undertake population estimates of the Ring-billed Gull nesting area.

   Double-crested Cormorant ground nest estimates occur once management has largely stopped to account for
   birds that may have attempted to tree nest and instead ground nested. Nest counts for both cormorants and
   Caspian Terns are undertaken at the peak nesting period using aerial photography from a helicopter. This
   method minimizes disturbance to the ground nesting colonies. Individual nests can be seen in the images and
   are counted using GIS software by placing a dot on each nest.

                                                       -2-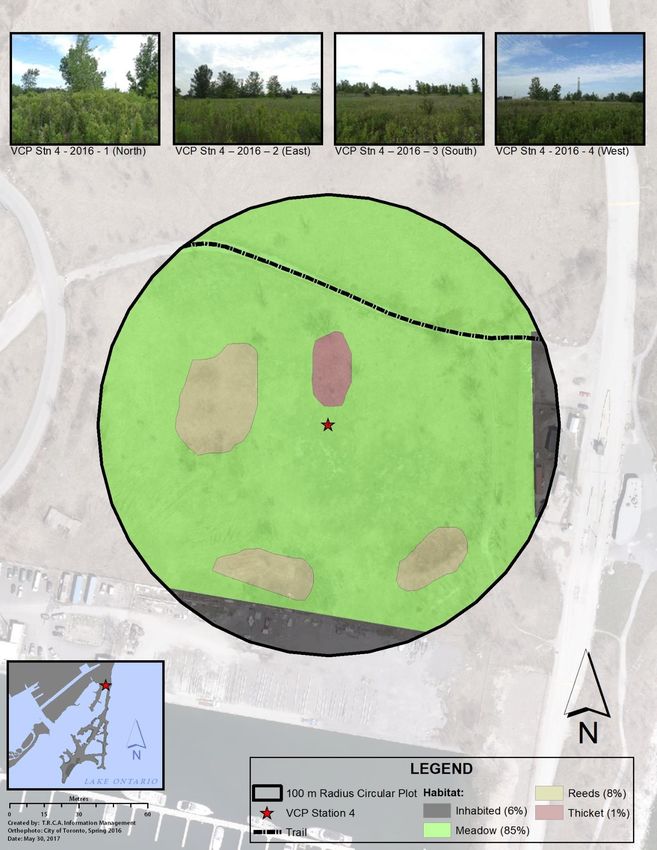
2.3 Results
In 2018 Double-crested Cormorants nested in trees on Peninsulas B and C, as well as on the ground on Peninsulas
A and B. Black-crowned Night-Herons nested at the base of Peninsula B. Great Egrets nested on Peninsula B.
Ringed-billed Gulls nested on the ground on Peninsulas A, B and C, and on the Embayment A Common Tern
nesting raft. Apart from one attempted nesting on the Endikement, Common Tern nesting only took place on the
artificial nesting raft in Embayment D. Caspian Tern nesting attempts were not observed. Peninsula B held the
only Herring Gull nest attempt that was observed. See Figure 2.A below for a map of all nesting locations.

         Figure 2.A. Colonial Waterbird Nesting Areas, 2018

    Cormorant nests numbered 14,515, including 10,506 ground nests (Figure 2.B). The overall population
    increased 13 percent, recovering from the three percent decline in 2017; tree nesting decreased 23 percent
    and ground nesting population increased by 37 percent over the previous year. As indicated in Figure 2.B, 72
    percent of the TTP cormorant colony nested on the ground in 2018. Ground nesting is a target of the Double-
    crested Cormorant Management Strategy, which aims to achieve a balance between a healthy, thriving
    cormorant colony and the other ecological, educational, scientific and recreational values at the park (TRCA,
    2008).

                                                    -3-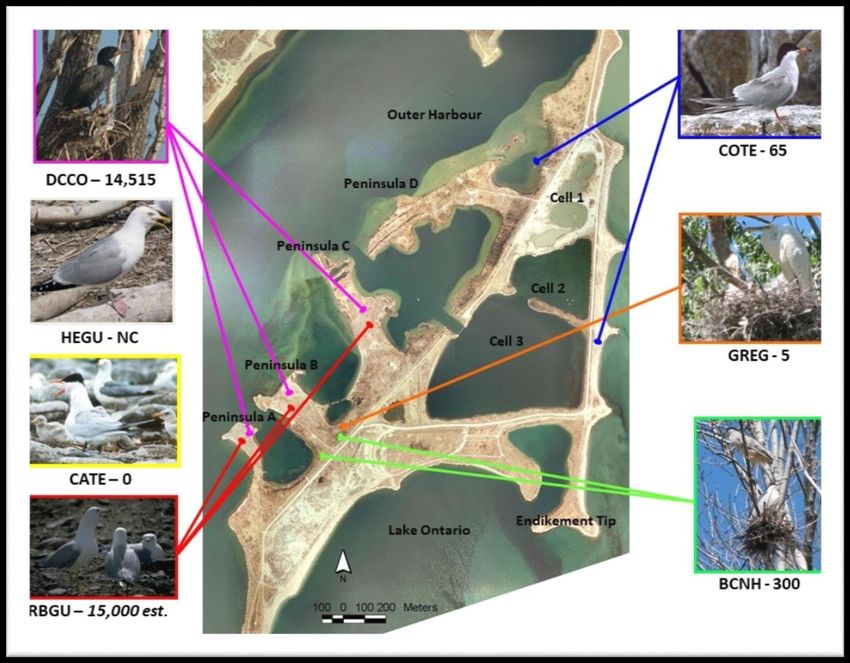
16000
                        Pen A tree
   14000                Pen A ground
                        Pen B tree
   12000
                        Pen B ground
   10000                Pen C tree
                        Total
    8000

    6000

    4000

    2000

           0

       Figure 2.B. Double-crested Cormorant Nests at TTP by Sub-colony, 1998 - 2018

Black-crowned Night-Heron nests numbered 300, a decrease of 16 percent from the previous year (Table 2.C).
Most night-heron nesting occurred at the base of Peninsula B, where they face less competition from
cormorants.

   1400

   1200
                                                                                      Pen B
   1000
                                                                                      Pen C
                                                                                      Total
    800

    600

    400

    200

       0

               Figure 2.C. Black-crowned Night-Heron Nests at TTP by Sub-colony, 1998 - 2018

                                                -4-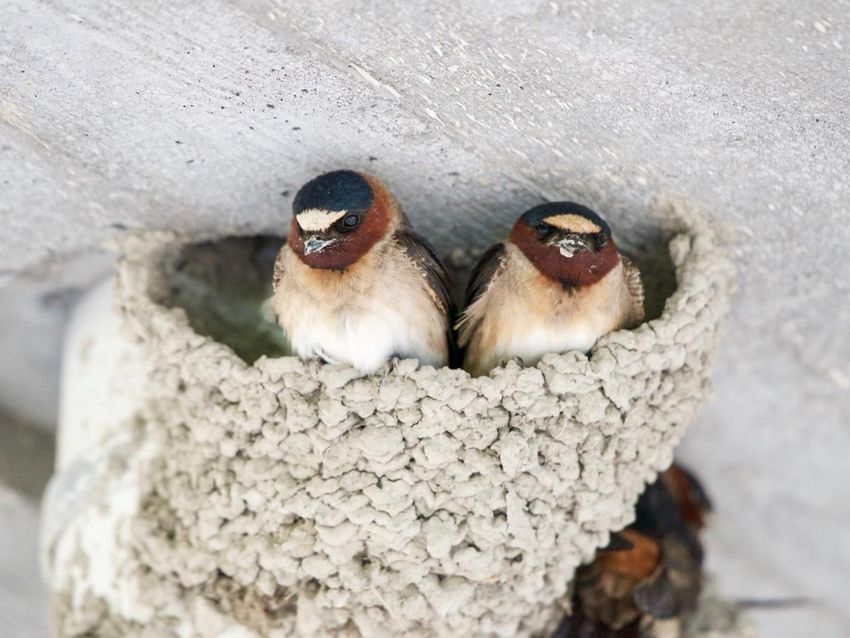
Great Egrets at Nest (D. Johnston)

Table 2.1. Colonial Waterbird Nests at TTP, 2008 – 2018

         2008      2009        2010       2011     2012      2013     2014      2015      2016      2017      2018
DCCO     6717      7564        9434       11374    11741    11990     12409    11908      13275    12,841    14,515
BCNH      455      617a         431        423      410      297       397       194       335       358      300
GREG       5          7          5          7        8           4      6         6         6         11       5
RBGU    30000     30000*      28000*      32000*   32000*   35000*    35000*   35000*    35000*      NC      15,000*
HEGU      30        NC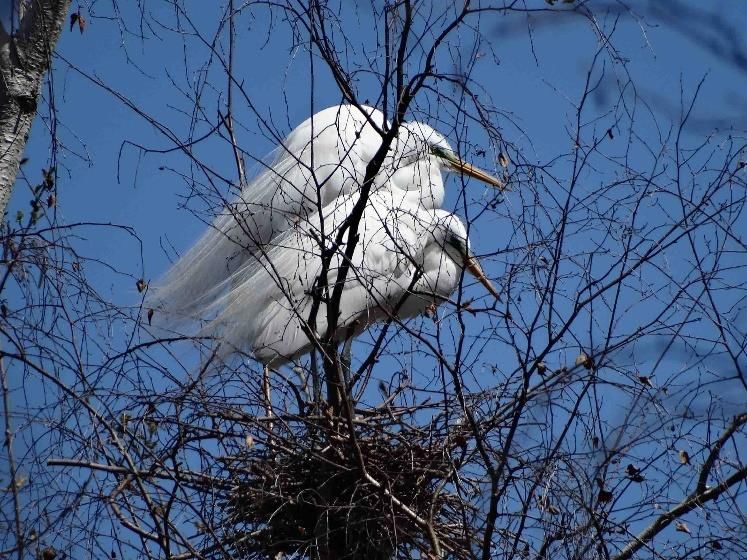
3. Landbirds and Non-colonial Waterbirds
3.1 Project Background
Until 2005, comparatively little effort had been put toward TTP’s nesting bird species other than the colonial
waterbirds of the previous section. The project detailed in this section of the report was initiated in 2005 as a
method of monitoring and documenting landbirds and non-colonial waterbirds for the site.
3.1.1 Rationale
The project is organized around monitoring of breeding landbird and non-colonial waterbird density and diversity
in response to habitat succession and restoration. Regular surveys of breeding landbird and non-colonial
waterbird species at TTP provide the following:
Relative abundance data
Detailed and accurate nest records
A measurement of breeding bird abundance and diversity in relation to landscape level change
Assessment of nesting success including parasitism and predation rates
Data that can help steer habitat restoration work
This project is appropriate for TRCA because the labour and material cost is low, and the expertise is both
readily available and able to provide monitoring of avian response to habitat restoration efforts. TRCA
volunteers, with some staff support, have carried out the project annually in spring and summer since 2005.
3.1.2 Change in Data Reporting
Commencing with the 2016 Breeding Bird Report, project data are presented on a rolling 10-year basis. (Data
from earlier years, commencing with 2005, the first year of the project, are available in earlier annual reports.)
Baltimore Oriole Feeding Young at Nest (P. Robillard)
3.2 Methodology
Starting in 2005, a combination of variable circular plot (VCP) counts, nest searching and casual observations was
employed from April – August each year (VCP counts restricted to June and July). Variable circular plot counts are
the most recognized method for assessing breeding bird density and were employed for the Ontario Breeding Bird
Atlas (OBBA). Nest searching and monitoring are also employed to provide valuable data on breeding success,
nesting ecology and relative density of nesting attempts. Casual observations were recorded to augment the
monitoring.
-6-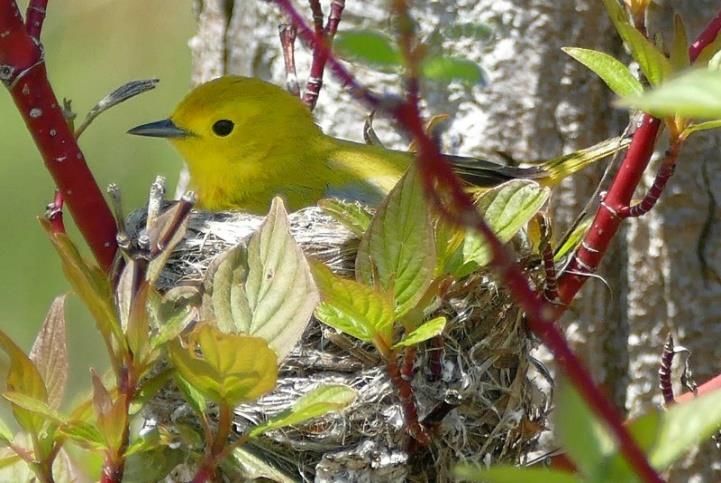
3.2.1 Variable Circular Plot (VCP) Protocol

The VCP counting method has been widely promoted by biologists over the more popular point count method,
as it is much more applicable to analysis and has less bias. Nine station locations were initially set up based on
the proportion of individual habitat types within the entire land area, and these locations have remained constant.

Between approximately June 15 and July 8, each of the nine stations is visited six times on a rotational schedule
such that time of day is equally represented at all stations. All counts are conducted between 7:00 am and 10:00
am and last 5 minutes at each station. The protocol involves recording start time, finish time, date and visit
number for each of the stations. Temperature, percentage cloud cover and wind speed are also recorded.
Counts are completed on days with fair weather conditions such that visibility is high, wind speed is low to
moderate (0-15 kph) and precipitation is absent. All birds detected are estimated to the following distance
parameters: 100 m. Any flyovers and any
birds detected beyond 100 m are recorded in separate columns. The circumstances of each detection are also
noted (e.g., observed, singing, territorial dispute, family group).

Station locations are distributed in the following manner: four in forest habitats, four in meadow communities
(wet and dry) and a single station was placed in an extensive shrub thicket (termed “shrubland”) which is
bordered by forest. A summary of station information is presented below in Table 3.1. The location of each
station is shown below in Figure 3.A, an annotated map of Tommy Thompson Park.

Table 3.1. VCP Station Information

 Station     UTM Zone          Easting         Northing      Location              Habitat Type
    1             17            635198          4834430      Baselands             Wet Thicket
    2             17            635206          4834217      Baselands             Forest
    3             17            634930          4834149      Baselands             Dry Meadow
    4             17            635300          4833940      Baselands             Dry Meadow
    5             17            635101          4832683      Neck                  Shrubland
    6             17            634360          4832165      Peninsula D           Forest
    7             17            634726          4831138      Flats                 Wet Meadow
    8             17            634220          4831453      Peninsula C           Forest
    9             17            634215          4831680      Peninsula C           Forest

 3.2.1.1     VCP Station Vegetation Protocol

 The habitats at the study area are relatively young in age and may be altered or enhanced through TRCA’s
 habitat restoration efforts, as well as natural succession. Changes in the habitats over time will also lead to
 changes in the bird communities and should be documented to help understand and interpret these data.
 Descriptions of the habitats for each of the VCP stations were initiated in 2010, repeated in 2013 and 2016,
 and should continue to be repeated every three years to help quantify changes in the vegetation communities.
 See Table 3.3 for the most recent station vegetation analysis.

 In any year in which the vegetation analysis is completed, stations are surveyed once during the nesting
 season (June or July) to record the dominant habitat (meadow, thicket, deciduous forest, mixed forest,
 wetland, sand dune/sand barren, roads/trails and Lake Ontario/open water), as well as the dominant group of
 vegetation. Surveyors estimate major type of habitat by percentage via a field visit and orthophoto
 interpretation. Habitat types must sum to 100% per station. The dominant habitat types are sketched out from
 a bird’s-eye perspective. Dominant groups of vegetation communities are estimated for each station, but do
 not necessarily need to sum to 100%, as vegetation that is sub-dominant or areas without vegetation are not
 included in this total. See Appendix A for station maps.

3.2.2 Nest Searching and Monitoring Protocol

The nest searching survey method is valuable to bird conservation because it provides indicators of breeding
success and parasitism/predation rates. As shown in Appendix B, the entire land area encompassing Tommy
Thompson Park/Leslie Street Spit was divided into six survey zones (i.e., A – F). Participants are assigned
zones to avoid overlap in data collection, and effort is recorded separately for each zone. Table 3.2 describes
the primary habitat for each zone.
                                                    -7-
Table 3.2. Primary Habitat Type by Zone
Zone Primary Habitat Type
A forest, meadow
B meadow, shrubland, forest
C forest
D meadow, shrubland, barrens (lakefill)
E Meadow, barrens (lakefill)
F meadow, forest
Starting in mid-April and continuing until early September, the zones (excluding colonial waterbird nesting areas)
are searched carefully for evidence of nesting, focusing primarily on the woodland and shrubland edges
favoured by species nesting at TTP. Once the nest of any landbird or non-colonial waterbird is discovered, the
UTM co-ordinates are determined by GPS and recorded in field notebooks, along with a description of the nest
and the habitat. Following discovery of a nest, and to the extent that time and personnel are available, the nest
is monitored to determine the outcome, as well as any incidence of parasitism.
Commencing in 2012, a change in protocol was adopted with regard to ground-nesting birds. In order to avoid
providing a trail which would lead predators to ground nests, project participants no longer actively seek and
monitor such nests. As a result, only ground nests found accidentally are recorded, and no follow-up monitoring
to determine nest outcome is conducted. Species affected by this change include American Woodcock, Belted
Kingfisher, Canvasback, Eastern Meadowlark, Gadwall, Killdeer, Mallard, Savannah Sparrow, Song Sparrow
and Spotted Sandpiper. These species represented 7% of nests found from 2005 to 2011, inclusive, and 2% of
nests found since 2011, so the change in protocol has had some affect, although these species have never
represented a significant portion of the nests that are found each year.
While most nest records gathered are submitted to Project NestWatch at Bird Studies Canada, nests discovered
after nesting is complete are typically not. Researchers are able to access Project NestWatch data via BSC’s
NatureCounts tool. Past Breeding Bird Reports are available at www.ttpbrs.ca.
3.3 Results
3.3.1 Variable Circle Plot Point Count Results
3.3.1.1 VCP Station Vegetation Survey
Table 3.3 below depicts the result of vegetation surveys conducted in 2010 and 2016 for each station. In
addition, Appendix A contains a habitat sketch and photographs for each station in 2016. (The habitat
sketches and photographs from 2010 can be found in the Breeding Bird Reports of 2010 – 2012, while the
sketches and photographs from 2013 can be found in the reports of 2013 - 2015.)
As can be seen from Table 3.3, several changes in habitat have occurred over the past six years. This is not
surprising, however, since most of TTP is intentionally left to naturally succeed on its own. Changes of note
include:
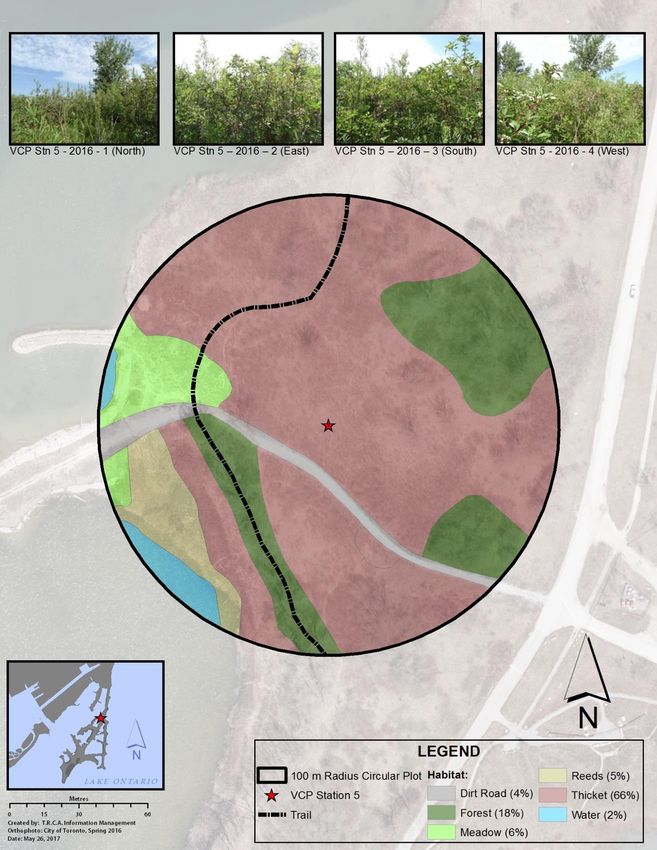
Station 1: The wetland increase has resulted largely from the spread of phragmites.
Station 2: The meadow areas observed in 2010 have been completely overtaken by dogwood and willow.
Station 3: Some meadow has been replaced by thicket and forest.
Station 4: A portion of the meadow has been overtaken by phragmites, shrub willows and goldenrod.
Station 5: The area along the shoreline has been largely rebuilt, resulting in less shoreline and water, and
more reeds. The dogwood and forest have also increased significantly.
Station 6: The sand barren has been overgrown by the vegetation.
-8-Figure 3.A Annotated Map of TommyThompson Park with VCP Stations
-9-Station 7: The increase in non-vegetation area reflects significant lake-filling in the last two years.
Station 9: Station 9 is located within the cormorant colony, and the effect of the nesting behaviours from
these birds has been the loss of many trees and other vegetation.
Table 3.3. 2010 - 2016 VCP Station Vegetation Analysis
2010 OBSERVATIONS
VCP Station
1 2 3 4 5 6 7 8 9
% of Major Habitats Within 100 m Radius of Each VCP Station
Meadow (tree cover ≤ 25%; shrub cover ≤ 25%) 55 40 70 95 10 85 5 5
Thicket (tree cover ≤ 25%; shrub cover ≥ 25%) 15 20 20 65 20 20 20
Deciduous Forest (tree cover ≥ 60%) 25 40 5 10 50 65 60
Mixed Forest (tree cover ≥ 60%; conifers ≥ 25%)
Wetland (permanently saturated; water ≤ 2 m) 5
Vegetation Sub-total (see detail below) 100 100 95 95 85 70 85 90 85
Sand Dune/Sand Barren (incl active shorelines) 5
Roads/Trails 5 5 5 10
Lake Ontario Shoreline (open water) 10 25 5 10 15
Non-vegetation Sub-total 5 5 15 30 15 10 15
Total of All Habitats 100 100 100 100 100 100 100 100 100
Dominant Vegetation Within 100 m of Each VCP Station
Poplars (e.g., Eastern Cottonwood) 20 35 5 5 10 40 5 55 45
Dogwoods (e.g., Red-osier Dogwood) 10 15 10 20 15 5 15
Honeysuckles 10
Shrub Willows 10 5 5 5 30 5 5 5
Grasses and Sedges 55 40 65 60 15 45 20 10
Goldenrods and Asters 5 10 20 10 20 5
Reeds (e.g., Cattails, Bulrushes) 5 5 5
Miscellaneous Herbs (e.g., Vetch, Nettles, etc.) 10 10
Vegetation Sub-total 100 100 95 95 85 70 80 90 85
2016 OBSERVATIONS
VCP Station
1 2 3 4 5 6 7 8 9
% of Major Habitats Within 100 m Radius of Each VCP Station
Meadow (tree cover ≤ 25%; shrub cover ≤ 25%) 52 59 85 6 3 78 6 12
Thicket (tree cover ≤ 25%; shrub cover ≥ 25%) 7 59 23 1 66 23 14 21
Deciduous Forest (tree cover ≥ 60%) 20 41 10 18 51 70 19
Dead Deciduous Forest 30
Mixed Forest (tree cover ≥ 60%; conifers ≥ 25%)
Wetland (permanently saturated; water ≤ 2 m) 18 8 5 2
Vegetation Sub-total (see detail below) 95 100 92 94 95 77 80 90 82
Sand Dune/Sand Barren (incl active shorelines) 2 3
Roads, Trails and other man-made areas 3 7 6 3 20
Lake Ontario Shoreline (open water) 1 2 23 8 15
Non-vegetation Sub-total 5 8 6 5 23 20 10 18
Total of All Habitats 100 100 100 100 100 100 100 100 100
Dominant Vegetation Within 100 m of Each VCP Station
Poplars (e.g., Eastern Cottonwood) 25 35 5 5 15 40 5 60 30
Dogwoods (e.g., Red-osier Dogwood) 15 40 15 50 15 5 20
Honeysuckles 12
Shrub Willows 5 5 5 20 5 5 5
Grasses and Sedges 35 20 35 45 5 5 40 15 10
Goldenrods and Asters 5 30 10 5
Reeds (e.g., Cattails, Bulrushes, Phragmites) 20 8 5 5 5
Miscellaneous Herbs (e.g., Vetch, Nettles, etc.) 27 1 15 17
Vegetation Sub-total 95 100 92 94 95 77 80 90 82
- 10 -While some VCP locations have not seen a major change in vegetation over the course of the project, others
have demonstrated significant change. The following photographs demonstrate one station (4) which is an
example of the former and two stations (2 and 9) which are examples of the latter.
The south view at Station 4 (dry meadow) has seen little change over the life of the project other than changes
in the make-up of the ground cover.
2010 2013 2016
Station 2 (forest – north view) exhibits little change between 2010 and 2013, but very noticeable additional
shrub growth between 2013 and 2016.
2010 2013 2016
Station 9 (forest – north view) is located within the Double-crested Cormorant colony, and the effect of the
birds’ excrement on both the trees and the ground-level vegetation can be seen from 2010 to 2013 to 2016.
2010 2013 2016
3.3.1.2 VCP Observations
Analysis of VCP count data presented here is a basic summation of results. More sophisticated analysis will
require the use of software such as DISTANCE (a software package that allows users to estimate the size or
density of biological populations).
- 11 -Table 3.4. VCP Species Lists and Total Birds Detected by Species Within 100 Metres
Species 2009 2010 2011 2012 2013 2014 2015 2016 2017 2018 AVG
ALFL 1 0
AMGO 8 22 35 8 14 19 7 37 36 19 20
AMKE 1 0
AMRO 26 34 41 40 22 15 25 23 27 26 28
AMWO 1 1 0
BANS 5 4 14 35 7 22 4 106 7 9 21
BAEA * 0
BAOR 23 13 28 22 26 21 25 15 23 19 22
BARS 11 8 32 31 22 15 55 48 41 68 27
BCCH 2 4 3 1 3 5 7 2 3 3
BEKI 2 1 1 0
BGGN 8 3 2 3 2 2
BHCO 19 19 10 17 12 5 3 6 7 3 11
BLJA 1 1 1 1 1
BLPW 1 0
BOBO 0
BRTH 1 3 1 1
CANG * * 7 1
CEDW 39 19 31 47 17 16 12 18 12 1 22
CHSW * 2 3 2 2 1
CLSW *
COGR 9 17 23 8 12 5 17 5 11 14 12
COHA 1 0
COYE 2 2 4 1 1
DOWO 2 1 1 1 2 1 1
EAKI 12 20 18 12 7 2 9 3 6 8 11
EAME 1
EAWP 3 1 8 6 8 6 9 7 2 2 5
EUST 116 41 52 39 8 44 9 46 18 18 41
FISP 0
GADW * 1 16 * 2 * 2 2
GBHE * 0
GCFL 3 1 1 0
GRCA 17 38 16 21 16 21 12 18 22 18 20
HOFI 1 0
HOSP 0
HOWR 2 1 1 1 0
KILL 8 3 2 5 4 5 2 7 4
LEFL 7 11 11 8 10 4 5 1 3 6 7
MALL 4 * * 2 5 1 1
MAWA 1 0
MODO * 3 1 2 1 1
NOCA 4 3 1 2 5 3 3 10 21 17 5
NOFL 2 2 2 4 1
NOMO * 1 1 1 0
NRWS 8 5 14 * 4 * 9 10 5 7 6
OROR 1 1 1 2 2 5 1
RBNU 1 0
REVI 1 0
ROPI 0
RWBL 312 199 244 295 265 276 247 192 214 316 245
SAVS 1 1 0
SOSP 81 55 46 50 66 47 51 59 57 102 58
SPSA 6 3 4 2 1 5 7 2 2 1 4
TEWA 1 0
TRES 9 16 24 11 25 30 52 41 54 37 28
TRFL 1 2 2 1
VEER 0
WAVI 41 30 39 50 53 46 32 46 27 44 39
WIFL 26 14 25 16 17 20 18 16 27 24 20
YEWA 134 100 168 136 146 166 155 169 181 201 146
Birds 950 685 913 862 783 816 783 898 840 979 820
Species 36 32 30 28 34 37 29 32 38 32 33
* Species observed beyond 100 metres and/or flying over
- 12 -Species recording a new high VCP count for the most recent 10 years were Barn Swallow, Northern Flicker, Orchard Oriole, Red-winged Blackbird, Song Sparrow and Yellow Warbler. In addition, the total number of birds recorded in all VCP counts exceeded the previous high for the past ten years. Prior to 2015, swallows were recorded differently by different project participants during the VCP counts, with the result that swallow numbers in Table 3.4 are somewhat understated for the years 2006 – 2014. A summary of abundance per species detected by VCP counts (
Station 9 is surrounded by the Double-crested Cormorant colony, with the excretions from the birds having
 largely defoliated the trees and other vegetation, resulting in very limited biodiversity. However, lamb’s
 quarters, which produces a thick herbaceous vegetation up to almost three m in height, was able to grow in
 this area in 2018 and provided cover for birds to forage, particularly Song Sparrows. In addition, the nearby
 vegetation beyond the cormorant colony has become more nest-friendly in recent years, which also helps to
 explain the increased number of birds recorded in 2018.

 Future years’ observations will be required to determine whether the increased abundance observed at both
 stations 8 and 9 in 2018 was an anomaly or not. See Appendix A for station locations.

                                           180
                                                                                                                                      2009
                                           160
                                                                                                                                      2010
                                           140
                   Abundance per Station

                                                                                                                                      2011
                                           120
                                                                                                                                      2012
                                           100
                                                                                                                                      2013
                                            80
                                                                                                                                      2014
                                            60
                                                                                                                                      2015
                                            40
                                                                                                                                      2016
                                            20
                                                                                                                                      2017
                                             0
                                                                                                                                      2018
                                                    Stn 1     Stn 2    Stn 3    Stn 4   Stn 5    Stn 6   Stn 7    Stn 8     Stn 9

 Figure 3.B. Total Bird Abundance per VCP Station

 Species richness, or diversity, is shown in Figure 3.C below. In 2018, Stations 1 (wet thicket) and 6 (forest)
 experienced diversity that was significantly lower than the most recent 10-year average. The other stations
 were all within 10% of the 10-year average for the station.

 As with bird abundance, species diversity at Stations 8 and 9 suffers in comparison to the other stations due to
 the dense vegetation and Black-crowned Night-Herons at Station 8 and the lack of biodiversity caused by the
 Double-crested Cormorants at Station 9.

                           25
                                                                                                                                        2009
                           20                                                                                                           2010
                                                                                                                                        2011
  Species per Station

                           15                                                                                                           2012
                                                                                                                                        2013

                           10                                                                                                           2014
                                                                                                                                        2015

                                    5                                                                                                   2016
                                                                                                                                        2017
                                                                                                                                        2018
                                    0
                                                 Stn 1      Stn 2     Stn 3    Stn 4    Stn 5    Stn 6    Stn 7     Stn 8     Stn 9

Figure 3.C. Species Richness per VCP Station

                                                                                        - 14 -
3.3.2 Nest Searching and Monitoring Results
In 2018, 10 volunteers contributed a total of 676 hours to the project. This level of participation is a continuation
of recent years’ volunteer experience, which has been a major contributor to the number of nests which have
been found over the past few years. Figure 3.D shows the breakdown of effort per zone. Zone D continued to
experience the fewest number of nests, due to lack of suitable habitat and the conversion of Cell 2 to wetland, so
that limited monitoring time continued to be required in that zone.
See Appendix B for a map of the TTP breeding bird survey zones.
200
Zone A
Hours per Zone
150
Zone B
100 Zone C
Zone D
50
Zone E
0 Zone F
2009 2010 2011 2012 2013 2014 2015 2016 2017 2018
Figure 3.D. Nest Searching Effort per Zone from 2009 to 2018 (hours)
The use of standard nest searching data forms, along with greater nest searching and monitoring effort,
combined with experience gained in previous years, have proved to be very successful in increasing the number
of nests found in the most recent years of the project. In 2018, a total of 1,027 nests was discovered,
significantly higher than the most recent 10-year average of 807. Of the total, 663 nests were monitored and
reported to Bird Studies Canada’s Project Nestwatch (see Tables 3.5 and 3.7).
Warbling Vireo Constructing Nest (P. Robillard)
- 15 -Table 3.5. Total Nests by Species from 2009 to 2018
Species 2009 2010 2011 2012 2013 2014 2015 2016 2017 2018 AVG
AMGO 44 33 23 13 17 18 16 23 26 14 23
AMRO 93 69 115 93 93 89 78 113 125 104 97
AMWO 3 1 1 1 1 1
BANS 4 2 1 15 16 4
BAOR 9 10 17 16 15 35 17 18 24 16 18
BARS 3 2 4 11 26 31 24 29 49 51 23
BBCU 1 1 0
BCCH 2 1 2 1 2 2 1
BEKI 1 0
BGGN 3 2 4 6 7 6 4 4 4
BRTH 4 2 2 1 2 2 2 1 2
CANV 1 0
CEDW 40 14 21 23 19 37 40 49 33 35 31
CLSW 24
COGR 4 4 2 3 2 5 5 1 7 3
DOWO 1 1 1 1 1 2 3 1 1
EAKI 22 14 12 27 21 20 27 24 25 21 21
EAME 1 0
EAWP 1 1 1 1 0
EUST 7 12 4 5 8 4 5 3 1 2 5
GADW 3 1 3 4 1 2 1 1 2
GRCA 23 11 16 21 24 34 30 46 33 21 26
HOFI 2 0
HOSP 0
HOWR 2 2 1 1 3 1
KILL 8 13 2 4 3 4 3 4 5 1 5
LEBI 2 0
LEFL 3 1 3 2 1 1
MALL 12 12 6 9 8 5 5 8 5 2 7
MODO 3 1 1 1 3 1
NOCA 4 1 1 1 3 2 4 14 12 4
NOFL 3 3 1 1 5 3 2
NOMO 2 0
NRWS 2 1 1 2 2 1
OROR 2 1 2 3 2 1 2 1 3 2
RWBL 130 167 232 268 310 361 404 356 464 418 311
SOSP 7 8 2 3 2 8 10 7 4 10 6
SPSA 5 8 4 5 6 3 6 3 5 4 5
TRES 9 9 5 5 12 13 20 20 28 15 14
TRUS 1 1 1 1 2 1
WAVI 7 9 15 12 13 31 12 18 21 18 16
WIFL 25 15 12 14 13 18 15 19 18 15 16
WODU 1 0
YEWA 75 82 88 86 127 164 189 237 253 211 151
Total 549 512 595 633 733 902 926 1,018 1,175 1,027 807
Total Effort
404 427 385 397 360 542 538 618 596 676 494
(hours)
Efficiency
1.36 1.2 1.54 1.59 2.04 1.67 1.72 1.65 1.97 1.52 1.63
(nests/hour)
Note: A Trumpeter Swan nest was observed in 2014, but not included in the 2014 report. As another nest was
observed in 2015 and reported to ONRS, it was decided to include the unreported 2014 nest in subsequent reports for
completeness. The Trumpeter Swan is the species of swan native to the Toronto region. Nearly extirpated in the early-
mid 1900s, recovery efforts in southern Ontario are seeing success. From 2013 through 2017, there has been one nest
annually at TTP, fledging between five and seven cygnets. In 2018, there were two successful nests.
- 16 -The 1,027 total nests located in 2018 were significantly fewer than the 1,175 nests found in 2017, and surprising
after fairly steady annual increases in the number of nests. The 2018 total is similar to the totals of 2014 – 2016,
so it may be that 2017 will turn out to be a one-time experience. In retrospect, possible reasons for 2017 having
been higher include:
a) 2017 was the year of extraordinary water levels in Lake Ontario, resulting in higher than normal levels of
insects for the birds to eat. This may have encouraged some species to have second (or more) broods.
b) Heavy rains in the spring of 2017 destroyed some early nests, particularly those of Red-winged Blackbirds
and American Robins, again possibly resulting in second (or more) nestings.
Subsequent years will determine whether 2017’s total was unique or not.
The reasons for the continued high number of nests include: (a) extensive tree and shrub planting by TRCA over
recent years; (b) the natural spreading and maturation of appropriate breeding habitat in some areas, particularly
dogwood, honeysuckle and reeds, which represent the most common hosts for Red-winged Blackbirds and
Yellow Warblers, the most prolific non-colonial-waterbird nesters at TTP; (c) the ever-increasing nest-searching
skills in the project participants; (d) the availability of more volunteer effort; and (e) the discovery of areas rich in
nests that had not been explored until recent years.
Table 3.6 lists those species realizing new nest highs for the project in 2018.
Table 3.6. Species Reaching New Nest Highs in 2018
Increase in Number of Nests
Species
over Previous High
Barn Swallow 4%
Cliff Swallow New in 2018
Common Grackle 40%
House Finch 100%
House Wren 50%
Mourning Dove 200%
Northern Mockingbird New in 2018
Trumpeter Swan 100%
Five species nesting in 2018 deserve special mention.
There were two first-time nesters for TTP: Cliff Swallow and Northern Mockingbird. Cliff Swallows nested on one
of the TRCA buildings erected in 2011/2012 and between that and another building produced a remarkable 24
nests.
Northern Mockingbirds have frequented the area around TTP for several years, presumably nesting nearby, and
often being seen visiting TTP. Thus, it was expected that they would eventually nest at TTP and, in 2018, two
nests were found at TTP.
In addition to the new nesting species, nesting by three other species was confirmed by the presence of
recently-fledged young: Bank Swallow, Black-capped Chickadee and Least Bittern. The area used for nesting
by several Bank Swallows (another species listed as Threatened in Ontario) in 2016 and 2017 was not used in
2018, but another suitable area was obviously found. It is encouraging that Least Bitterns (yet another
Threatened species in Ontario) returned for a second year of nesting at TTP.
Table 3.6 also points out that Common Grackle nests were up significantly in 2018. The nests of this species
can be difficult to find, but a number were located in Triangle Pond in 2018. While significant increases over
previous highs were recorded for House Finch, House Wren, Mourning Dove and Trumpeter Swan, the
percentage increases shown in Table 3.6 are somewhat misleading since these four species all nest in such
small numbers at TTP.
Nest-searching efficiency figures (Table 3.5) can be misleading, as they are highly dependent on an area’s
vegetation (e.g., forest versus shrubland), the species found in the dominant habitat (e.g., shrub nesters versus
high tree nesters) and the time spent on monitoring as opposed to finding nests. The efficiency realized in 2018
was down somewhat from recent years.
- 17 -3.3.2.1 Changes in Nest Density for Each Zone
In looking at the contribution of each zone to the overall number of nests each year, it is useful to examine the
nest density of each zone, as shown in Figure 3.E
8
7
6
NESTS PER HECTARE
5
4
3
2
1
0
2009 2010 2011 2012 2013 2014 2015 2016 2017 2018
ZONE A B C D E F
Figure 3.E Nest Density by Zone
In Figure 3.E, the nest density is determined by the number of nests per hectare. (In this chart, the number of
hectares for Zone F has been reduced to eliminate the area occupied by the colonial waterbird nests.) A map
of the zones can be found in Appendix B.
In general, the nest density has increased in each zone over the most recent 10 years. This can be
attributed to the same reasons given in the previous section for the increase in overall nest numbers
in the last few years.
There is, of course, a spike in nest density in 2017, which reflects the high number of nests found
that year. It is interesting, however, that there was no spike in Zones B and D.
Zones A and E have shown the greatest increase in nest density over the past 10 years, probably
primarily because of the increase in nest-friendly shrubs in these zones. As they are the two largest
zones, they have therefore contributed significantly to the overall increase in nest totals.
Zone B, the smallest zone, had the highest nest density until 2017, and levelled off after 2014. A
possible reason for this and the lack of a spike in 2017 could be the shrubs in a major section
becoming so dense in recent years as to restrict nesting opportunities.
Zone D has shown the least growth in nest density, and this and the lack of a spike in 2017 would
been due to (i) the considerable construction on the Endikement and in Cell 2 in recent years, and
(ii) the lack of trees in this zone, which means fewer nesting options and also less protection for the
other vegetation.
It will be interesting to see the direction that the nest density takes in each zone in future years as the
vegetation continues to evolve.
- 18 -3.3.2.2 Nest Productivity
A total of 663 nests was recorded online with Bird Studies Canada’s Project NestWatch in 2018 (Table 3.7). In
terms of nest productivity, 86 (i.e., 20%) of 421 nests with known outcomes failed, while 335 were successful in
fledging young. The remaining 244 monitored nests had unknown outcomes. (The nests with unknown
outcomes included all ground nests from Canvasback, Gadwall, Killdeer, Mallard, Song Sparrow and Spotted
Sandpiper, which, commencing in 2012, were not monitored once found.)
As can be seen in Table 3.7, the 2018 nest failure rate of 20% is the lowest of the last 10 years. Nest predation
continues to be the most common cause of nest failure. Possible predators at TTP include raccoons,
gartersnakes, mink and coyotes, as well as other bird species. Of the 86 failures, 33 occurred at the egg
stage, 5 at young stage and 48 at either egg or young stage.
Table 3.7. Nest Productivity from 2009 to 2018
2009 2010 2011 2012 2013 2014 2015 2016 2017 2018 AVG
Nests discovered 549 512 595 633 733 902 926 1,018 1,175 1,027 807
Nests monitored &
456 440 430 464 549 690 657 702 801 663 585
reported to NestWatch
Unknown outcome 170 213 155 213 266 232 226 211 301 244 223
Known outcome 286 227 275 251 283 458 431 491 500 421 362
Successful 162 144 177 171 186 338 323 388 394 335 262
Failed 124 83 98 80 97 120 108 103 106 86 101
Failure rate 43% 37% 36% 32% 34% 26% 25% 21% 21% 20% 28%
Figure 3.F demonstrates how the known nest failure rate has been steadily trending down. One can speculate
on the reasons for this, but confirming them is beyond the scope of the current project.
50
Nest Failure Rate
40
30
20
10
0
2004 2006 2008 2010 2012 2014 2016 2018 2020
Year
Figure 3.F Known Nest Failure Rate Trend
In Table 3.8, all years of the project are shown because the “Other Species Observed” has been adjusted to
eliminate species that would never breed at TTP, such as most shorebirds and north-nesting warblers. In
previous reports, these northern breeders were included in the “Other Species Observed” tally. As can be
seen in Table 3.8, the 44 confirmed breeders and 71 total species detected in 2018 are at the high end of the
numbers recorded over the entire project to date. (In the first two years of the project, as is apparent in Table
3.8, species were more likely to be categorized as Possible Breeders rather than Other Species Observed, as
has been the practice since 2007 when there is no evidence of breeding intent observed.)
The first section of Table 3.8 provides a breakdown of the 44 confirmed breeders in 2018. Nests of 32 species
of landbirds were found in 2018. To this were added Brown-headed Cowbird and three other species
confirmed as breeders by the presence of recently fledged young: Bank Swallow, Black-capped Chickadee
and Least Bittern. When the six confirmed colonial waterbird nesters (i.e., Black-crowned Night-Heron,
- 19 -Common Tern, Double-crested Cormorant, Great Egret, Herring Gull and Ring-billed Gull), as well as Canada
Goose and Mute Swan, are added, the total becomes 44 species nesting at TTP in 2018.
Table 3.8. Summary of Species Detected During Breeding Season From All Studies
2005
2006
2007
2008
2009
2010
2011
2012
2013
2014
2015
2016
2017
2018
Breeding Species:
A Colonial Waterbirds 7 7 6 6 6 6 6 7 7 7 5 7 5 6
Managed Waterfowl 2 2 1 2 2 2 2 2 2 2 2 2 2 2
Sub-total 9 9 7 8 8 8 8 9 9 9 7 9 7 8
B Landbirds 26 36 37 26 28 31 28 29 26 32 29 30 33 33
Nests confirmed by young 1 1 0 2 5 2 3 0 1 3
Sub-total 26 36 37 26 29 32 28 31 31 34 32 30 34 36
Confirmed Breeding Species
35 45 44 34 37 40 36 40 40 43 39 39 41 44
(total of above)
Probable Breeding Species 10 4 5 10 11 2 4 3 5 5 3 4 3 2
Possible Breeding Species 22 19 11 15 14 8 3 6 4 8 14 11 8 5
Other Species Observed 2 9 10 10 11 14 17 11 8 15 12 17 20
Total Species Detected 67 70 69 69 72 61 57 66 60 64 71 66 69 71
Looking at the past 10 years of data, some conclusions and trends continue to emerge. As noted previously,
Bobolink, Eastern Meadowlark and Savannah Sparrow have virtually disappeared from both the VCP counts
and confirmed nests, although there has actually never been a confirmed Bobolink nest at TTP. Herbaceous
vegetation at TTP is becoming denser, which has an adverse effect on nesting suitability for these and other
ground-nesting species. At the same time, the spread of dogwood, honeysuckle and reeds, as well as tree and
shrub planting by TRCA, has created more nesting opportunities for species such as Red-winged Blackbirds,
American Robins and Yellow Warblers.
Yellow Warbler on Nest (P. Robillard)
3.3.2.3 Parasitism by Brown-headed Cowbirds
Brown-headed Cowbird parasitism is a major issue for small landbird populations in more open habitats and
forest fragments. In 2018, a total of 29 nests of five species were parasitized by Brown-headed Cowbirds,
including for the first time during the project, House Finch (Table 3.9). (For purposes of this report, a nest was
considered parasitized if a cowbird egg was observed, regardless of what happened to that egg.) The
parasitism rates in Table 3.9 were calculated as the ratio of parasitized nests to the total parasitized and non-
parasitized nests. (Note that nests of parasitized species were not included in this table unless evidence of
parasitism, or lack thereof, could be confirmed.)
- 20 -The overall rate of parasitism in 2018 of 10% matched the lowest rate experienced during this project. Red-
winged Blackbirds, the most heavily parasitized species at TTP in terms of total number of nests parasitized,
reached its lowest rate of parasitism at 9% in 2018.
Based on the average rate of parasitism over the past 10 years, Red-winged Blackbirds, Song Sparrows and
Yellow Warblers are the most heavily parasitized species, each with an average rate of around 20% per year
of observable nests (see Table 3.9). (House Finch shows a higher average rate, but this is based on only two
nests.).
Table 3.9. Brown-headed Cowbird Parasitism Data and Rates from 2009 to 2018.
Brown-headed Cowbird Parasitism
Red-
American American Gray House Northern Song Willow Yellow
winged Totals
Goldfinch Robin Catbird Finch Cardinal Sparrow Flycatcher Warbler
Blackbird
Nests checked* 21 44 23 0 4 112 4 24 68 300
2009
No. parasitized 5 0 0 0 0 32 2 4 34 77
% parasitized 24% 0% 0% 0% 0% 29% 50% 17% 50% 26%
Nests checked* 19 28 11 0 1 110 4 11 66 250
2010
No. parasitized 0 0 0 0 0 27 1 2 21 51
% parasitized 0% 0% 0% 0% 0% 25% 25% 18% 32% 20%
Nests checked* 13 26 16 0 0 81 2 11 36 185
2011
No. parasitized 2 0 0 0 0 18 0 0 10 30
% parasitized 15% 0% 0% 0% 0% 22% 0% 0% 28% 16%
Nests checked* 8 17 19 0 1 77 2 8 33 165
2012
No. parasitized 0 0 0 0 0 30 0 2 7 39
% parasitized 0% 0% 0% 0% 0% 39% 0% 25% 21% 24%
Nests checked* 9 26 20 0 1 145 2 11 75 289
2013
No. parasitized 1 1 0 0 0 33 0 1 22 58
% parasitized 11% 4% 0% 0% 0% 23% 0% 9% 29% 20%
Nests checked* 10 27 27 0 3 134 6 13 96 316
2014
No. parasitized 0 0 0 0 0 22 0 2 11 35
% parasitized 0% 0% 0% 0% 0% 16% 0% 15% 11% 11%
Nests checked* 5 18 21 0 2 181 7 7 82 323
2015
No. parasitized 0 0 1 0 0 27 1 0 8 37
% parasitized 0% 0% 5% 0% 0% 15% 14% 0% 10% 11%
Nests checked* 7 38 18 0 4 133 3 12 123 338
2016
No. parasitized 0 0 1 0 0 26 0 1 28 56
% parasitized 0% 0% 6% 0% 0% 20% 0% 8% 23% 17%
Nests checked* 12 45 20 0 7 182 4 12 128 410
2017
No. parasitized 1 0 0 0 1 24 1 1 12 40
% parasitized 8% 0% 0% 0% 14% 13% 25% 8% 9% 10%
Nests checked* 6 34 10 2 6 153 6 9 73 299
2018
No. parasitized 0 0 0 1 1 14 3 0 10 29
% parasitized 0% 0% 0% 50% 17% 9% 50% 0% 14% 10%
Avg nests
checked * 11.0 30.3 18.5 0.2 2.9 130.8 4.0 11.8 78.0 287.5
Avg parasitized 0.9 0.1 0.2 0.1 0.2 25.3 0.8 1.3 16.3 45.2
AVG
Avg %
parasitized 8.2% 0.3% 1.1% 50.0% 6.9% 19.3% 20.0% 11.0% 20.9% 15.7%
* Nests checked includes only those nests where parasitism could be observed and/or monitored; therefore
not all nests on site are included in this total
The overall parasitism rate in 2018 of 10% continued the 10-year downward trend, as demonstrated in Figure
3.G. Not surprisingly, the number of cowbirds observed in the VCP counts continued to remain below that
observed in the years of the project prior to 2014. As mentioned in earlier reports, possible explanations for
this downward trend include (i) a reduction in the cowbirds’ preferred foraging habitat at TTP due to the
increase in tall herbaceous vegetation, and (ii) an overall decline in cowbird populations in Ontario, with the
exception of the Carolinian region, as noted in the Atlas of the Breeding Birds of Ontario, 2001-2005 (p. 602).
- 21 -40
Brown-headed Cowbird
30
Parasitism Rate
20
10
0
2004 2006 2008 2010 2012 2014 2016 2018 2020
Year
Figure 3.G Brown-headed Cowbird Parasitism Rate Trend
3.4 The Overall Picture in 2018
The most valuable aspect of this project will be its ability to reveal changes in breeding bird abundance and diversity
over time at the VCP station, habitat and total area level. Breeding avifauna will respond to changes in habitat
distribution, composition and structure due to natural succession and habitat creation. At present, the breeding bird
communities (i.e., non-colonial waterbirds and landbirds) are typical of early successional environments. Dominant
species in the past 10 years of VCP counts include Red-winged Blackbird, Yellow Warbler, Song Sparrow and
European Starling, all of which require basic habitat conditions with a few fundamental components to thrive.
With the addition of Cliff Swallow and Northern Mockingbird in 2018, there have been 48 nesters confirmed since
the current project commenced. This total includes the 44 species listed in Table 3.5, plus Brown-headed Cowbird,
Green-winged Teal (confirmed in 2017 by presence of recently-hatched young), Canada Goose and Mute Swan,
with the latter two species not being monitored as part of the project. In addition, the seven colonial waterbirds
described in Section 2 of this report have also been confirmed as nesters: Black-crowned Night-Heron, Caspian
Tern, Common Tern, Double-crested Cormorant, Great Egret, Herring Gull and Ring-billed Gull.
When all species and historical records are included, there are now 73 species confirmed to have bred at Tommy
Thompson Park. Some rare and isolated breeding records are unlikely to recur with any regularity, if at all, (e.g.,
Wilson’s Phalarope). A complete historical breeding bird species list is presented in Appendix C, Species Accounts.
Current habitat conditions remain appropriate for nesting by some additional species, so it is anticipated that the list
of known breeding species may well continue to grow. Natural change, along with the habitat creation and
restoration projects carried out by TRCA throughout TTP, such as the changes to Cell 2 to create a new marsh
similar to Cell 1 (which are now largely complete), are also expected to increase the variety of habitats suitable for
species not yet on the confirmed breeders list.
It is always interesting to note the species detected
during VCP counts, but for which no nest was located,
versus those species not detected during VCP counts,
but for which a nest was found (Table 3.10). A variety
of reasons exist to explain why a species could be
recorded by one method, but not the other: (i) low
abundance at TTP (e.g., Trumpeter Swan), (ii)
secretive habits (e.g., Black-billed Cuckoo), (iii) well-
hidden nests (e.g., Least Flycatcher), (iv) nests or
normal habitat not located near VCP stations, and (v)
nests not located at TTP.
Willow Flycatcher Nest in Sumac (P. Robillard)
- 22 -You can also read