The California Microbial Source Identification Manual: A Tiered Approach to Identifying Fecal Pollution Sources to Beaches
←
→
Page content transcription
If your browser does not render page correctly, please read the page content below
The California Microbial Source Identification Manual:
          A Tiered Approach to Identifying
          Fecal Pollution Sources to Beaches

                      John F. Griffith
                      Blythe A. Layton
                   Alexandria B. Boehm
                    Patricia A. Holden
                      Jennifer A. Jay
                    Charles Hagedorn
                    Charles D. McGee
                   Stephen B. Weisberg

                        Technical Report 804 - December 2013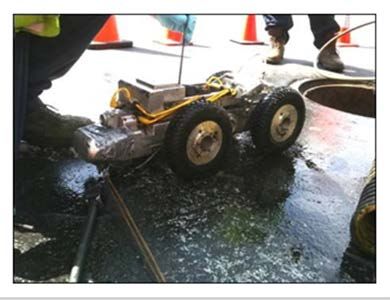
The California Microbial Source Identification
  Manual: A Tiered Approach to Identifying
     Fecal Pollution Sources to Beaches

John F. Griffith1, Blythe A. Layton1, Alexandria B. Boehm2, Patricia
   A. Holden3, Jennifer A. Jay4, Charles Hagedorn5, Charles D.
                  McGee6 and Stephen B. Weisberg1

        1
         Southern California Coastal Water Research Project, Costa Mesa, CA 92626
            2
            Stanford University, Department of Civil and Environmental Engineering,
                                      Stanford, CA 94305
    3
    University of California, Bren School of Environmental Science & Management,
                                Santa Barbara, CA 93106
    4
        University of California, Civil and Environmental Engineering Department, Los
                                        Angeles, CA 90095

5
 Virginia Tech, Department of Crop & Soil Environmental Sciences, Blacksburg, VA
                                     24061
                         6
                          Independent consultant, Orange County, CA

                                    Technical Report 804

                                        December 2013
DISCLOSURE
Funding for this project has been provided in full or in part through an agreement with the State
Water Resources Control Board. The contents of this document do not necessarily reflect the
views and policies of the State Water Resources Control Board, nor does mention of trade names
or commercial products constitute endorsement or recommendation for use.
TABLE OF CONTENTS
List of Acronyms .......................................................................................................................1
Chapter 1: Introduction ............................................................................................................2
   1.1 The Tiered Approach .........................................................................................................3
Chapter 2: (Step 1) Gathering Information to Formulate Hypotheses About Potential Fecal
Sources......................................................................................................................................4
   2.1 Meeting with Stakeholders ................................................................................................4
   2.2 Mapping Topographic, Infrastructure, and Land Use Information ......................................5
   2.3 Conducting Field Reconnaissance to Identify Visible Sources ...........................................6
   2.4 Synthesizing Gathered Information to Generate Hypotheses ..............................................8
Chapter 3: (Step 2) Using Fecal Indicator Bacteria Data to Evaluate Hypotheses and
Prioritize Sources for Further Investigation ..........................................................................10
   3.1 Gathering FIB Data .........................................................................................................10
   3.2 Examining Spatial FIB Patterns .......................................................................................10
   3.3 Examining Temporal FIB Patterns ...................................................................................12
Chapter 4: (Step 3) Traditional Methods for Identifying Leaks in Sanitary Sewer and On-
Site Wastewater Treatment Systems .....................................................................................15
   4.1 Separate Sewage Conveyance Systems ............................................................................15
   4.2 On-Site Water Treatment Systems ...................................................................................20
Chapter 5: (Step 4) Indicators of Human Fecal Pollution .....................................................22
   5.1 Bacterial Markers ............................................................................................................22
   5.2 Human Viral Markers ......................................................................................................23
   5.3 Chemical Source Tracking ...............................................................................................23
Chapter 6: (Step 5) Non-human Source-Associated Markers ..............................................26
   6.1 Selecting Appropriate Markers ........................................................................................26
   6.2 Choosing Appropriate Non-Human Source-Associated Fecal Markers ............................27
Chapter 7: (Step 6) Microbial Community Analysis ..............................................................29
   7.1 Types of Microbial Community Analysis Methods ..........................................................31
   7.2 Current State of Development and Method Recommendations .........................................33
Chapter 8: Study Design.........................................................................................................34
   8.1 Sampling Plan Design .....................................................................................................34
   8.2 Cost Considerations .........................................................................................................35
   8.3 Human Marker Considerations ........................................................................................35
   8.4 Nonhuman Marker Considerations ..................................................................................36
   8.5 MCA Considerations .......................................................................................................36

                                                                      i
Chapter 9: Source Identification Limitations and Anticipated Advancements in the Field
.................................................................................................................................................38
9.1 False Negatives ...............................................................................................................38
9.2 False Positives .................................................................................................................39
9.3 Source Apportionment .....................................................................................................39
9.4 Source Resolution............................................................................................................39
Further Reading ......................................................................................................................41
Traditional Methods ..............................................................................................................41
MST Method Evaluation in California ...................................................................................41
Field Case Studies .................................................................................................................42
Appendix A: Standard Operating Procedures (SOPs) for Recommended MST Marker
Methods ...................................................................................................................................44
iiLIST OF ACRONYMS
CA: California
CBI: Clean Beaches Initiative
CCTV: Closed Circuit Television
CIWQS: California Integrated Water Quality System
DNA: Deoxyribonucleic Acid
ELISA: Enzyme‐linked Immunosorbent Assay
ENT: Enterococcus
EPA: Environmental Protection Agency
FIB: Fecal Indicator Bacteria
GIS: Geographic Information Systems
GPS: Global Positioning System
MCA: Microbial Community Analysis
MST: Microbial Source Tracking
OB: Optical Brighteners
OWTS: Onsite Wastewater Treatment System
PCR: Polymerase Chain Reaction
POTW: Publicly Owned Treatment Works
qPCR: Quantitative Polymerase Chain Reaction
RNA: Ribonucleic Acid
RV: Recreational Vehicle
SIPP: Source Identification Protocol Project
SOP: Standard Operating Procedure
SSMP: Sewer System Management Plan
SSO: Sanitary Sewer Overflow
TMDL: Total Maximum Daily Load
TRFLP: Terminal Restriction Fragment Length Polymorphism
WDR: Waste Discharge Requirements
1CHAPTER 1: INTRODUCTION
California’s beaches represent an important recreational and economic resource. Almost 300,000
jobs relate to coastal tourism and recreation, accounting for 75% of employment in the state’s
ocean economy sector and contributing $12 billion to the state’s gross domestic product. Fecal
pollution at beaches poses both aesthetic and health concerns for visitors. Beach advisories or
closures due to fecal contamination detection may result in local economic losses of up to
$100,000 per day.
Recognizing the value of beaches to California residents and the state’s economy, the California
Clean Beaches Initiative (CBI) Program has provided approximately $100 million since 2001 for
projects to improve beach water quality at many of the state’s most contaminated beaches. These
funds have gone toward implementing best management practices, such as diverting storm drains
to reduce runoff flows during the dry season, repairing aging sewer lines, and creating natural
runoff filtration areas.
Despite the CBI’s successes, a number of beaches still frequently exceed water quality standards
for fecal indicator bacteria (FIB) and lack cleanup strategies, largely because the fecal
contamination sources are unknown. FIB can originate from numerous sources, including human
sewage; manure from livestock operations, wildlife, or urban runoff; and even growth in the
environment. In any given water body, effective management and mitigation requires knowledge
of the source(s) of fecal contamination and of FIB, which are not always the same.
Microbial source tracking (MST) methods can identify FIB host sources, including those that
carry the greatest human health risk. Some new MST methods discriminate between human and
non-human fecal sources, and others distinguish among several animal sources. However, these
methods do not perform equally well. Within the plethora of methods, each has a different set of
advantages. To improve understanding of method performance, the CBI funded a comprehensive
MST method evaluation study in 2011, referred to as the Source Identification Protocol Project
(SIPP). The SIPP quantified specificity and sensitivity for 41 MST methods.
Still, many questions remain: how to employ different marker types and how new genetic source
identification methods might be combined with traditional methods, such as dye testing of pipe
networks. Thus, agencies charged with identifying FIB sources to beaches may hesitate to move
forward with studies or, conversely, deploy too many techniques, which can be prohibitively
expensive.
To address these information gaps, the CBI supported the SIPP in developing this source
identification manual. It provides guidance for cost-effectively identifying sources of fecal
contamination within a watershed. The manual is based on a hypothesis-driven and tiered
approach, in which the user implements the least expensive options first and more expensive
tools only when sufficient uncertainty warrants their use.
21.1 The Tiered Approach
This document describes six tiered steps to implement a hypothesis-driven, science-based
microbial source identification approach, while conserving resources through progressive
deployment:
1) Characterize the watershed by obtaining infrastructure maps, interviewing relevant local
experts, and conducting visual inspections to develop a list of potential fecal
contamination sources.
2) Examine historical and current FIB monitoring data for spatial and temporal trends to
help identify conditions that result in elevated FIB levels and examine linkages to the
greatest potential sources of fecal contamination.
3) Where leakage from a sanitary system is a potential source, investigate it using traditional
tools such as smoke testing, dye testing, or camera inspection.
4) Where human sources are a potential contributor, test ambient waters for human source-
specific genetic markers (even if traditional tools have not identified a leaking sanitary
system). Place high priority on either detecting or confirming a human fecal source, as
this source may pose the greatest relative health risk.
5) Where human sources have been accounted for and the relative human loadings are better
understood, and/or a likely animal fecal pollution source (e.g., runoff from a horse farm)
has been identified, test ambient waters using non-human (animal) source-specific
genetic markers.
6) Where source-specific genetic markers have yet to be developed for the suspected
source(s), consider testing ambient waters using genetic community analysis methods.
Users may also be able to employ these methods to differentiate sources within common
host types (e.g., human fecal pollution from sewage vs. septage). These methods may be
complemented with chemical methods (as appropriate) to provide additional independent
information, particularly when sewage or other human waste is a suspected source.
The chapters in this manual provide procedures or design guidance to implement each of these
steps. In addition, pointers reference other documents where guidance already exists for that
activity, and case studies (shown in boxes) illustrate successful implementation examples.
Finally, the appendices detail standard operating procedures for each of the manual’s
recommended genetic test methods. This manual provides guidance to agencies charged with
identifying FIB sources to beaches. For additional information or questions, please contact Dr.
John Griffith (johng@sccwrp.org).
3CHAPTER 2: (STEP 1) GATHERING INFORMATION TO FORMULATE HYPOTHESES
ABOUT POTENTIAL FECAL SOURCES
Source identification begins with gathering information to develop hypotheses about potential
fecal contamination sources. This step sets the stage for cost-effective, targeted sampling to
either confirm or de-emphasize hypothesized sources using appropriate investigative techniques.
Hypothesis generation involves five main activities:
• Meet with local experts who have knowledge of the watershed to obtain and synthesize
relevant information about possible sources;
• Gather information about the location, age, and condition of local storm and sanitary
sewer infrastructure;
• Gather historical FIB monitoring data along with monitoring location maps;
• Conduct field reconnaissance by walking the beach and watershed to visually identify
possible sources;
• Synthesize information to generate hypotheses.
2.1 Meeting with Stakeholders
Local organizations with institutional knowledge about the watershed, beach, and infrastructure
often hold the best available information about potential bacterial contamination sources. The
first step is to identify these potential collaborative organizations and initiate information transfer
via phone, in-person interviews, and/or stakeholder meetings. In watersheds with on-site
wastewater treatment systems, also seek to engage property owners through community
education/outreach and public meetings. Potential collaborative organizations include (but are
not limited to):
• Municipal agencies responsible for maintenance of stormwater and/or sewage systems,
• Environmental health agencies who are routinely monitoring beach and tributary surface
water quality for FIB,
• Wastewater treatment agencies,
• California State Parks,
• The California Coastal Commission,
• Regional Water Quality Control Board(s),
• Local military installations,
• Local universities and other research institutions that study water quality in the area, and
• Local nongovernmental organizations that conduct citizen monitoring.
In many cases, responsibility for sanitary and stormwater infrastructure upkeep spans multiple
agencies and jurisdictions throughout the watershed associated with the beach. For example,
cities may maintain smaller sanitary and stormwater collection systems, while the county may
monitor beach water quality and manage the main storm drain channels. Likewise, municipalities
4may own and maintain the sanitary collection system within their borders, but contract out
wastewater treatment to a sanitation district. Anyone who has knowledge of the water
infrastructure, including monitoring data, should participate in the information reconnaissance
step.
At the first stakeholder meeting, present historical data and discuss it with participants, focusing
on how they can provide missing information. Request from regulatory agencies (Regional
Water Quality Control Boards) any available information and data associated with Total
Maximum Daily Loads (TMDLs), prohibitions, Sanitary Sewer Overflow (SSO) Reduction
Programs, or other programs that require monitoring and reporting. Ask the municipal agencies
responsible for the sanitary and stormwater infrastructure to provide any data necessary to
complete GIS maps. In addition, much valuable information to inform source investigation
already resides in their Sewer System Management Plans (SSMPs), which are prepared in
accordance with state regulations (see Box 2.1). Look for additional information in documents
related to Illicit Connections/Illicit Discharges (ICID) regulations.
Note: The initial stakeholder meeting represents the first conversation of an ongoing dialogue
between stakeholder group members and the study team. If you later identify additional
stakeholders, include them in future meetings.
Box 2.1: Documents available through regulatory requirements
In California, the State Water Resources Control Board adopted Statewide General Waste
Discharge Requirements (WDRs) for Sanitary Sewer Systems via Water Quality Order No.
2006-0003 on May 2, 2006. The State updated the requirements in 2008 and anticipates
additional updates in 2013. Visit
http://www.waterboards.ca.gov/water_issues/programs/sso/index.shtml to find documentation.
The WDRs apply to public agencies that own or operate sanitary sewer systems greater than
one mile long. They require these agencies to develop and implement sewer system
management plans (SSMPs) and report all sewer system overflows to an online database.
The SSMPs must contain an up-to-date map of the collection system, a condition assessment
and rehabilitation plan to identify and prioritize system deficiencies needing correction, and a
schedule for addressing deficiencies. Other areas relevant to source identification efforts
include operation and maintenance descriptions, performance goals, the overflow emergency
response plan, the fats/oils/grease control program, the capital improvement plan, and the
public communication program. Note any missing, incomplete, or inadequate documents as
well as patterns of sewage spills.
2.2 Mapping Topographic, Infrastructure, and Land Use Information
Leaking sanitation infrastructure represents a high-risk fecal contamination source, and you
should gather information about the location and condition of this infrastructure early in the
investigative process. Include the location of septic tanks/leach fields, pump stations, collection
systems, and publicly owned treatment works (POTWs) or privately operated wastewater
treatment facillities. Identify the waste disposal system for all land parcels near the beach. Note
portions of the system with deferred maintenance and frequently reported SSOs to help identify
areas most susceptible to sanitary sewer failures. Also, check for areas where lines have been
recently replaced or slip-lined to avoid wasting effort in locations where problems were
previously identified and repaired.
5If this resource is available, enter this information into a GIS mapping system, which allows
synthesis of the many different data types related to the study site. With GIS layers, you can
spatially examine relationships between storm and sanitary infrastructure, geographic features,
land use patterns, and population density. GIS data usually already exist for stormwater and
sewer infrastructure managed by public agencies. If the watershed crosses multiple jurisdictions,
integrate individual GIS shape files from each jurisdiction in order to create a comprehensive
map of all infrastructure systems potentially affecting the beach.
Areas with privately owned Onsite Wastewater Treatment Systems (OWTSs) may not have
readily available GIS data; however, some publicly available data may exist in the local county
permitting or planning agency’s real estate records. Inspection records should indicate the
location of both tanks and leach fields. You should build a GIS layer with the approximate
latitude and longitude coordinates obtained from these records if available. Additional
information on the location and condition of OWTSs may be available through documents
related to the AB885 regulations.
Map land use information to identify activities in the watershed that may contribute FIB to the
beach. Layers should include residential areas, crop farming, livestock operations, horse stables,
and dog parks. Depending on the watershed’s data availability, additional valuable layers might
include features such as piers, golf courses, or homeless encampments. If possible, note locations
with landfills, biosolid dispersal, or recycled water irrigation.
Add to the database the spatial locations of FIB monitoring in the watershed, based on local
agency monitoring data (Chapter 3). If possible, categorize data into magnitudes for differential
display on the map. Co-displaying FIB data (especially data gathered over a long period) within
maps of infrastructure and key watershed features can be quite useful in forming hypotheses
regarding fecal sources to creeks, streams, and the beach.
2.3 Conducting Field Reconnaissance to Identify Visible Sources
Thorough watershed reconnaissance usually means walking the area. This typically starts at the
beach and moves up along the main stem of the watershed, branching out into smaller drainages
as needed to identify all potential point and non-point fecal contamination sources.
Sanitary Surveys
You may choose to walk the watershed informally or as part of a formal sanitary survey.
Sanitary surveys standardize collection of both physical and observational data. Physical
parameters include water temperature, wave height, alongshore current direction, wind speed,
and precipitation. Observational data include the number of swimmers, types and numbers of
wild and domestic animals, flows from storm drains or creeks, tidal conditions, and presence of
beach debris. This information may help explain both short-term water quality changes and
correlative relationships between beach conditions and FIB concentrations. Aim to conduct
sanitary surveys several times throughout the year to capture seasonal variations in the above
parameters.
To aid in assessing the beach, the Environmental Protection Agency (EPA) has developed
detailed guidance on how to conduct a sanitary survey, including useful forms and checklists for
6conducting study site reconnaissance. Download the EPA Marine Beach Sanitary Survey User
Manual at http://water.epa.gov/type/oceb/beaches/upload/Marine-Beach-Sanitary-Survey-User-
Manual-March-2013.pdf. Check with local monitoring agencies for available data, as many
agencies gather the data needed to complete sanitary surveys as part via their normal routine
water sample collection procedures.
The EPA manual describes two different types of surveys: A “Routine On-Site Sanitary Survey”
and an “Annual Marine Beach Sanitary Survey.” If local monitoring agencies have adopted the
EPA’s routine survey form, data needed to complete the annual survey form will be directly
transferable. The routine survey involves a simple two-page form intended to record physical and
observational data as each water sample is collected. The annual survey uses a 13-page form
designed to facilitate a comprehensive watershed assessment. It both inventories information to
be collected when characterizing a site and contains a tool to synthesize daily observations and
examine water quality trends as they relate to other parameters.
Infrastructure Sources
Starting from the beach, note the location of all drainages flowing into the main stem of each
storm drain or channel flowing to the beach. Photograph each flowing sub-drain and record its
GPS coordinates to validate against your GIS map. When possible, identify the source of the
flow. Be careful not to overlook any flowing drains, since even a small volume of water with
very high FIB concentrations can contaminate a much larger volume of water. Repeat watershed
reconnaissance several times, as many drains flow intermittently and you may miss a potentially
large source of bacteria if limited to a single exercise. Also, note the location of storm water
diversions (if present) as well as their size and capacity.
While in the field, record the GPS coordinates of each identified onsite wastewater treatment
system (OWTS). You may need to work with the county or other local agencies to obtain access
to private land adjacent to a water body. Note the proximity of leach fields to flowing surface
water. Look for ponding water, signs of sogginess, and vegetation indicating saturation in the
areas where leach fields are expected. Also, look for large trees near tanks and leach fields,
which can disrupt the system with their roots. Notice any water seeping from the sides of the
creek bed near these systems.
Non-Point Sources
During field reconnaissance, keep an eye out for non-point sources where fecal material may
directly enter or wash into the drainage system. Fecal material from individual humans is capable
of spreading disease, so be sure to visually inspect the watershed for evidence of homeless
encampments. Pay particular attention to areas under bridges and brushy areas alongside and in
creek beds.
When an encampment is located, inspect the surrounding area for evidence of cesspits or human
excrement that may affect water quality. The nearest flowing water may be used to carry away
waste from homeless encampments. Inspect areas such as large drain openings, creek banks, and
swales. If homeless persons are living in recreational vehicles or automobiles, check for sewage
discharge or leaking from the RV’s sanitary system or manual emptying of “chamber pots” onto
the street or into nearby storm drains.
7Other notable non-point sources include roaming domestic and wild animals. Flocks of birds
passing through tidal estuaries or deer and raccoons in riparian habitats, for instance, can produce
significant amounts of FIB. Note areas frequented by domestic or stray dogs. Likewise, check for
pet waste in residential areas where drainages border homes. Record any evidence of excrement
found in or near creeks and drains.
In rural or semi-rural agricultural areas, inspect livestock operations and horse stables to
determine how the operator disposes of manure. Manure often ends up in a culvert or creek. Note
where BMPs are preventing direct deposition of livestock feces into water bodies, as microbial
attenuation from fecal aging can significantly lower the potential risk of health impacts
compared to direct deposition. For crop-farming operations, check to see if runoff from fields
reaches the drainage. Also, note portable toilets used by field laborers or others, including the
frequency of pump-outs and the responsible parties.
2.4 Synthesizing Gathered Information to Generate Hypotheses
Information gathered during beach and watershed reconnaissance, meetings with local experts,
evaluating the historical monitoring data for its spatial patterns, and GIS mapping should form
the basis for generating hypotheses as to the likely sources of FIB to the beach. The objective of
this step is to identify a wide array of possible sources to systematically evaluate in later tiers of
the source identification process.
A hypothesis is simply a statement that one can evaluate as true or false. Each statement
proposes an explanation for the observed phenomena, in this case the bacterial water quality
problem at the beach in question. For example, one testable hypothesis states, “The sanitary
sewer system is leaking and raw sewage is being released into the ocean.” An example of a poor
(untestable) hypothesis might be “All of the FIB come from swimmers.” In this statement, it is
not possible to definitively evaluate whether “all” of the FIB come from swimmers. An
improved version of this hypothesis would be “Swimmers are a major contributor to FIB at the
beach.”
In generating hypotheses, consider the possibility of faulty sanitary sewer infrastructure as a high
priority, since this source carries high disease potential, can be easily investigated, and typically
has a straightforward solution. Sanitary sewers near beaches are often aged and may be made of
materials, such as cast iron, that are subject to corrosion when exposed to salt water. In addition,
shifting sands, tree roots, or seismic activity commonly disrupt the gravity portion of these
collection systems. GIS map examination can help to determine if a sanitary sewer is in close
proximity to the beach. Special attention should be paid to pump stations and locations where
sanitary and storm sewer lines run in parallel or cross, as these are the most likely points where
sewage leaking from sanitary lines may enter the storm drain system.
Septic systems also carry high disease potential and can contribute FIB to adjacent surface water
if the system is failing, overloaded or simply located too close to surface waters. Consider the
age and depth of the system when developing hypotheses related to OWTSs. Even a properly
functioning septic system, combined with a high water table, can contaminate the groundwater
that, in turn, exchanges with surface and marine waters near the coast. Many problems that affect
sanitary sewer conveyance systems also affect septic systems, such as corrosion from saltwater
8or disruption by tree roots. Pay special attention to any parcels where the leach field is obviously
failing (indicated by saturated soil, ponding water, etc.). California’s AB885 regulations provide
formal definitions of a failed septic system. 1
Another common source of FIB to beaches are conveyances for stormwater, which in the case of
many streams, creeks, rivers, and storm drains may discharge near the top of the beach and run
over the sand into the water. During dry weather, storm sewers may carry FIB-containing
groundwater and nuisance runoff to the beach. They may also convey contaminated water from
sources such as illicit connections or leaking sanitary sewers farther up the watershed. Further,
tidal flushing of storm drains has been known to introduce FIB from bird droppings and
decaying plant material into beach water.
Geographic features such as piers often relate to FIB contamination and leaking sanitary sewer
infrastructure under piers has been observed in the past. Other human activities that generate FIB
near piers, such as cleaning fish, have been well documented. Further, birds roost on piers and
their droppings may be deposited directly into the water or washed off the pier by maintenance
workers. The continuous shade under piers may contribute to higher levels of FIB in sand due to
the lack of solar inactivation. Also take note of good management practices, such as fish
cleaning stations tied into the sanitary sewer, that may help narrow the list of potential sources to
be investigated.
Finally, land-use patterns can greatly affect bacterial concentrations in water. Each land use has
the potential to contribute different sources of FIB. For example, urban areas may contain
bacteria from leaking trash dumpsters or restaurants that hose food waste into storm drains.
Agricultural operations rely on fertilizer application and may not have adequate restroom
facilities for field workers. Runoff from agricultural land containing fertilizers, which help FIB
to grow in the environment, or human waste deposited in fields and washed into streams by
irrigation water are well-documented sources of FIB.
Sound hypotheses serve as the basis for a study design, and are essential to a successful source
identification effort. Once you have generated a list of reasonable, testable hypotheses, use the
methods described in Chapters 3 through 7 to evaluate them.
1
The full text of the State Water Resources Control Board’s OTWS policy, including definitions of system failure,
can be found at http://www.swrcb.ca.gov/water_issues/programs/owts/docs/owts_policy.pdf.
9CHAPTER 3: (STEP 2) USING FECAL INDICATOR BACTERIA DATA TO EVALUATE
HYPOTHESES AND PRIORITIZE SOURCES FOR FURTHER INVESTIGATION
The second source identification step uses cultivable FIB, such as Escherichia coli and
Enterococcus to test and prioritize hypotheses generated in the first tier. This initial evaluation
tier uses FIB data because they often already exist from routine monitoring. Where FIB data do
not already exist, they cost less to collect compared to other fecal contamination identification
methods; in addition, local agencies or volunteer groups can typically collect FIB data without a
high level of expertise or specialized equipment.
Evaluating source identification hypotheses begins with examining spatial and/or temporal
patterns in FIB data. Temporal patterns examine whether high FIB concentrations on the beach
are associated with phenomena such as tides or precipitation. Spatial patterns elicit whether
certain portions of the watershed see an increase in FIB concentrations, such as confluence with
a tributary or features such as piers or bird colonies. The sections below elaborate on initial
hypothesis testing using FIB data; more expensive confirmatory technology will focus only on
the most likely sources.
3.1 Gathering FIB Data
You may need to collect additional FIB data to evaluate alternative hypotheses. In particular,
examining spatial patterns in the watershed may require samples from a larger geographical area
than those collected in routine monitoring programs. Data to examine long period temporal
patterns at the beach, in contrast, are often available from historic sources. Sources include a)
Heal the Bay (http://brc.healthebay.org) in Southern California and b) the California
Environmental Data Exchange Network (http://www.ceden.us/AdvancedQueryTool), which
compiles monitoring data from all available sources statewide, including local health
departments and monitoring programs required by discharge permits. In some watersheds,
additional useful FIB data from special studies or from citizen monitoring groups may be
available for locations that are not routinely monitored.
Additional monitoring requirements may apply to some beaches and associated watersheds, such
as those associated with FIB-based Total Maximum Daily Loads (TMDLs). Freshwater bacterial
TMDLs sometimes require stormwater agencies to conduct monitoring at multiple locations
throughout the watershed. Find site-specific information on current TMDLs and Regional Board
prohibitions at the “Safe to Swim” website administered by the California Water Monitoring
Council (http://www.mywaterquality.ca.gov/safe_to_swim/index.shtml). Sanitary sewer
overflow (SSO) monitoring data appear in the California Integrated Water Quality System
(CIWQS) database at http://www.waterboards.ca.gov/water_issues/programs/sso.
3.2 Examining Spatial FIB Patterns
Most commonly, evaluating your hypotheses will require examination of spatial FIB patterns.
For instance, does FIB concentration increase after the confluence of each major tributary?
Alternatively, do FIB concentrations change as the characteristics of the watershed change, such
as from agricultural to urban land use? Assess spatial trends in dry and wet season data
separately, or use a monthly average. Geometric means may be superior to averages depending
10on the distribution of data at a particular site. In examining these spatial patterns, consider not
only FIB levels, but also FIB loading from identified fecal sources. Even with a high FIB level in
the upper watershed, the small water volume reaching the beach may not be meaningful when
diluted by the larger volumes in the lower watershed, allowing its elimination as a high-priority
source.
Assess whether contamination is spatially associated with specific features on the beach, such as
piers or storm drains. When examining the spatial relationship of a feature to FIB, take into
account the prevailing current direction when the sample was taken. You can infer current
direction from measured field data or ocean buoy data on wind and swell direction in the vicinity
of the study site.
Finally, pair FIB data with GIS maps of existing infrastructure. Examine GIS maps of sanitary
sewers, storm sewers, and OWTSs overlain with FIB data to look for relationships between
persistent FIB contamination, high levels of FIB contamination, and proximity to infrastructure.
Take into consideration the age and general condition of infrastructure as well as evidence of
infrastructure degradation from SSMPs, such as the frequency of leaks that have required repair,
to gauge the general condition of the system and the likelihood of additional leaks. A spatial
relationship between proximity to sanitary sewer infrastructure or OWTSs and increased FIB in
field data suggests the sanitation system(s) should be investigated as a potential source. When
you suspect faulty infrastructure, bring this to the attention of the stakeholder group. Often
engineers, field workers, and health agencies have institutional knowledge about events such as
sewage spills or emergency repairs to pipes that may not have been memorialized in routine
maintenance records.
Box 3.1. Using spatial patterns to eliminate a potential source
Avalon Beach on Santa Catalina Island, CA shares a harbor with hundreds of moored boats, a
potential fecal pollution source. Researchers carried out a short-term survey to determine if the boats
contribute to the beach’s pollution problems. The study aimed to determine if contamination is
pervasive throughout the harbor (including sites adjacent to boats), or restricted to the shoreline. The
harbor was sampled during both a rising and falling tide, assuming the net flow of water would be into
the bay during the rising tide, and out of the bay during the falling tide. Sampling was conducted at
night because sunlight reduces contamination levels during the day, obscuring spatial patterns that
may be useful for inferring sources. Investigators found that enterococci and E. coli concentrations
were highest at the shoreline and low within the bay, refuting the idea that boats are a major source of
contamination. This information, along with a long-term study of groundwater quality and molecular
source tracking marker data, led the researchers to conclude that groundwater contaminated by leaky
sewage infrastructure was polluting the beach.
For additional information see: Boehm, A.B., Fuhrman, J.A., Mrse, R.D. and Grant, S.B. 2003. Tiered approach
for identification of a human fecal pollution source at a recreational beach: case study at Avalon Bay, Catalina
Island, California. Environmental Science and Technology 37(4), 673-680.
11Box 3.2. Using a mass balance approach to eliminate a potential source
At Cowell Beach in Santa Cruz, CA, water flowing from a storm drain near the stairs at the north end
of the beach was a suspected FIB source. This drain was measured weekly for FIB and flow rate
during the 2011 and 2012 summer seasons. The mean FIB concentrations in the drain were 2400
MPN/100 ml (EC) and 2000 MPN /100 ml (ENT), much higher than the mean concentrations at the
beach of 630 MPN/100 ml (EC) and 230 MPN/100 ml (ENT). The water discharged from the drain at a
very low rate (~40 L/min). Given the distance between the drain and the beach (400 m), and the
dilution likely to take place once the drain water entered the ocean, researchers calculated that this
was not likely a main source of pollution. This conclusion was further supported by salinity data
collected along with each Cowell Beach sample. On average samples contained ~1% freshwater in
surf zone samples, suggesting that the freshwater storm drain source could not be responsible for the
1
FIB at the beach.
For additional information see: Russell, T.L., Sassoubre, L.M., Wang, D., Masuda, S., Chen, H., Soetjipto, C.,
Hassaballah, A. and Boehm, A.B. 2013. A coupled modeling and molecular biology approach to microbial
source tracking at Cowell Beach, Santa Cruz, CA, United States. Environmental Science and Technology
dx.doi.org/10.1021/es402303w.
3.3 Examining Temporal FIB Patterns
In many cases, FIB contamination may be temporally associated with predictable natural
phenomena, such as precipitation, tides, or seasons. First, evaluate whether the FIB problem is
associated with storm or non-storm creek flows or occurs year-round. If there is a lagoon,
information on when the lagoon breaches can be critical for assessing the role of the lagoon;
lifeguards may record data about the berm status. Rainfall and the resulting stormwater discharge
is a well-documented FIB source at California beaches and should be the first temporal variable
examined. Compare the time series of FIB and precipitation to see if peak FIB counts follow
precipitation events. Confirm this relationship with statistics, for example, a 2x2 contingency
table test of presence of rainfall in the last three days versus FIB criteria exceedance (both binary
variables).
Second, examine seasonality. While seasonality could be associated with weather patterns and
rain, it might also be tied to specific human or animal activities in the watershed. For instance, in
watersheds with heavy farming activity, consider whether increases in FIB concentration relate
to periods of high fertilizer use. Similarly, some watersheds experience seasonal use for
fairgrounds or horse racing venues, and temporal FIB patterns can elicit whether these are likely
sources. In addition, bird populations at some beaches fluctuate seasonally due to migration, and
FIB levels may be correlated to the number of birds.
Another seasonal factor to consider is whether or not storm drains or creeks were flowing or dry
on the day the beach was sampled. Many creeks, especially in Southern California, develop a
sand berm that intermittently blocks the flow of water to the beach, sometimes for many months.
In addition, storm drains may be physically diverted to the sanitary sewer system during certain
parts of the year. Statistical tests can help determine whether FIB levels differ among months or
by other seasonal conditions, such as open-berm versus closed-berm periods.
12Third, look for temporal patterns linked to tides. Tidal trends in beach water quality reflect the
importance of both groundwater and beach-based FIB sources. In addition to increased surface
water (rivers and creeks) influence at low tide, submarine groundwater discharge (i.e.,
groundwater discharged from a coastal aquifer to the ocean) is typically greater during low tide.
Higher FIB during low tides may implicate groundwater as a primary source if there are no
nearby rivers, creeks, or lagoons with discharge modulated by the tide. Beach-based sources,
such as contaminated sand or FIB-laden beach wrack, would be more influential during high tide
when most of the beach is inundated with seawater. Thus, higher FIB during high tides may tell
you to look more closely at sand and wrack as important sources. In addition, spring tides bring
higher than normal high tides, and lower than normal low tides that can flush out material from
estuaries and creeks where these sources are present. Performing a correlation analysis with FIB
concentrations and tide height or tide range will reveal whether and how FIB are associated with
tides. Other tests can discern differences between FIB counts under categorical tide conditions
(e.g., rising/falling or spring/neap tides; see Box 3.3).
Fourth, examine correlation with weather conditions, specifically strong winds and high surf.
Higher FIB concentrations under high-energy conditions may indicate remobilization of FIB
reservoirs in beach or nearshore areas. Similar correlative statistics as described above for
rainfall and tide can be used for these and other weather variables.
A fifth pattern to examine is diurnal (time-of-day) trends, which can indicate the possibility of
direct inputs from bathers, whose numbers vary throughout the course of the day. Diurnal
patterns can also provide information on the potential importance of sunlight in controlling FIB
concentrations, indicating whether sunlight should be controlled for during any remaining
sample collection. If so, additional samples should be collected before dawn and then throughout
the course of the day along with measurements of solar radiation.
A sixth factor to consider is near-shore ocean currents. Current velocity and direction can be
modeled at a six kilometer spatial resolution from historical incident wave data measured by the
Coastal Ocean Currents Monitoring Program (COCMP) stations using High-frequency radar
(HFRadar) and archived on internet databases. These models provide high temporal resolution
estimates of current direction at a particular location.
Finally, note when an intermittent contamination pattern does not match any particular temporal
phenomenon. These intermittent sources can be suggestive of illicit dumping or other hard-to-
detect anthropogenic activity. In other cases, understanding the intermittent nature of the
problem provides insight for later investigative phases to ensure source-tracking technology is
deployed at times when the source is present.
13Box 3.3. Example temporal data analysis using FIB
Researchers compiled FIB data from 60 beaches in Orange and Los Angeles Counties, along with
information on the time of day the FIB sample was collected. Using the time of day data, they were
able to use tidal prediction algorithms to determine whether the tide was rising or falling, and whether
it was spring or neap tide during sample collection. The researchers binned the data according to the
tidal condition and explored whether FIB differed significantly under various tide conditions using a
Chi-square test or Fisher’s exact test. They found tidal patterns at 50 of the 60 beaches analyzed. This
led them to conclude that sources of contamination other than terrestrial runoff (including groundwater,
sand, and wrack) may be pervasive at these beaches.
For more information see: Boehm, A.B. and S.B. Weisberg. 2005. Tidal forcing of enterococci at marine
recreational beaches at fortnightly and semidiurnal frequencies. Environmental Science and Technology
39:5575-5593.
14CHAPTER 4: (STEP 3) TRADITIONAL METHODS FOR IDENTIFYING LEAKS IN
SANITARY SEWER AND ON-SITE WASTEWATER TREATMENT SYSTEMS
Verifying integrity of sewage conveyances is a top priority for investigating fecal indicator
bacteria (FIB) sources to a beach because:
1) Human sewage carries a high bacterial and human pathogen load, causing it to have a
high public health risk relative to non-human fecal sources;
2) Coastal infrastructure is typically more aged (since coastal areas are generally the soonest
to be developed) and more subject to corrosion from saltwater contact;
3) Sanitary systems have been found to be responsible for fecal pollution at many beaches;
and
4) Methods for testing sanitary system integrity are proven and typically less costly than the
genetic source identification technologies used in later tiers of this manual.
California has three principal types of sanitary treatment and conveyance systems. In most
developed areas, California has separate, dedicated stormwater and sewage conveyance systems.
However, many communities with separate sewer systems also have on-site water treatment
systems (OWTSs), such as septic systems. OWTSs are more prominent in rural areas. Finally,
combined sewer overflow systems convey both sewage and stormwater together through a
common pipe to a regional water treatment facility. Combined sewer overflow systems are least
common in California and limited to San Francisco and parts of Sacramento. The approaches
used to test for leakage differ among these systems and are described separately below.
4.1 Separate Sewage Conveyance Systems
Several techniques test the integrity of sanitary sewer systems, most prominently dye testing,
smoke testing, and closed circuit television (CCTV) inspections. Dye testing involves placing
dye into a portion of the system and then looking for down-system leakage of that dye into
surrounding surface or groundwater. This is the most versatile method, but often not the one
routinely used by many sewer system operators.2
Smoke testing is more complex to conduct, but has the advantage of testing many potential
sources at once. Whereas dye is placed into individual source locations and then flows down the
system, smoke is forced into the system and can identify up-system defects, making it
particularly valuable when there are multiple lateral lines converging in an area or suspected
illicit connections.
Sewer system operators most commonly use CCTV for preventive maintenance. It involves
putting a camera into the conveyance system and provides a direct visual line of evidence. CCTV
has the advantage of potentially identifying specific defect(s) or cross-connections when
2
For more information on common practices used by sewer operators in California see
http://bacwa.org/Portals/0/Committees/CollectionSystems/Library/SSO%20BMP%20Manual%201%201.pdf.
15combined with dye testing. However, numerous small defects may not be visually apparent and,
for source tracking purposes, CCTV is best used as a confirmatory method when dye testing or
smoke testing has already identified the general origin of the leakage.
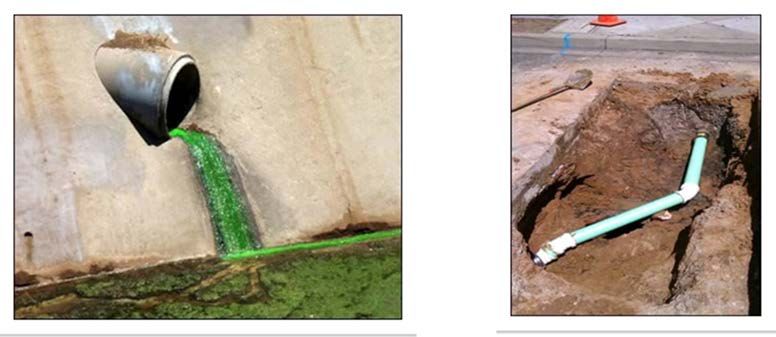
Dye Testing
Dye testing involves introducing fluorescent dye into a sanitary system to verify its integrity or
identify defects. It is also used to test the function of OWTSs and detect connectivity between
these systems and surface waters.
When testing sanitary collection systems, dye is added upstream of the suspected defect through
toilets, sinks or directly into the pipe and then detected either visually or by fluorometry. Visual
detection is standard practice and is often adequate in the case of large leaks or cross-connections
to storm sewers, but dye from small leaks or dye diluted by ground or surface waters is often
undetectable by sight. For this reason, use of rhodamine- or fluorescein-based dyes that are
detectable in very small concentrations using a fluorometer is recommended. 3
In tidally influenced areas, dye testing should be conducted during spring tide conditions, when
tidal height fluctuates the most. During these events, the increased water flux between the land
and ocean creates the best opportunity to detect dye that has escaped from the system. Baseline
water samples to calibrate fluorometric measurements should be collected before dye is
introduced into sanitary systems through toilets or directly into the line in question during low
tide. Visual observations and water sampling for fluorometry should be initiated immediately
following introduction of the dye and continue at set intervals, or continuously using
instrumentation, over at least two full tidal cycles to allow time for dye to travel through the soil
into the areas where measurements are taken.
Box 4.1. Example of dye testing to check integrity of a sanitary collection
system
Doheny State Beach Park in Dana Point, CA had a history of poor bacterial water quality.
Initial hypotheses implicated the large resident shorebird population. However, an
epidemiology study linked illness in swimmers with water contact and human-associated fecal
markers and viruses had been detected in beach water. This evidence suggested the sanitary
sewer infrastructure near the beach might be leaking. To test the integrity of the sanitary
system, rhodamine dye was introduced through toilets in restrooms surrounding the beach
and the ocean and adjacent creeks were monitored for rhodamine every two hours over the
next 30 hours. While the dye was never visually detected, fluorometer readings showed that
the dye flowed to the ocean within hours and was widespread across the beach, indicating
that there were defects in the sanitary collection system. Subsequent CCTV inspection of the
gravity collection lines within the park revealed multiple defects and corrective action was
initiated to restore the integrity of the system. This beach is an example of an obvious FIB
source (shorebirds) masking an infrastructure problem.
For additional information see Layton et al. In preparation
3
Information on how to dye test sanitary collection systems can be found in: Existing Sewer Evaluation and
Rehabilitation: WEF Manual of Practice No. FD-6 ASCE/EWRI Manuals and Reports on Engineering Practice No.
62, Third Edition, WEF Press: Alexandria, Virginia 2009.
16Dye testing is also useful in detecting cross-connections and/or exfiltration of sanitary sewers to
the storm sewer system. In this case, dye is introduced into the sanitary sewer upstream of the
suspected cross-connection or point of exfiltration, as indicated by FIB data. Dye entering the
storm sewer may be detected visually or through the use of a robotic camera system strategically
placed in the storm sewer. In cases where sanitary sewage exfiltration into a storm sewer is
suspected, exercise caution before concluding that no infiltration occurs, as dye diluted by
groundwater may not be visually detectable. If this is the case, you may want to verify the result
using fluorometry or a human-associated fecal marker (see Chapter 5).
Box 4.2. Example of dye testing to check sanitary sewers exfiltrating into nearby storm sewers
In Santa Barbara, CA, urban storm drains flowing into creeks during dry weather were found to carry
high FIB concentrations. Further testing of storm drains in the vicinity of aged sanitary sewers showed
that DNA-based markers of human waste were present. Investigators hypothesized that the aged
sanitary sewers were exfiltrating into soils, and that exfiltration was migrating into nearby storm drains,
i.e., storm drains underneath or parallel to leaking sewers. A follow-up study involved releasing
rhodamine dye into sanitary sewer manholes at several locations that spatially bracketed the affected
storm drains. An optical, real time monitoring probe with an automatic data logger (YSI Instruments)
was deployed into a storm drain manhole at a location both contaminated with FIB and potentially
integrative based on its location and directions of drainage and sewage flows. They deployed the
probe over several days to weeks, while downloading data and inspecting it periodically. Within a one-
to two-week period, they detected exfiltration via a small rhodamine dye peak within the logged probe
data (Sercu et al., ES&T, 2011). This confirmed the bracketed area was problematic for sewage
exfiltration, and it was prioritized for sewer slip-lining and replacement by the City. The City
incorporated this dye testing method into an urban drain microbial source tracking guide published at
http://www.santabarbaraca.gov/civicax/filebank/blobdload.aspx?BlobID=16722.
For more information see: Sercu, B., Van De Werfhorst, L. C., Murray, J. L. S., and Holden, P. A. 2011.
Environmental Science and Technology 45:7151-7157.
You may also use dye to determine which portions of a beach are affected by flow from
particular sources. In this application, introduce dye upstream of the drainage being studied.
Visual observation of dye dispersal gives a good general idea of which beach areas are impacted.
For a more sophisticated analysis, use fluorescence measurements of the initial dye concentration
as well as water samples taken along the beach over time. Then, use this dilution estimate to
calculate the likelihood that FIB from the drainage are responsible for the concentrations
observed at particular locations along the beach. Dye can also be used to infer information about
water movement at the impacted beach to determine residence time and thus provide insight into
FIB fluxes needed to maintain specific FIB concentrations at the beach.
Smoke Testing
Smoke testing involves isolating a small section of the sewer system and then blowing smoke
through that section from a manhole (Figure 4.1). If defects exist in either the main sewer pipes
or the private sewer laterals that serve individual homes and businesses (Figure 4.2), or if there
are unknown or illegal connections between the sewer and storm drain, smoke will rise to the
surface and reveal these problems.
17You can also read