The case for and against onshore wind energy in the UK - Samuela Bassi, Alex Bowen and Sam Fankhauser
←
→
Page content transcription
If your browser does not render page correctly, please read the page content below
The case for and against onshore
wind energy in the UK
Samuela Bassi, Alex Bowen and Sam Fankhauser

Policy brief
June 2012
The Grantham Research Institute on Climate Change and
the Environment was established in 2008 at the London
School of Economics and Political Science. The Institute
brings together international expertise on economics, as
well as finance, geography, the environment, international
development and political economy to establish a world-
leading centre for policy-relevant research, teaching and
training in climate change and the environment. It is
funded by the Grantham Foundation for the Protection of
the Environment, which also funds the Grantham Institute
for Climate Change at Imperial College London. More
information about the Grantham Research Institute can
be found at: http://www.lse.ac.uk/grantham/

The Centre for Climate Change Economics and Policy
(CCCEP) was established in 2008 to advance public
and private action on climate change through rigorous,
innovative research. The Centre is hosted jointly by
the University of Leeds and the London School of
Economics and Political Science. It is funded by the
UK Economic and Social Research Council and
Munich Re. More information about the Centre for
Climate Change Economics and Policy can be found
at: http://www.cccep.ac.uk
Contents

Contents
Summary                                                                                  3
1. Introduction – the issue at stake                                                    5
2. How much might onshore wind contribute to the
    UK’s energy mix?                                                                     7
3. What is the impact of onshore wind intermittency
    on the electricity system?                                                         11
4. What is the cost of onshore wind?                                                  14
5. What are the environmental impacts of onshore wind?                                20
6. Conclusions: how onshore wind compares with other
    energy sources                                                                     24
References                                                                             27
Glossary                                                                               31

                                        The case for and against onshore wind energy in the UK   |1
Acknowledgements and the authors
Acknowledgements
We are grateful to Alice Barrs, Ronan Bolton, Chris Duffy, Gordon Edge, Paul Ekins, Richard
Green, Robert Gross, Malcolm Fergusson and Bob Ward for their comments and feedback.
This policy brief is intended to inform decision-makers in the public, private and third sectors.
It has been reviewed by at least two internal referees before publication. The views expressed
in this brief represent those of the authors and do not necessarily represent those of the host
institutions or funders.
The authors
Samuela Bassi is a Policy Analyst at the Grantham Research Institute on Climate Change and
the Environment at the London School of Economics and Political Science and the Centre for
Climate Change Economics and Policy, where she focuses on green growth and climate
change policy. She graduated in economics from the University of Trieste, Italy, and holds an
MSc in Economics from Birkbeck College, London. Before joining the Grantham Research
Institute, Samuela worked as a Senior Policy Analyst on environmental economics at the
Institute for European Environmental Policy.
Dr Alex Bowen is Principal Research Fellow at the Grantham Research Institute on Climate
Change and the Environment at the London School of Economics and Political Science and
the Centre for Climate Change Economics and Policy. He previously worked at the Bank of
England, most recently as a Senior Policy Adviser. Alex’s research interests were stimulated by
his year on sabbatical contributing to ‘The Economics of Climate Change: The Stern Review’
as Senior Economic Adviser. Alex graduated in economics from Clare College, Cambridge,
and received a PhD from the Massachusetts Institute of Technology, where he studied as a
Kennedy Scholar.
Professor Samuel Fankhauser is Co-Director at the Grantham Research Institute on Climate
Change and the Environment at the London School of Economics and Political Science.
He is also a Director at Vivid Economics and Chief Economist of Globe, the international
legislators organisation. Sam is a member of the Committee on Climate Change, an
independent public body that advises the UK Government on its greenhouse gas targets, and
the Committee’s Adaptation Sub-Committee. Previously, he has worked at the European Bank
for Reconstruction and Development, the World Bank and the Global Environment Facility.
Sam studied economics at the University of Berne, the London School of Economics and
Political Science and University College London.
2| The case for and against onshore wind energy in the UKSummary
Summary
This policy brief aims to inform the debate about the role of onshore wind in the UK’s future
energy mix. The paper investigates to what extent onshore wind can contribute to future
electricity generation, whether there are technological constraints, what the economic costs
are, and what the environmental impacts might be.
The policy brief does not provide new empirical estimates – there are many such numbers
already published. We contribute to the debate by identifying the most credible estimates
available and drawing some robust policy lessons from that information.
The first such lesson concerns the unequivocal need to decarbonise the UK’s electricity sector.
Under the Climate Change Act (2008) and the subsequent carbon budgets, the UK is committed
to cutting its annual greenhouse gas emissions by half by 2025, compared with 1990 levels.
This is not achievable without a power sector that is virtually carbon-free by the middle to late
2020s. The Act has strong political support: it was passed near-unanimously by Parliament,
as were the first four carbon budgets legislated under it.
Once the implications of the UK’s carbon targets are recognised, the issue of onshore wind
becomes a choice between this and other low-carbon energy sources. It is not a choice
between onshore wind and fossil fuels. It has been argued that efficient combined cycle gas
power plants may be a cheaper way of meeting our 2020 carbon reduction targets. However,
it is clear that the further decarbonisation required in the 2020s cannot be achieved by heavily
relying on unabated gas power stations. Rational policy-makers need to anticipate this and
avoid locking in high-carbon electricity generation.
A second robust lesson is that many low-carbon technology combinations are technically
feasible. Much has been made of the intermittent nature of wind and other renewables, which
cannot produce electricity reliably on demand. However, the cost penalty and grid system
challenges of intermittency are often exaggerated. There are several ways of compensating for
this variability, such as additional capacity from fossil fuel power plants to meet balancing
requirements at peak demand, bulk storage of electricity, greater interconnection, and a more
diversified mix of renewable sources, as well as measures to manage demand, like smart grids
and improved load management. The main concerns in choosing the best energy technology
mix are not network stability, but economic costs and environmental side-effects.
The third lesson concerns the trade-off between economic costs (and, by extension, electricity
bills) and environmental impacts. Onshore wind currently supplies 28 per cent of the electricity
generated in the UK by renewables (DECC, 2011a). That share is likely to rise, given the
abundant wind resources available in the UK, and the technological maturity of onshore wind.
A key attraction of onshore wind over other low-carbon forms of electricity generation is cost.
In terms of levelised cost – an economic measure which takes into account all of the costs of
a technology over its lifetime – onshore wind is currently the cheapest renewable technology in
the UK. It is expected that it could become fully competitive with older conventional sources of
energy as early as 2016 (Bloomberg NEF, 2011a). This is an important advantage at a time of
heightened sensitivity about the costs of green policies.
However, onshore wind raises potential local environmental issues, particularly through the
visual impact of turbines. People value natural landscapes and are willing to pay to preserve
them. This needs to be factored into the analysis. There are also wildlife effects that should be
taken into account, although they are often relatively small and site-specific compared with
other anthropogenic impacts.
The case for and against onshore wind energy in the UK |3Summary
These environmental impacts make more expensive renewable technologies – like offshore
wind or solar photovoltaics – potentially more attractive. One can think of the extra cost of
offshore wind as the premium society is willing to pay to avoid the local environmental cost
of onshore wind.
The choice between more affordable electricity (which would favour onshore wind) and local
environmental protection (which may favour other low-carbon technologies) is ultimately a
political one. However, given the economic and environmental trade-offs, technological
uncertainty, and the absence of one clearly superior solution, the best approach seems to be
a portfolio of different energy technologies to balance the cost to consumers and environmental
concerns. Onshore wind has a role in that mix.
The final lesson concerns the role of policy in ensuring a rational approach to onshore wind.
This policy brief does not review the regulatory environment, but it is clear that adequate policies
can make onshore wind less risky and more attractive to investors and local communities
alike. There are a number of regulatory measures that can help to encourage onshore wind
developments where they make sense and prevent them from happening where they do not.
These include:
• A clear price on carbon that underlines the relative merit of wind (and other low-carbon forms
of power production) vis-à-vis hydrocarbon-based fuels.
• A planning system that (i) reduces the costs and uncertainties to project developers, thus
making project development more efficient; (ii) factors in local environmental concerns and
prevents developments in important environmental areas; and (iii) ensures appropriate benefit-
sharing (compensation) in areas where local impacts are acceptable.
• Flanking measures to ensure that the electricity system can cope with intermittent resources,
including adequate and sufficiently smart transmission and distribution systems,
interconnection to other energy markets, energy storage, load management and flexible
demand measures, as well as an appropriate combination of fossil fuel (ultimately linked with
carbon capture and storage) and renewable sources to ensure balancing and the ability to
meet peak demand.
4| The case for and against onshore wind energy in the UK1. Introduction – the issue at stake
1. Introduction – the issue at stake
There is a lively ongoing public debate about the role of onshore wind energy in meeting the
UK’s future electricity needs and environmental targets. Notably, in January 2012, more than
100 Members of Parliament expressed their concerns over onshore wind subsidies in a letter
to the Prime Minister.1 He responded by defending the role of the renewable technology as a
key part of the UK’s future mix of energy sources.2
The background to this debate is the UK’s twin commitment to reduce greenhouse gas
emissions and to increase the proportion of energy generated by renewable sources, such as
wind and solar. The Climate Change Act (Her Majesty’s Government, 2008) commits the UK to
reducing its annual greenhouse gas emissions by at least 80 per cent by 2050 compared with
1990 levels. The initial four carbon budgets set by the Government, and passed by Parliament,
require emissions to be cut3 by 34 per cent by 2020 and by 50 per cent by 2025. At the same
time, the European Union Directive on Renewable Energy (2009/28/EC) requires the UK to
obtain at least 15 per cent of its gross final consumption of energy 4 from renewable sources
by 2020.
In order to achieve these objectives and move towards a low-carbon economy, the UK must
undertake a shift in its energy supply towards much less carbon-intensive sources. Renewable
energy, such as onshore wind, is central to this ambition.
However, there are several forms of low-carbon energy, and it is not trivial to determine the
right combination of renewable sources and other low-carbon technologies. Several
environmental, economic and social considerations need to be carefully taken into account
in order to identify the most desirable energy mix.
… the UK must undertake a shift in its energy
supply towards much less carbon-intensive
sources. Renewable energy, such as onshore
wind, is central to this ambition.
1 See: http://www.telegraph.co.uk/earth/energy/windpower/9061554/Full-letter-from-MPs-to-David-Cameron-
on-wind-power-subsidies.html
2 See: http://www.scribd.com/doc/82548604/David-Cameron-wind-letter
3 Compared to 1990 emission levels.
4 Gross final consumption of energy refers to the total energy consumed by end users, as well as by the energy
sector for electricity and heat production, including losses of electricity and heat in distribution and
transmission.
The case for and against onshore wind energy in the UK |51. Introduction – the issue at stake
The aim of this policy brief is to inform the debate about the role of onshore wind energy in
meeting the UK’s future electricity needs and achieving its environmental objectives. The brief
does not provide new empirical estimates – there are many such numbers already published.
We contribute to the debate by identifying the most credible estimates available and drawing
some key policy lessons from that information. Some robust conclusions can indeed be drawn,
but this does not mean the evidence base is perfect. Data on energy technologies and their
future development are subject to uncertainty and may change over time, so we recommend
that this issue continues to be monitored and investigated in future research.
The brief is structured around four key questions:
• How much might onshore wind contribute to the UK energy mix over the next few decades?
• What is the impact of intermittent wind power generation at a large scale on the stability and
reliability of the UK’s electric power system?
• What is the economic cost of onshore wind and how does it compare with other forms of
low-carbon energy?
• What are the environmental side-effects of onshore wind on the UK’s landscapes and
ecosystems?
We conclude by suggesting how the acceptability of onshore wind may be enhanced through
changes in the policy environment.
6| The case for and against onshore wind energy in the UK2. How much might onshore wind contribute to the UK’s energy mix?
2. How much might onshore wind
contribute to the UK’s energy mix?
Wind turbines, located on land (onshore) or in sea or freshwater (offshore), harness the energy
of moving air, primarily to generate electricity. The UK has excellent opportunities for onshore
turbines, with particularly good wind speeds in Scotland, Northern Ireland and Wales (DECC,
2011a). According to the European Environment Agency, the onshore locations in the UK offer
about 11 per cent of the total generation potential of wind energy in the European Union
(EEA, 2009).
Besides onshore and offshore wind, the UK uses a range of other renewable sources to
generate electricity and heat, and for transport fuels. These include solar heating and
photovoltaics, small-scale and large-scale hydropower, biomass (such as landfill gas, sewage
sludge digestion and wood combustion), geothermal aquifers, heat pumps and transport
biofuels (bioethanol and biodiesel).
Overall, in 2010, renewable sources of energy met about 7.4 per cent of the UK’s electricity
needs and 3.3 per cent of gross final energy consumption5 (DECC, 2011a; see Figure 1).
Under existing European Union commitments, renewable energy generation is meant to grow
to supply about 15 per cent of total gross final energy consumption by 2020 in the UK.
The government’s Renewable Energy Strategy (Her Majesty’s Government, 2009) suggests
that one way to deliver the 2020 target would be to supply around 30 per cent of electricity,
12 per cent of heat and 10 per cent of the energy required by motorised transport from
renewable sources.
Box 1. Note on terminology
Since onshore wind is used primarily for electricity generation, in this report we refer to its
contribution to both electricity and total energy supply. It is important, however, to keep in
mind that renewable electricity is but a subset of the overall energy supply.
Also, we describe energy sources both in terms of their ‘capacity’ and ‘generation’.
The capacity of an (energy) installation is the maximum power; that is, the maximum
quantity of energy delivered per unit of time (IPCC, 2012), and is expressed in watts (W)
and its multiples.6 Generation (or ‘output’) instead refers to the amount of electric energy
produced in a given period, typically an hour, and is expressed in watthours (Wh) and
its multiples.7
67
5 In line with the criteria set out in the EU Renewable Energy Directive (2009/29/EC), which include a cap on
energy consumption from air transport. See also footnote 4 for a definition of ‘gross final energy consumption’.
6 1,000,000,000 Watt (W) = 1,000,000 kilowatt (kW) = 1,000 megawatt (MW) = 1 gigawatt (GW) = 0.001 terawatt
(TW).
7 1,000,000,000 watt-hour = 1,000,000 kilowatt-hour (kWh) = 1,000 megawatt-hour (MWh) = 1 gigawatt-hour
(GWh) = 0.001 terawatt-hour (TWh).
The case for and against onshore wind energy in the UK |72. How much might onshore wind contribute to the UK’s energy mix?
Figure 1. Inland energy consumption by primary fuel input 8, 2010
Net electricity imports
2 TWh
Nuclear electricity
Natural gas 162 TWh
1,084 TWh
Wind and hydro
14 TWh
Other renewable energy
sources and waste
81 TWh
Coal
374 TWh
Petroleum
822 TWh
Source: Calculations based on DECC (2011a).
8
Onshore wind is one of the most technologically mature renewables and, as such, currently
plays a leading role in the generation of renewable electricity in the UK. In 2010, the UK had
more than 4,000 megawatts (MW) of onshore wind capacity (Figure 2), and reached almost
4,800 MW in early 2012 (DECC, 2012a). The most recent generation data shows that onshore
wind supplied 7.1 terawatt hours (TWh) of electricity in 2010, equivalent to about 28 per cent of
the renewable electricity output during the year (DECC, 2011a; Figure 3) and just under 2 per
cent of the total electricity generated in the UK. Assuming an average household electricity
consumption of 3,300 kWh per year (as in Ofgem, 2011), this is equivalent to the electricity
used by about 2 million homes.9
Several assessments have been carried out to estimate the future capacity and generation
potential of onshore wind in the near- (2020) and mid-term future (2030) (e.g. Her Majesty’s
Government, 2010a; CCC, 2010).
For the period to 2020, the most up-to-date analysis has been conducted by the Electricity
Networks Strategy Group (ENSG, 2012), a team of network operators, utilities and other
stakeholders reporting to the Department of Energy and Climate Change and Ofgem. In their
‘Gone Green’ scenario, they estimated that, to meet the 15 per cent renewable energy target,
renewable electricity capacity should reach 35,600 MW, generating about 113 TWh by 2020.
In this scenario, onshore wind should increase from the current 4,800 MW to about 9,000 MW,
which, assuming an average turbine capacity of 2.5 MW, would imply the construction of
approximately 1,700 new turbines. It is estimated that such capacity will generate up to 30 TWh
of electricity annually (ENSG, 2012). This is also consistent with the ‘central’ scenario of the
Renewable Energy Roadmap produced by the Department of Energy and Climate Change,
which expects onshore wind to generate between 24 and 32 TWh each year by 2020
(DECC, 2011c).
8 Inland energy consumption refers to the energy used in the country. It includes primary energy production less
exports, energy imports and changes in stock (positive or negative), and excludes energy used in marine
bunkers (i.e. fuels supplied to ships engaged in international transport).
9 It should be noted that, given its intermittent nature, onshore wind will not be sufficient to power households
without the support of other energy sources. This figure is provided for comparison purposes only.
8| The case for and against onshore wind energy in the UK2. How much might onshore wind contribute to the UK’s energy mix?
Figure 2. Total installed capacity of renewable energy sources in the UK, from 2000
to 2010
10
8
Installed capacity (GW)
6
4
2
0
2000 2001 2002 2003 2004 2005 2006 2007 2008 2009 2010
Onshore wind Solar photovoltaic Hydro
Offshore wind Biomass and waste, Wave/tidal (2.55 MW in 2010)
including co-firing
Source: Based on Her Majesty’s Government (2011a).
Figure 3. Electricity generation from renewable energy sources in the UK, 2010
Biomass
2 TWh
Co-firing of biomass
Onshore wind
with fossil fuels
7.1 TWh
2.5 TWh
Waste combustion
1.6 TWh
Sewage sludge
digestion
0.7 TWh
Offshore wind
3 TWh
Landfill gas
5 TWh Solar photovoltaic
0.03 TWh
Large hydro Small hydro
3 TWh 0.5 TWh
Source: Calculations based on DECC (2011a).
The UK government has also estimated that renewable electricity capacity will be between
35,000 and 50,000 MW by 2030, providing over 40 per cent of electricity output (Her Majesty’s
Government, 2011a).
The case for and against onshore wind energy in the UK |92. How much might onshore wind contribute to the UK’s energy mix?
As for the specific role of onshore wind, the most recent analysis was carried out by Arup (2011)
for the Department of Energy and Climate Change. The study indicates that onshore wind
capacity could range between 15,000 and 25,000 MW, generating 37 to 60 TWh per year by
2030. Assuming an average turbine capacity of 2.5 MW, this would require the construction of
approximately 4,000 to 8,000 new turbines, in addition to the existing stock.
Possible future electricity generation from wind and other renewables is shown in Figure 4 for
the 2020 ‘Gone Green’ scenario published by the Electricity Networks Strategy Group and
Arup’s 2030 ‘High’ scenario.
In practice, as of April 2012, approval has been given for the construction of new wind farms to
provide an additional generation capacity of almost 6,500 MW in the UK, while a further 6,500
MW of onshore wind capacity is awaiting approval (DECC, 2012a). Should all these installations
be developed in the next decade, the future capacity of onshore wind farms could reach almost
18,000 MW by 2020, including the existing 4,800 MW already in operation. Such capacity could
generate more than 42 TWh, which is comparable to the electricity consumed by almost
13 million homes in a year.10 This would be above the 2020 estimates given elsewhere in this
section (ENSG, 2012). It is unlikely, however, that all these installations will be built. Approval
rates were, on average, only 69 per cent between 2004 and 2009 (Her Majesty’s Government,
2010). However, output could be higher in the long term, should new wind farms be proposed
and approved and/or technology efficiency improved. More capacity, in addition to the turbines
already planned, might be needed in the future to meet the carbon reduction targets for 2030
and beyond.
Figure 4. Comparison of current (2010) electricity generation from wind and other
renewables with illustrative scenarios for 2020 and 2030
450
400
350
300
TWh/year
250
200
150
100
50
0
2010 (DECC) 2020 (ENSG) 2030 (Arup)
Onshore wind Offshore wind Other renewables
Source: Based on DECC (2011a), ENSG (2012) and Arup (2011)
10 Assuming a load factor of 28 per cent and an average electricity consumption of 3,300 kWh per household per
year (as in Ofgem, 2011). It should be acknowledged that onshore load factors, which express the average
hourly quantity of electricity generated as a percentage of the average capacity at the beginning and end of a
year, depend crucially on wind farms’ locations and weather conditions. We use here the most recent average
load factor adopted in a report by Arup (2011) for the Department of Energy and Climate Change. It is slightly
conservative compared with the 30 per cent load factor used in the earlier ‘2050 Pathway’ report (Her
Majesty’s Government, 2010). See also footnote 9.
10 | The case for and against onshore wind energy in the UK3. What is the impact of onshore wind intermittency on the electricity system?
3. What is the impact of onshore wind
intermittency on the electricity system?
The demand for electricity varies throughout the day, week and season. As electricity is hard to
store, supply must also vary to meet this demand, which is achieved by turning power stations
on and off, or by operating them below full load. This is a particular challenge for some
renewable technologies such as wind turbines, solar panels, or wave power generators, since
the electricity they supply is variable or ‘intermittent’: it depends, for instance, on when the sun
shines or the wind blows.
Wind electricity output, from both onshore and offshore sources, can vary greatly, not only
across seasons but also during the day. This implies that wind output can be as high at times of
low demand (e.g. overnight) as at times of high demand – see, for example, Figure 5. However,
there is some evidence that, in the UK, wind power is, on average, more available during
daytime and in the winter season, when electricity demand is higher (Sinden, 2007; CCC,
2011a). Also, as wind blows at different speeds in different areas, having wind farms located
in areas that are far apart from each other can reduce the variability of average wind power
output. But even so, the capability of wind to provide an adequate amount of electricity
‘on demand’ on its own remains limited.
Figure 5. Electricity demand and wind generation profile in January 2010
60,000
50,000
40,000
Wind load factor
MW
30,000
1.0
20,000
0.5
10,000
0 0
01 Jan 06 Jan 15 Jan 22 Jan 29 Jan
Demand Wind output
Note: The figure show Great Britain’s demand profile (red line) for January 2010, together with a scaled
January 2010 wind generation profile (blue line) that reflects the estimated wind capacity in January 2021 –
i.e. 26,700 MW of offshore and onshore wind capacity (of which 9,000 MW onshore), in line with the 2020
‘Gone Green’ scenario developed by the Electricity Networks Strategy Group (ENSG, 2009). Overall, it shows
how the estimated future onshore wind generation can contribute to a demand profile similar to our current
(2010) needs.
Source: National Grid (2011).
The case for and against onshore wind energy in the UK | 113. What is the impact of onshore wind intermittency on the electricity system?
The intermittent nature of renewable sources has two main impacts on the electricity system.
First, it affects the system’s ‘balancing’; that is, the relatively rapid short-term adjustments
needed to manage electricity fluctuations over a short time period, (i.e. from minutes to hours).
Second, it affects the system’s ‘reliability’; that is, the need to ensure that sufficient output
is available to meet peak demand.
Several solutions are available to tackle this issue. These include the use of additional fossil
fuel plant capacity to meet balancing requirements and peak demand, the increase of
interconnections and storage, the introduction of smart grids, and the improvement of load
management.
Additional generation capacity, typically from fossil fuel power plants, can operate when there
is a major surge in demand or when wind and other intermittent renewables are not generating
power. This is usually referred to as ‘back-up capacity’11, when it is designed to maintain a
given level of reliability, and ‘balancing reserves’, when used for balancing. As conventional
power stations also face changes in demand, experience failures or are temporarily unavailable
(e.g. due to planned maintenance), arrangements for balancing and reliability are already in
place. The current level of wind power capacity has had little impact on existing arrangements
so far. However, a higher share of intermittent renewable sources is expected to require
additional fossil fuel-fired generation capacity.
According to the UK Energy Research Centre (Gross et al., 2006), should 20 per cent of
electricity be supplied by wind power (or other intermittent renewable energy sources) by 2020,
the additional back-up capacity and system balancing reserves needed would be equivalent
to about 20-32 per cent of the renewable capacity. So for example, assuming an onshore and
offshore wind installed capacity of 26,700 MW by 2020 (as estimated by ENSG, 2012), an
additional 5,300 to 8,500 MW of fossil fuel-fired generation capacity would be required.
Extra capacity from fossil fuel plants is helpful to counterbalance the intermittency of some
renewable sources, but has the disadvantage of generating greenhouse gas emissions. As
these plants are usually kept part-loaded so that they can be switched on and off quickly, they
are less efficient, thus creating more greenhouse gas emissions per unit of electricity (Centre for
Sustainable Energy, 2011), and lead to potentially higher capital costs per unit of electricity.
The need for additional fossil fuel generating capacity can be reduced, however, through other
‘non-generation’ measures, such as interconnection with other electricity markets, energy
storage and load management. Non-generation technologies are indeed fully recognised as a
central element of the UK future energy policy in the Government’s White Paper on electricity
market reform (DECC, 2011d).
Interconnections are physical links between the national grid and other networks, which allow
electricity to be imported and exported (DECC, 2011d). They can offer significant flexibility to
overcome the issue of intermittency. For example, Denmark, which meets 20 per cent of total
electricity demand from wind energy, has strong transmission interconnections with its
neighbouring countries, relying in particular on flexible hydropower sources in the Nordic system
(IPCC, 2011). Great Britain has 3,500 MW interconnection capacity at the moment (DECC,
2011d). National Grid (2011) has forecast that interconnector capacity could reach 5,700 MW
by 2020, while a study for the Committee on Climate Change (Pöyry, 2011) estimated that
interconnections between the UK and Ireland, north-west Europe and Norway could provide
between 10,000 and 16,000 MW of back-up capacity by 2030.
11 Sometimes it is also referred to as ‘stand-by capacity’ or ‘system reserves’ (Gross et al., 2006).
12 | The case for and against onshore wind energy in the UK3. What is the impact of onshore wind intermittency on the electricity system?
The issue of intermittency can also be addressed by increasing energy storage. This involves
converting electricity into another form of energy when supply outstrips demand, and converting
it back when the system requires it (DECC, 2011d). Currently, installed storage capacity is quite
low (under 3,000 MW in Great Britain) and largely consists of pumped storage12 (DECC, 2011d).
Future technology developments are expected to allow for increasing energy storage, for
example through batteries, flywheels and additional pumped storage systems. Pöyry (2011)
suggested that bulk storage could provide between 2,800 and 4,000 MW of capacity by 2030.
Furthermore, the stand-by generators of commercial energy users, such as supermarkets,
which are currently only used in emergencies, could also be made available in order to meet
peak demand, in coordination with energy suppliers. Although there are no official data on the
amount of existing stand-by capacity which is currently available, estimates suggest that the UK
capacity of emergency diesel generation is about 20,000 MW. Of this, about 5,000 MW may be
suitable for remote control by the system operator by 2020 (npower, 2011).
In addition, a diversification of the renewables mix to include less variable sources (such as
biomass) and more predictable sources (such as tidal), as well as improved forecasting and
planning of the use of intermittent sources (such as wind and sun), can contribute to smoothing
of the overall variability of electricity supply.
On the demand side, changes in patterns of electricity use may put additional pressure on
supply systems, as well as helping to reduce the challenges of system balancing and
maintaining system reliability.
On the one hand, the potential electrification of heating, transport and industrial processes
could lead average electricity demand to rise by 30 to 60 per cent by 2050 (Her Majesty’s
Government, 2011a). On the other hand, demand-side measures are expected to help manage
electricity more effectively. For example, an increased use of electric cars could help store
electricity when supply exceeds demand. A ‘smart grid’ (i.e. an electricity network making
extensive use of information and communications technology) is expected to enable more
dynamic real-time flows of information and more interaction between suppliers and consumers
(CCC, 2010). By allowing greater flexibility of demand, it could enable variable supply to be more
easily accommodated. For instance, it could help to manage electric vehicle charging and other
energy use, according to the electricity available in the system. Improved communications and
control systems could also make it possible for an energy supplier to ‘buy’ capacity from
electricity users through ‘load shifts’. This might mean, for example, an energy supplier pays a
supermarket chain to turn all of its refrigerators off briefly (while maintaining a safe temperature
margin) to balance out the grid at times of high demand. National Grid has estimated that up to
around 5,500 MW of load could be time-shifted in this way by 2020 (npower et al., 2011).
It is not easy to estimate the net effect of all of the measures to manage supply and demand
which could ensure the efficient functioning of the electricity system, once a larger amount of
renewable energy is deployed. However, it is clear that several options are available. Besides
holding gas-fired power stations in reserve, which has the disadvantage of leading to additional
emissions when they are used, it is possible to rely also on interconnection, load-shifts, stand-
by generators, smart grids and other measures that can create significant additional flexibility
for the system.
12 A technology which stores energy in the form of water, pumped from a lower elevation reservoir to a higher
elevation when electricity supply outstrips demand. During periods of high electrical demand, the stored water
is released through turbines (CCC, 2012).
The case for and against onshore wind energy in the UK | 134. What is the cost of onshore wind?
4. What is the cost of onshore wind?
A concern sometimes expressed about onshore wind, and other low-carbon energy sources,
is that they are more expensive than fossil fuels for generating electricity, and that the additional
cost burden will raise electricity bills for households and businesses. To make an informed
judgment about the cost of onshore wind, a number of factors need to be considered.
The first factor is the cost of climate change, which is real and needs to be added to the cost
of technologies that emit greenhouse gases, in the form of an appropriate price for carbon
(Bowen, 2011). Second, the comparison needs to take into account the actual and future
prices of energy technologies, including the expected price of fossil fuels and cost reductions
for low-carbon technologies due to learning and economies of scale. Third, onshore wind
should be compared not just with fossil-fuel based power, but also with other sources of
low-carbon energy.
To understand the cost of different energy technologies, a useful first comparison is to consider
their levelised costs. These take into account investment, fuel, and operation and maintenance
costs, and relate them to total energy supply over the assumed economic life of a power plant.
Levelised costs are calculated by dividing the total lifetime cost of a power source by the total
value of electricity generation, both discounted through time13, and are usually expressed in
units of currency per kWh or MWh (e.g. p/kWh or £/MWh).
Several assessments of levelised costs exist. In this policy brief, we rely on the estimates by the
Committee on Climate Change (CCC, 2011b), as these are among the most recent and reliable
data available and those most tailored to the UK. According to these estimates, the levelised
costs for onshore wind ranged between 6.6 and 9.3 pence per kilowatt-hour (p/kWh) in 2011
(see Figure 6).
By comparison, data from Bloomberg New Energy Finance (2011b) put the figure slightly lower,
at around US$60-100 per megawatt-hour in 2010 (i.e. approximately 4-6.5p/kWh14). Estimates
vary because different assumptions can be made about uncertain parameters, such as the
discount rate (i.e. the cost of capital through time), the effect of the exchange rate, commodity
prices (e.g. for steel) and the cost of complying with national legislation. But, despite some
differences due to these assumptions, costs tend to be of the same order of magnitude. Overall,
onshore wind appears likely to be one of the cheapest energy technologies available in 2030.
Figure 6 shows the estimated levelised costs for onshore wind and for other technologies of
relevance for the UK energy mix. The cost range takes into account high and low real discount
rates (respectively 10 and 3.5 per cent) in 2011 and in 2030. According to the Committee on
Climate Change, all ‘clean’ energy sources are estimated to be cheaper in 2030 thanks to
technological improvements. By contrast, while unabated gas15 had the lowest levelised cost
in 2010 (between 3.6 and 7 p/kWh), this is expected to increase in the future given expected
higher fossil fuel and carbon prices. Future gas prices, of course, are uncertain; we rely here
13 Discounting is applied to future cash flows (e.g. future costs and revenues) to identify their net present value.
14 Conversion units: US$100 per MWh = 10 cents per kWh = 6.5 pence per kWh. Average exchange rate in third
quarter of 2010: US$1.00 = £0.646. Source: http://www.oanda.com/currency/average
15 Gas power plants not retrofitted with carbon capture and storage.
14 | The case for and against onshore wind energy in the UK4. What is the cost of onshore wind?
Figure 6. Levelised costs of energy for different sources in 2011 and 2030
(3.5 to 10 per cent discount rate) (p/kWh)
60
50 50.5
Levelised cost (p/kWh)
42.6 42.4
39.5
40
34
30
2011
2030 22.3
21.3 20.4
19.7 22.8 22.5
20 17 16.3
16.5
16.6 13.1 12.4 13.8
12.6
9.3 7.4 7.5
10 7
11 9.4 11
8.9
6.6 6.9 7.6 6.9 6.3 5.5
5.2 5.5
3.8 4.1 5.2 3.6 4
0
Onshore
wind
Offhore
wind
Solar PV
Tidal
Wave
Nuclear
Coal-CCS
Gas-CCS
Unabated
gas with
C price
Unabated
gas without
C price
Note: The first column of each technology refers to 2011, the second to 2030
Source: Calculations based on CCC (2011b).
on estimates by the Department of Energy and Climate Change, which are broadly consistent
with forecasts by the International Energy Agency.16
We have also included, as a hypothetical yardstick, an estimate for the levelised cost of
unabated gas without the embedded carbon price (see the last two columns to the right in
Figure 6). The Committee on Climate Change expects the carbon price to rise from £14 per
tonne in 2010 to £30 per tonne in 2020 and £70 per tonne in 2030. This is estimated to account
for between 7 and 23 per cent of the total cost of unabated gas. Excluding the price of carbon
is wrong analytically, as emissions are a real cost to the economy. But even if carbon costs
were ignored (that is, if gas were to continue to enjoy a ‘carbon subsidy’), the lowest projected
cost of gas in 2030 would be only about 20 per cent cheaper than onshore wind. Furthermore,
although it has been argued that prioritising efficient combined cycle gas power plants rather
than wind energy may be a cheaper way of decarbonising the UK’s energy sector (e.g. Hughes,
2012), this risks higher costs and higher emissions in the long run as high-carbon technologies
are locked in.
It is important to recognise, however, that levelised costs are but one part of the overall picture.
There are other costs incurred in managing an electricity system with increasing levels of
renewable energy generation which also need to be taken into account.
16 Despite the advent of shale gas, the price of gas is expected to rise from 41 p/therm to 77 p/therm in 2030
according to the central scenario developed by the Committee on Climate Change (ranging from 37 p/therm in
the low scenario to 124 p/therm in the high scenario). These were based on assumptions from the Department
of Energy and Climate Change, updated for 2010 prices. By comparison, recent forecasts by the International
Energy Agency (2012) indicate that European gas import prices will range between 10.1 and 12.9 US$ per
million British thermal units (MBtu) in 2030 (in 2009 terms) – i.e. about 65 – 83 p/therm.
The case for and against onshore wind energy in the UK | 154. What is the cost of onshore wind?
In particular, it is necessary to connect the new renewable generation sources, some of which
may be far from the residential and industrial areas where energy is needed (e.g. some onshore
wind turbines and offshore wind), to the grid and to allow for sufficient flexibility to address the
issue of intermittency. Hence investments will be needed in transmission and distribution
networks, interconnections, back-up capacity and balancing reserves, energy storage and
smart grid infrastructure.
Estimating the transmission and distribution costs related to renewables is not a simple task,
because some of the future investments in grid upgrading can be attributed not only to
renewable sources, but also to a range of other causes such as the replacement of old
infrastructure, demographic and demand shifts, and connections from fossil fuel plants and
nuclear power stations (Gross, 2012).
The most recent official assessment of transmission requirements associated with renewables
has been carried out by the Electricity Network Strategy Group. The total investment cost of
transmission consistent with the provision of 30 per cent of electricity from renewable sources
by 2020 (including about 32,000 MW from onshore and offshore wind) was estimated to be
£8.8 billion (ENSG, 2012), or roughly £1 billion as an annual average if costs are spread evenly
each year from now to 2020. As the benefits of the investment will accrue over the lifetime of
the assets, which will be several decades, it makes sense to annuitise it over a longer period.
This has been done by the Committee on Climate Change (2011b), which estimated that
transmission costs will be around 20 per cent of the total annualised costs of accommodating
30 to 64 per cent of electricity from renewable sources by 2030.
Besides transmission, the costs related to the increased intermittency of electricity sources also
need to be taken into account. These include the costs of distribution interconnection, bulk
storage, smart grids and additional conventional generation (to ensure balancing and reliability).
Overall, the Committee on Climate Change estimated that the combined costs of transmission
upgrades and other flexibility measures related to a 30 to 64 per cent share of electricity from
renewables by 2030 would be between £5 and £5.9 billion per year (CCC, 2011b; Pöyry, 2011).
But how much will this affect individual households’ electricity bills? This was recently assessed
by the Committee on Climate Change, in its analysis of the impact of meeting the 15 per cent
renewable energy target by 2020 (CCC, 2011c). Should energy consumption remain the same17,
electricity bills are estimated to rise from £430 in 2010 to £610 in 2020, i.e. by £180 per
household on average. Of this, about £20 would be due to upgrades in transmission,
distribution and metering, £90 would be due to support for renewables and carbon capture and
storage, and £10 would be due to funding for energy efficiency measures. The rest would be
related to increases in wholesale energy prices and VAT, which together would be about £60 –
a third of the estimated increase (Figure 7).
17 i.e. around 3,400 kWh per household, according to the Committee on Climate Change (2011c). This is also
broadly in line with the most recent estimate by Ofgem (2011) used elsewhere in this policy brief, which is
3,300 kWh per household in 2011.
16 | The case for and against onshore wind energy in the UK4. What is the cost of onshore wind?
Figure 7. Projected increase in households’ electricity bill, 2010-2020
700
£68 £7 £10 £610
600
£ per household (2010 values)
£24
£51 £17
500
£430
400
300
200
100
0
2010 Wholesale Transmission Carbon Renewables Energy VAT 2020
energy distribution price and CCS efficiency
and metering
Support for
low-carbon investments
Wholesale energy Carbon price Energy efficiency
Transmission distribution and metering Renewables and CCS VAT
Source: Own calculations based on CCC (2011c)
Future electricity bills, however, could be lower, depending on the effect of energy efficiency
policies on households’ consumption. Whether the full potential of these measures will be fully
realised is still uncertain, but it is estimated that these could lead to a reduction in electricity
consumption of up to 19 per cent by 2020. In such a case, the electricity bill of an average
household is expected to increase by only £65, rather than £180 (CCC, 2011c).
By looking at the impact of renewable energy policies on households’ bills, it is also possible
to estimate the specific contribution of onshore wind to current and future bills.
The impact of renewables is embedded in the cost of the Renewables Obligation, the main
subsidy mechanism for renewable energy (see Box 2). According to the Department of Energy
and Climate Change, the contribution of the Renewables Obligation to an average household’s
electricity bill was about 0.5 p/kWh in 2011, and will rise to 1.1 p/kWh in 2020 (DECC, 2011b).
The case for and against onshore wind energy in the UK | 174. What is the cost of onshore wind?
Box 2. The UK Renewables Obligation
The Renewables Obligation (RO) was introduced in 2002 as a mechanism to incentivise
large-scale (>5 MW) renewable electricity generation in the UK. The RO requires electricity
end-suppliers to purchase a specific fraction of their annual electricity supply from
producers using specific renewable technologies. The end-suppliers receive tradable
Renewables Obligation Certificates (ROCs) for doing so. One ROC per MWh of renewable
output is the default.
Currently, onshore wind installations receive 1 ROC per MWh, offshore wind installations
receive 2 ROCs per MWh, and sewage gas-fired plants receive 0.5 ROC per MWh. The
supplier can also ‘buy out’ the obligation by paying a set price per MWh, currently £38.69.
The buy-out revenue is recycled to participating suppliers in proportion to their ROCs.
Combined with the buy-out payments, the extra revenue from ROC sales effectively
doubles the income for renewables generators. Together with annual increases in the RO
target (12.4 per cent of supply in 2011/12, up from 11.1 in 2010/11), this drives investment
in new renewables capacity. The cost of the RO is ultimately borne by energy users, as it
is recouped by suppliers via higher energy prices.
The UK Government is currently reviewing the amount of support provided to different
technologies through the scheme, and is due to announce the revised bands in summer
2012. The support for onshore wind is expected to be reduced from 1 to 0.9 ROCs per
MWh from 2013.
From 2017 onwards, the RO will be gradually phased out (it will close completely in 2037)
and will be replaced with a Feed-in Tariff with Contracts for Difference. These consist of
long-term contracts between the Government and large-scale (above 5 MW) low-carbon
generators. Feed-in tariffs are a key element of the Government’s ongoing process of
electricity market reform (DECC, 2011d). According to these contracts, when the
generators sell electricity to the market, they either receive or make a payment based on
the difference between the average market price and the tariff agreed in their contract.
Using official estimates of future electricity consumption and generation capacity (DECC, 2011a;
CCC, 2011a), and assuming an average ROC price of £45 per MWh, it is possible to obtain an
indicative value for the contribution of onshore wind to the overall bill. This would be about
0.18p/kWh in 2011 and 0.37p/kWh in 2020. Assuming the average household consumption of
electricity will remain unchanged at 3,400 kWh per year18, this would imply an additional annual
cost of £6 in 2010 and £13 in 2020 (Figure 8).
Although this is only meant to provide an order of magnitude estimate (it does not take into
account future contributions from feed-in tariffs for example), it can be inferred that onshore wind
is but a small component of current and future electricity bills (1 per cent in 2011 and 2 per cent in
2020). If subsidies for onshore wind were reduced or removed (e.g. by reducing RO contributions
for onshore wind to zero), as recently suggested19, the likely impact on household bills would be
negligible. Conversely, electricity bills would go up if electricity generation from onshore wind was
to be replaced by more heavily subsidised renewables.
18 The Department of Energy and Climate Change uses instead a higher estimate of 4,000 kWh. For consistency
we adopt here an assumption used by the Committee on Climate Change (2011c). This is also more consistent
with Ofgem’s estimates – see footnote 17.
19 See for example: http://www.telegraph.co.uk/earth/energy/windpower/9061554/Full-letter-from-MPs-to-David-
Cameron-on-wind-power-subsidies.html
18 | The case for and against onshore wind energy in the UK4. What is the cost of onshore wind?
Figure 8. Estimated impact of onshore wind and other energy and climate change
policies on an average household electricity bill, 2011 and 2020
700
£13
Onshore wind
600
£6
500
£ per household
400
300
200
100
0
-100
2011 2020
RO onshore ETS CERT
RO others Merit order Smart meters
FITs WHD ECO
EMR Better billing Other costs (including VAT)
CPF CESP Wholesale
Key: RO onshore = Renewables Obligation for onshore wind; RO others = Renewables Obligation for other
renewable technologies, including offshore wind, hydro, biomass, landfill gas etc.; FITs = Feed-in Tariffs;
EMR = Electricity Market Reform; WHD = Warm Home Discount; CESP = Community Energy Saving
Programme; CERT = Carbon Emission Reduction Target; ECO = Energy Company Obligation. Other costs
include transmission, distribution and metering, and other supplier costs and margin.
Note: The total annual electricity bill is slightly higher than in Figure 7 (based on CCC, 2011c), because
of different assumptions used in DECC (2011b).
Source: Calculation based on DECC (2011b).
If subsidies for onshore wind were reduced or
removed […] the likely impact on household
bills would be negligible.
The case for and against onshore wind energy in the UK | 195. What are the environmental impacts of onshore wind?
5. What are the environmental impacts
of onshore wind?
An important objection to onshore wind developments has been their local environmental
impact. This is a valid concern. The local environmental costs of energy production are as
relevant to an economic evaluation as its global environmental costs (reflected in the price of
carbon) and investment, maintenance and fuel costs. They need to be taken into account to
understand fully the net impact of harnessing onshore wind power.
All forms of energy production have environmental side-effects. In the case of fossil fuel-based
electricity, the main concerns, besides carbon emissions, are air pollution, water demand for
cooling and the environmental effects of fuel production upstream (e.g. related to fracking for
shale gas, coal mining or oil spills). Nuclear energy’s impacts relate to radioactive waste and the
risk of an accident. Hydro-electricity can have detrimental side-effects on water flows and the
natural environment.
Most of these side-effects are absent from wind power developments. Unlike other generation
sources, wind does not require significant amounts of water, produces little waste and requires
no mining or drilling to obtain fuel (IPCC, 2011). It is true that, from a life-cycle perspective,
wind energy is not entirely a zero-carbon technology, as some greenhouse gas emissions are
generated during the manufacturing, transport, installation, operation and decommissioning
of turbines. These, however, are considered to be very limited. Global estimates by the
Intergovernmental Panel on Climate Change (IPCC, 2011) indicate that these are of the order
of 8 to 20 gCO2/kWh. By comparison, the average emissions from power generation in the UK
were around 540 gCO2/kWh in 2008 (CCC, 2010). In accordance with current accounting
conventions, these emissions are measured and assigned to the activities where they occur
(such as transport or steel production).
It has been argued that the emissions of a system strongly relying on intermittent renewables
can be as high, or higher than those of a system running only on efficient gas turbines (e.g. as in
Hughes, 2012; Lea, 2012). This claim is based on the assumption that wind power intermittency
is managed entirely through back-up from part-loaded fossil fuel power stations which work less
efficiently than gas turbines running alone (see Section 3). However, a study by Dale et al. (2003),
for instance, calculated that if wind power supplied 20 per cent of electricity in 2020, the
reduced efficiency of the gas back-up would only cut the emissions savings by 1 per cent.
Estimates by Pöyry (2011) for the Committee on Climate Change show that, once the
inefficiency of back-up capacity is taken into account, as well as other available measures to
address intermittency 20, a system in which 30 to 64 per cent of electricity is generated by
renewable sources can still emit less than 50g of CO2 per kWh in 2030. This is significantly less
emissions-intensive than the most efficient gas combined-cycle turbines, which produce around
350 gCO2 per kWh.
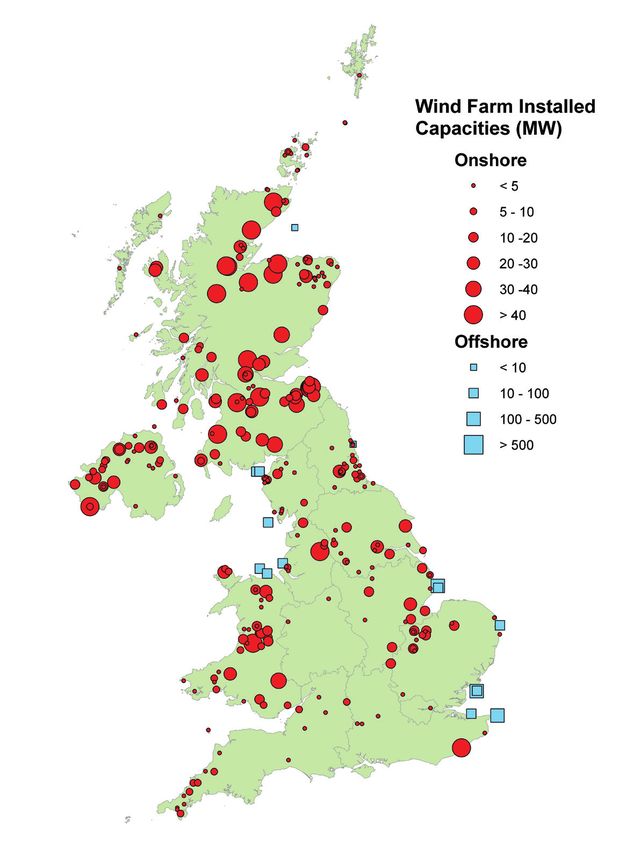
Nevertheless, the construction of wind turbines, their operation, and, importantly, their location,
can have non-negligible impacts on the environment. Depending on their location (Figure 9),
construction and operation, wind energy developments, both onshore and offshore, can affect
landscapes, impact wildlife and lead to habitat and ecosystem modification.
20 Assuming a 15 per cent flexible demand, 10 to 16 GW of interconnection and between 2.8 and 4 GW of bulk
storage (Pöyry, 2011).
20 | The case for and against onshore wind energy in the UK5. What are the environmental impacts of onshore wind?
Figure 9. The location of onshore and offshore wind farms in the UK, December 2010
Source: DECC (2010).
Visual impacts on land- and seascapes are perhaps the most important environmental cost of
wind developments, and can affect large areas. This is not a feature of wind turbines only, as
most large infrastructure projects, such as fossil fuel and nuclear power stations, can also have
significant impacts on the landscape. Power stations, however, are usually more spatially
contained, while onshore wind farms tend to be more spread out, running the risk of affecting a
larger share of the population, especially in rural areas. The problem is also exacerbated by the
fact that the areas with the best wind resources tend to include coastal and upland areas, many
of which are of high aesthetic value.
The Sustainable Development Commission (SDC, 2005) highlighted how the visual impacts of
wind installations are highly dependent on the areas from which the structures are seen (extent
of visibility) and how they appear within these views (nature of visibility). For example, a
development that is grouped into a tightly clustered array is usually visually more acceptable
in open, undeveloped land. But in agricultural landscapes, rows of turbines may be visually
acceptable where formal field boundaries are used as an existing feature. It is generally
considered that fewer and larger turbines have a lower visual impact than a greater number
of smaller turbines (Tucker et al., 2008).
The case for and against onshore wind energy in the UK | 21You can also read