THE COSTS OF SUBURBAN SPRAWL AND URBAN DECAY IN RHODE ISLAND
←
→
Page content transcription
If your browser does not render page correctly, please read the page content below
THE COSTS OF
 SUBURBAN SPRAWL
 AND URBAN DECAY
 IN RHODE ISLAND

P R E PA R E D F O R G R O W S M A R T R H O D E I S L A N D

B Y H . C . P L A N N I N G C O N S U LT A N T S , I N C .

AND PLANIMETRICS, LLP
GROW SMART RHODE ISLAND, BOARD OF DIRECTORS

SISTER THERESE ANTONE, President, Salve Regina University

SUSAN ARNOLD, CEO & General Counsel, Rhode Island Association of Realtors

WILLIAM BALDWIN, President, Baldwin Corporation

JOSEPH CAFFEY, President, Omni Development Corporation

ROBERT L. CAROTHERS, President, University of Rhode Island

ARNOLD CHACE, President, Cornish Associates

TRUDY COXE, CEO, The Preservation Society of Newport County

PETER DAMON, Vice Chairman, Financial Services, Bank of Newport

ALFRED DEGEN, President, Valley Gas Company

JAMES H. DODGE, Chairman, President and CEO, Providence Energy Corporation

LOUISE DURFEE, Managing Partner, Brown, Rudnick, Freed & Gesmer

MARK J. FORMICA, Vice Chairman, Citizens Bank

J. JOSEPH GARRAHY, President, J. Joseph Garrahy and Associates

E. GORDON GEE, President, Brown University

ROBERT GILBANE, President, Gilbane Properties

STEPHEN HAMBLETT, Chairman of the Board, Providence Journal Company

ROBERT HARDING, President, Slatersville River Properties, Inc.

DEAN HOLT, Chairman, CEO and President, Fleet National Bank

DOUGLAS H. JOHNSON, President, Heritage Consultant Group

DENNIS LANGLEY, Executive Director, Urban League of Rhode Island

MARGARET LEINEN, Dean, University of Rhode Island

FREDERICK LIPPITT, Chairman, Providence Plan

FREDERICK C. LOHRUM, South Region Chairman & CEO, BankBoston

ROGER MANDLE, President, Rhode Island School of Design

JAMES MILLER, Executive Minister, Rhode Island Council of Churches

LAWRENCE REILLY, President, Narragansett Electric Company

ANTHONY SANTORO, President, Roger Williams University

GARY SASSE, Executive Director, Rhode Island Public Expenditure Council

RICHARD SCHARTNER, Owner, Schartner Farms

BEVERLY SCOTT, General Manager, Rhode Island Public Transit Authority

DEMING SHERMAN, Partner, Edwards and Angell

MERRILL SHERMAN, President and CEO, Bank Rhode Island

FATHER PHILIP SMITH, President, Providence College

CURT SPALDING, Executive Director, Save The Bay

JOHN WARREN, President and CEO, The Washington Trust Company

SANDRA WHITEHOUSE, Environmental Consultant

FREDERICK C. WILLIAMSON, Chair,
Rhode Island Historical Preservation and Heritage Commission

JAMES WINOKER, President, Belvoir Properties, Inc.

W. EDWARD WOOD, Independent Consultant
THE COSTS OF SUBURBAN SPRAWL
AND URBAN DECAY IN RHODE ISLAND
EXECUTIVE SUMMARY

    PREPARED FOR GROW SMART RHODE ISLAND

    BY H. C. PLANNING CONSULTANTS, INC.

    AND PLANIMETRICS, LLP

    DECEMBER, 1999

    The information in this document has been funded in part by the United States Environmental
    Protection Agency under a Sustainable Development Challenge Grant (Assistance Agreement
    SD991937) to Grow Smart Rhode Island. It may not necessarily reflect the views of the Agency
    and no official endorsement should be inferred.

    Additional funding provided by the Rhode Island Foundation.

                   Printing courtesy of The Providence Journal.
ABOUT THE REPORT
This publication contains the Executive Summary of the current sprawl development trend. All five options
The Costs of Suburban Sprawl and Urban Decay in Rhode assume that there will be no further population decline
Island. The comprehensive, 281-page report was pre- in urban communities over the next twenty years and
pared by H.C. Planning Consultants, Inc. of Orange, that a ‘balanced’ growth pattern is desirable rather than
Connecticut and Planimetrics, LLP of Avon, lopsided growth that only occurs in the suburban and
Connecticut. HCPC’s principal Hyung C. Chung, rural areas. Among the five alternatives, our consult-
Ph.D., AICP, holds a Masters Degree in City Planning ants chose a Compact Core option as the optimal
from Yale University and a Ph.D. in Planning from model of development because it exhibited the greatest
Columbia University. An urban economist and potential to increase the efficient use of resources com-
Professor of Economics and Planning at the University pared to sprawl development.
of Bridgeport for thirty years until his retirement in
In Part II, our consultants measure the costs of sprawl.
1998, he has served as a consultant to the Connecticut
Chapter 7 projects and compares the gross costs of con-
Department of Education, the United Nations Center
tinued sprawl development with those of compact core
for Housing and Planning and numerous towns in
development over the next twenty years (between 2000
Connecticut, Massachusetts and New York.
and 2020). Chapter 8 addresses the issues of diminish-
Planimetrics Principal Bruce Hoben received his
ing farmland, forestland, and other open spaces, and
Masters Degree in Community Planning from the
the disappearance of the state’s ‘rural character’. In
Georgia Institute of Technology. A Past President of the
Chapter 9, calculations are made for the net costs of
Connecticut Chapter, American Planning Association,
sprawl for infrastructure (roads, school, and utilities).
he served as chief planner for the Connecticut towns of
Chapter 10 focuses on the social and fiscal impacts of
Avon and Farmington. Planimetrics Principal Glenn
urban decay, particularly empty buildings, vacant lots,
Chalder, AICP, received his Masters in Community
and low-income households all being concentrated in
Planning from Harvard University, and served as
our core cities. Chapter 11 deals with the fiscal impact
Town Planner in Avon, Connecticut.
of sprawl on suburban and rural communities. Finally,
The full report is organized in two parts. Part I estab- Chapter 12 discusses the environmental impact of the
lishes the conceptual foundation for measuring the rapidly increasing number of motor vehicles and
costs of sprawl in Part II. After a brief introduction in mileage driven under sprawl development.
Chapter 1, Chapter 2 introduces the Circular Model of
Our consultants differentiated two types of costs in
Sprawl, emphasizing the inseparable link between the
analyzing the costs of sprawl: one-time costs and
suburban sprawl and urban decay processes. In the
recurring costs. A capital cost is a one-time cost, but an
same chapter, Rhode Island’s 39 cities and towns are
operating cost such as municipal tax revenues and
classified into four community types—urban core,
expenditures recurs annually. It is usually not the capi-
urban ring, suburban, and rural/emerging suburban.
tal costs but the recurring costs that are much more
In addition, a number of indicators for growth, subur-
expensive in the long run. Accordingly, an innovative
banization and sprawl are defined and used to monitor
formula called the “Equation of Cumulative Impact”
Rhode Island’s growth trends over the last 40 years.
was introduced. This equation has proven to be very
Chapter 3 analyzes the growth trends for population,
convenient in calculating the long-term impact of
housing, employment, and motor vehicles, and
recurring costs or benefits.
Chapter 4 describes land consumption rates between
1960 and 1995 and projects future land consumption The Executive Summary contains table source citations
scenarios through 2020. Chapter 5 conducts case stud- which refer the reader to tables in the full report.
ies for three communities, each representing a major Copies of the full report have been placed in the main
community type—urban ring, suburban, and branches of Rhode Island city and town libraries. To
rural/emerging suburban. Finally, in Chapter 6, five order a copy, contact Grow Smart Rhode Island at
development patterns are introduced as alternatives to (401) 273-5711.
i Grow Smart Rhode Island | About the ReportTHE HIGH PRICE OF URBAN DECAY AND
SUBURBAN SPRAWL IN RHODE ISLAND
The following report looks back 40 years to assess ■ As of 1995, there were nearly 11,000 vacant
the costs of suburban sprawl and urban decay in buildings and lots in our five core cities.
Rhode Island and projects through 2020 the costs of According to our consultants, this represents an
continuing our current development pattern. estimated $1.3 billion in lost property value for
these cities.
■ The report estimates that staying on our sprawl
course over the next 20 years will cost Rhode ■ Between 1980–1997 Rhode Island’s core cities
Island taxpayers almost $1.5 billion, a figure had a net loss of nearly 5,000 private sector jobs
close to our total annual state budget. while the rest of the state registered a net gain
of approximately 48,000 private sector jobs.
■ Tax revenue losses in decaying urban centers
account for more than half the projected sprawl ■ As of 1990 urban core communities had only
costs. Another 15% of the total costs come from 30% of the state’s families but 61% of all RI
tax revenue losses in non-urban areas. The cost of families falling below the poverty line.
building and maintaining extra infrastructure—
local roads, public schools, gas lines, electric util- While sprawl is particularly harmful to cities, it’s not
ity lines, sanitary sewer lines, etc.—to accommo- good for the rest of the state either.
date sprawl accounts for an additional 30% of the
■ Rhode Island developed more residential,
$1.5 billion figure.
commercial, and industrial land in the last 34
■ As large as the estimated costs of sprawl are, years than in its first 325 years. Only 65,000
they probably understate the real costs of acres of residential, commercial, and industrial
sprawl for several reasons. First, methodologi- land was developed between 1636 and 1961, but
cal obstacles precluded quantifying extra envi- 1-1/2 times that amount—96,000 acres—was
ronmental and public health costs that result developed between 1961 and 1995. In this 34
from sprawl vs. more compact core develop- year-period, residential, commercial and indus-
ment. Second, the cost estimates are based on trial land increased at 9 times the rate of popu-
low population growth projections of only 4.4%. lation growth.
If our economy accelerates beyond its tradition-
■ Between 1964 and 1997 Rhode Island’s farm-
ally sluggish rates, these projections will be
land acreage was nearly cut in half, going from
eclipsed and the costs of sprawl will increase
103,801 acres to only 55,256 acres.
accordingly. Third, the report assumes no
increased spending for state roads under a ■ Between 1988 and 1995 Rhode Island lost 11,500
sprawl scenario, a debatable assumption given acres of farm and forest land, an area almost the
the close historic relationship between sprawl size of the whole city of Providence. The report
and additional road building. projects that another 3,100 acres of farmland
and 24,000 acres of forestland will be consumed
In examining recent development patterns, the in the next 20 years under the sprawl develop-
authors found particularly disturbing trends for ment scenario.
cities.
■ In the last 10 years, 1988–1998, total property
values in the core cities (Woonsocket, Central
Falls, Pawtucket, Providence and Newport)
declined by 24%, a decline of more than $3.3
billion. At the same time, their effective tax
rates went up by 44%, three times the rate of
increase in rural communities.
Grow Smart Rhode Island | The High Price iiA CALL FOR ACTION
This report’s compelling findings present in stark along with neighborhood initiatives for affordable
detail the social, economic, and environmental con- housing and community reinvestment and bold new
sequences of Rhode Island’s current inefficient use plans to redevelop the Providence Port area. And in
of land and infrastructure. They document the accel- Newport a major harbor front renewal plan is gath-
erating consumption of open space in our outlying ering momentum as the city continues its growth as
areas and the steady drain of jobs, people and tax an international tourist center.
revenues from our urban centers. The report is not,
however, a call to stop growth. Rather, it is an urgent On the land preservation front, twenty-six Rhode
call for action to institute the policies and practices Island communities now have land trusts, under-
that will enable Rhode Island to promote growth in scoring our commitment to preserving farms, forests
the areas where it can best benefit our citizens. and open space. Regional planning and economic
development initiatives offer additional positive
These changes in policies and practices are critical: signs. On Aquidneck Island and in South County,
If we do not change our current pattern of develop- local officials, community leaders and concerned cit-
ment, then we will limit our ability to grow long izens are working across town boundaries to
term. address common problems through regional cooper-
ation and planning.
We in Rhode Island are fortunate to still have a win-
dow of opportunity. A significant amount of our These efforts cannot be fully successful, however,
land remains undeveloped, and we can work to- unless we address two underlying factors that cur-
gether to ensure that a good portion of that land will rently undermine our ability to shape our future.
stay forever green. At the same time, our urban resi- The first is Rhode Island’s over reliance on local
dential neighborhoods and downtown streets have property taxes to fund education. Our dependence
not yet lost the historic buildings and infrastructure on property taxes puts unfair burdens on our older
which offer such potential for residential and com- cities because they have low property values and
mercial use. numerous tax exempt properties. It also pits commu-
nity against community in the competition to attract
There are already promising efforts under way in new businesses, leads towns to accept business
our cities, suburbs, and rural areas to combat the demands for inappropriate siting of new facilities,
problems of urban decay and sprawl. On the urban and—in perhaps the greatest irony for a state that
front there are widely acclaimed revitalization needs population growth to help fuel economic
efforts in Woonsocket’s Main Street and its growth—means that families with children are no
Fairmount neighborhood. In Central Falls, an excit- longer welcome additions in many Rhode Island
ing multi-use project is slated for the Blackstone communities. The second underlying problem is the
River waterfront. Pawtucket is launching a new absence of a coordinated, integrated and clearly
tourism center and moving forward with a strong articulated statewide approach for planning major
historic preservation initiative. In Providence we land use and conservation initiatives and directing
have a nationally recognized downtown revival economic development to the areas that will best
benefit the state.
iii Grow Smart Rhode Island | Call for ActionThere are a number of broad directions for public ■ Let’s plan for a future in which additional growth
policy indicated by our report’s findings. does not make greater traffic congestion inevitable
and in which all Rhode Islanders are ensured access
■ Let’s commit as a state to actively promote reuse of to jobs and community services. To do so, we need a
the vacant lots and empty buildings in Rhode Island’s more extensive and efficient mass transit system.
urban centers and to turn tax losses into tax revenues.
To do so, we need to beef up our existing incentives We Rhode Islanders are creative, resilient and pub-
and assistance for Brownfields redevelopment and lic-spirited. When we recognized the plight of chil-
streamline building rehab codes to promote more dren without adequate health care, we developed a
reuse of existing homes and buildings. We also need RITE CARE health program that is a national model.
to encourage rehabilitation of the many historic When state and city officials came together to move
homes in our cities and towns through expansion of rivers in downtown Providence, we transformed an
the state historic preservation tax credit. eyesore into a national urban showpiece. In the last
decade, business and labor in Rhode Island have put
■ Let’s ensure that a good portion of Rhode Island’s aside longstanding differences to implement major
prime agricultural lands will continue to be actively reforms in our workers compensation system and
farmed and that Rhode Island will preserve a signifi- successful incentives for targeted economic growth
cant percentage of forests and open spaces to protect in such sectors as financial services and insurance.
our water supply, preserve our state’s scenic beauty,
and provide recreation for our citizens and habitat Now we can use our limited window of opportunity
for wildlife. To do so, we must commit the state, and fashion a new, enlightened approach to growth,
local and private funds necessary to protect open one that strengthens our cities, protects our special
space in perpetuity and to fund specific farmland places and expands economic opportunity. Grow
preservation efforts. We must also ensure that our Smart welcomes the opportunity to respond to this
towns have the planning expertise and resources to challenge, and to work with Rhode Islanders from
conserve open space through creative development all walks of life to ensure that we can shape our
practices. state’s future by choice rather than chance.
■ Let’s ensure that a range of safe and affordable
housing choices accommodating the varied needs of
all Rhode Islanders is available in all communities.
To do so, we need to provide state funding for James H. Dodge
affordable housing and to address the danger posed Chairman of the Board
by lead paint in older properties. Grow Smart Rhode Island
Scott Wolf
Executive Director
Grow Smart Rhode Island
Grow Smart Rhode Island | Call for Action ivAUTHORS’ ACKNOWLEDGEMENTS
The first draft was ready within five months of the study’s initi- help us up through the completion of this study. Finally, we
ation in January of 1999, but it took the remainder of 1999 to would like to acknowledge Professor Howard Foster,
refine the report. The nine members of the Grow Smart Rhode Department of Community Planning, University of Rhode
Island Task Force, who are listed below, spent many hours Island who read our first draft report.
reviewing the report and provided many constructive com-
ments. They also assisted us in obtaining hard-to-get data and The Rhode Island Statewide Planning Program staff was partic-
shared their intimate knowledge of their communities. Three ularly helpful. Kevin Nelson served as a member of the Task
individuals were particularly helpful. Peter Marino, who served Force and provided careful review comments and insightful
as Chairman of the Task Force for this study, is also the Director suggestions. Other staff planners to whom we owe thanks for
of Policy for the Rhode Island Public Expenditure Council, and sharing various planning data and reports include: John
he shared his expertise in public finance and RIPEC’s research O’Brien, Chief of the Statewide Planning Program, Mark G.
resources. Scott Wolf, Executive Director GSRI, has been a de Brown, George W. Johnson, Walter Slocomb, and John
facto editor in chief and assembled, organized and forwarded Stacklehouse.
the review comments from task members and many others who
volunteered to review the draft reports. This made the In addition, many public and nonpublic agencies provided
researchers’ job immensely easier in completing the report. valuable data for our study. Without their assistance, the study
Sheila Brush, GSRI’s Program Director, deserves our apprecia- could not have been conducted in its present form. These agen-
tion. She provided a great deal of guidance in familiarizing us cies are listed below.
with Rhode Island at the inception of the study, continuing to
GROW SMART RHODE ISLAND GROWTH IMPACT STUDY TASK FORCE MEMBERS
PETER MARINO, The Rhode Island Public Expenditure BETH COLLINS, Rhode Island Economic Policy Council
Council DOUGLAS JOHNSON, Heritage Consultant Group
DAN BAUDOUIN, The Providence Foundation KEVIN NELSON, Rhode Island Office of Statewide Planning
JUDY BENEDICT, The Nature Conservancy DAN VARIN, Retired, former head of RI Statewide Planning
SUSAN BODDINGTON, Rhode Island Housing Office
JEANNE BOYLE, City of East Providence
City of Cranston, Department of Planning & Development Rhode Island Economic Development Corporation, Research
(Kevin Flynn) Division (Vincent Harrington, Beth Ashman Collins)
City of Providence, Department of Planning & Development Rhode Island Geographical Information System
(Jon Ozbek) Rhode Island Housing (Jean Burritt Robertson)
Cities and towns of Rhode Island, Finance Departments and Rhode Island Public Expenditure Council (Peter Marino)
Tax Assessors’ Offices
Rhode Island Public Transit Authority (James Eagan)
National Center for Health Statistics Rhode Island State Library
Providence Energy Corporation (James Dodge) Rhode Island State Planning Council
The Providence Plan (Jim Vandermillen) University of Rhode Island, Graduate Curriculum in
Providence Public Library Community Planning and Area Development
Rhode Island Association of Realtors (Susan Arnold) Southern New England Forest Consortium, Inc. (Chris
Rhode Island Builders Association (Roger Warren) Modisette)
R. I. Department of Administration, Office of Municipal Town of South Kingstown, Planning Department (Anthony W.
Affairs and Division of Planning (Phyllis Ferreira) Lachowicz)
Rhode Island Department of Elementary and Secondary Town of Smithfield, Planning Department (Jeanne Tracey-
Education (Dr. Dennis Cheek) McAreavey)
Rhode Island Department of Environmental Management United Way of Southeastern New England
Rhode Island Department of Health, Office of Health Statistics United States Department of Agriculture
Rhode Island Department of Labor & Training, Labor Market Lastly, several staff members of HCPC and Planimetrics who
Information Unit (Mary M. Cooper, Phillip Gay, Maria assisted the researchers with data collection, data entry, map-
Ferreira) ping, word processing, and editing deserve acknowledgment.
Rhode Island Division of Motor Vehicles (Thomas Harrington)
Rhode Island Department of Transportation, GIS
(Robert A. Shawver)
v HCPC, Inc. & Planimetrics, LLP | Authors’ AcknowledgementsINTRODUCTION
This executive summary presents highlights of a by a Circular Model of Sprawl, which is depicted
comprehensive study that was prepared for Grow graphically on page 2. The model consists of two
Smart Rhode Island. Grow Smart Rhode Island is a submodels, a suburban sprawl model (Fig. 1A) and
not-for-profit organization representing a statewide an urban decay model (Fig. 1B).
coalition of public and private-sector individuals
Suburban Sprawl Model: Lured by cheaper outlying
and organizations who share a common concern
land, lower property taxes, ample open spaces, new
about the current pattern of development in Rhode
public facilities and schools and also encouraged by
Island. The coalition’s purpose is to educate Rhode
governmental subsidies for home ownership and
Island’s citizens and leaders about patterns of devel-
highway construction, an increasing number of fam-
opment that can accommodate economic growth
ilies with children have settled in inner and outer
while at the same time conserving natural resources,
suburban areas. The growing number of families
preserving the traditional character of our communi-
moving into these areas has placed increased bur-
ties, and ensuring that all Rhode Islanders have
dens on municipal services, public facilities, infra-
equitable access to affordable housing, jobs and
structure, and schools. The result of such trends is
community services.
higher municipal expenditures and a need for
The purpose of this study was to estimate the poten- increased tax revenues.
tial costs of suburban sprawl and urban decay in the
In the hope of holding down tax rates, suburban and
state. The summary of our findings is presented in
rural towns often seek to expand their tax base by
two parts. Part I analyzes past growth trends in
bringing more industries and businesses into their
Rhode Island and growth projections over the next
towns. However, additional commercial and indus-
two decades (2000–2020). Part II presents the esti-
trial employment attract even more residents. The
mated costs of sprawl.
suburban growth cycle is now complete and ready
to repeat itself. Some residents may find their towns
are getting too “crowded” and are ready to move to
SPRAWL DEFINED more rural areas.
The term “suburban sprawl” refers to a low-density,
Urban Decay Model: Between 1940 and 1990, while
large-lot, and scattered pattern of development that,
the state’s overall population increased by more
in this study, is characterized as “an inefficient
than 40%, Providence’s population declined by more
development pattern.” Sprawl describes land devel-
than a third (-36.6%), from 253,504 in 1940 to 160,728
opment trends and patterns which are wasteful
in 1990, one of the steepest mid century rates of pop-
because they tend to consume an unnecessarily large
ulation loss among American cities. As the suburban
amount of natural resources, require redundant capi-
population grew, businesses and industries began to
tal investments (public facilities and infrastructures),
locate their offices, stores, and plants in the suburbs,
and waste considerable human resources by making
which aggravated the existing urban decay.
people commute unnecessarily long distances.
Sprawl is also wasteful because it causes the under- This depopulation of the cities deprived them of
utilization of sizable investments already made in their ability to rejuvenate themselves by redevelop-
urban areas. ing old properties and facilities through the market.
Thus, urban centers have been left with many aging
The report contends that sprawl is not only wasteful,
and deteriorating properties, facilities and infra-
but that it also limits individual choices and encour-
structures. As a result, some properties have been
ages a segregated society that in turn creates social
abandoned by their owners with city taxes left
and economic chasms between urban and suburban
unpaid. This has produced a decline in these cities’
communities.
property values and tax revenues.
Suburban sprawl, which has been taking place in
Rhode Island for the past 50 years, can be explained
HCPC, Inc. & Planimetrics, LLP | Executive Summary 1Figure 1A, Suburban Sprawl Figure 1B, Urban Decay
More Less Less Lower
Homes Open Homes Property
Space Values
More Higher Higher Greater
Commerce Tax Rates Tax Spending
& Industry Rates Needs
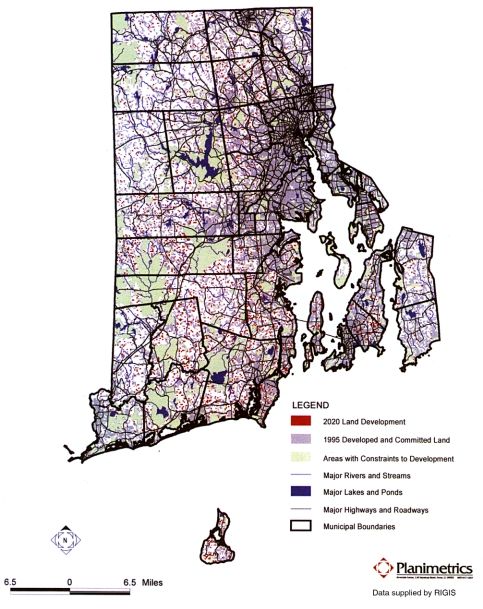
While the urban tax base has declined, the need for CLASSIFICATION OF RHODE ISLAND
public services and investments in many cities has COMMUNITIES
multiplied. Since the non-poor are those most likely
In order to analyze the impacts of suburban sprawl
to leave the cities, urban areas are left with a dispro-
and urban decay in Rhode Island, we have classified
portionate concentration of low income groups. This
the state’s 39 municipalities into four groups: Urban
relatively high concentration of low-income groups
Core, Urban Ring, Suburban, and Rural/Emerging
obliges cities and the state to expand their services
Suburban. For the sake of brevity, we will refer to
to the needy. Because many private properties in
those groups as Core, Ring, Suburban, and Rural.
cities cannot attract private investments for redevel-
Figure 2 on page 3 shows the classifications.
opment, cities are increasingly called upon to make
public investments through city-sponsored urban Urban Core, characterized by high gross population
renewal programs that offer subsidies to entice pri- density and population decline:
vate investments. Central Falls, Newport, Pawtucket, Providence,
Woonsocket (5 communities)
This increased demand for government intervention
comes only after property values and property tax Urban Ring, characterized by medium gross density
revenues have already dwindled. Thus, numerous and very slow or no growth:
cities are forced to increase their taxes. This pattern Cranston, East Providence, North Providence,
is evident in Rhode Island where a recent (1998) Warwick, West Warwick (5 communities)
Rhode Island Public Expenditure Council report
Suburban, characterized by low gross density
shows that the average effective tax or mil rate in the
and slow growth:
state’s 10 urban communities was 30.70 ($30.70 per
Barrington, Bristol, Cumberland, East Greenwich,
$1,000 equalized property valuations) compared to
Jamestown, Johnston, Lincoln, Middletown,
18.15 for the 29 non-urban communities. In other
Narragansett, North Kingstown, Portsmouth,
words, the owner of a $100,000 home must pay an
Smithfield, Warren, Westerly (14 communities)
average property tax of $3,070 in urban areas but
only $1,815 in non-urban areas. Rural/Emerging Suburban, characterized by very
low gross density and rapid growth:
Many remaining city residents who own homes
Burrillville, Charlestown, Coventry, Exeter, Foster,
meanwhile find that they must pay higher taxes and
Glocester, Hopkinton, Little Compton, New
yet live with a decaying urban environment. Thus,
Shoreham, North Smithfield, Richmond, Scituate,
the decaying cities push the non-poor out as much as
South Kingstown, Tiverton, West Greenwich (15
the suburbs pull them in. The full cycle of suburban
communities)
sprawl is complete, and another new cycle begins.
The predicament of urban decay sends more people
to the suburbs, which exacerbates the sprawl process
already occurring there. In this circular process, it
does not matter whether the suburban sprawl or the
urban decay came first: once the process has been set
in motion, it keeps going.
2 The Costs of Suburban Sprawl and Urban Decay in Rhode IslandFigure 2
Classification of Cities and Towns in Rhode Island
HCPC, Inc. & Planimetrics, LLP | Executive Summary 3PART I HOUSING LOCATION TRENDS
Table 2 shows the past and expected future growth
RHODE ISLAND GROWTH TRENDS in the number of housing units by community type.
Rhode Island is the smallest state in the Union, Note that roughly 64,000 new dwellings are project-
encompassing 1,214 square miles and inhabited by ed for Rhode Island between 1980 and 2000, but
approximately a million people as of 1998. The only 30% of these housing units are forecast for
whole state may be considered as a metropolitan urban (core and ring) areas while the remaining 70%
area, most of which can be reached within an hour are projected for non-urban (suburban and rural)
of driving from its capital, the City of Providence areas.
(population, 151,000). Rhode Island’s population The projected change in housing units over the next
density is the second highest in the nation after New two decades is even more skewed away from the
Jersey’s. urban core areas. Rhode Island is forecast to register
Between 1980 and 1997, the total population of a net gain of 25,000 housing units between 2000 and
Rhode Island grew by 4.2% compared with an over- 2020. However, the net gain includes a loss of 9,000
all growth in the United States of 18.2%. During the in the five core cities and a gain of 34,000 units in the
same period, the number of jobs in Rhode Island ring, suburban and rural areas. In other words, non-
also increased slowly. The private nonfarm establish- urban areas are projected to gain housing units in
ment employment in Rhode Island rose by only 13% the next twenty years equivalent to 130% of the
compared to 36% in the United States. However, statewide net gain in housing units.
Rhode Island’s estimated numbers of housing units Table 2
and motor vehicles have grown at much faster rates Projected Growth and Distribution of Housing Units
than its population and employment, rising by 17% by Community Type, Rhode Island, 1980, 2000, and 2020
in the past two decades. The relatively faster growth (in thousands)
Housing Units Units to be Added 20–Year
of housing and motor vehicles underscores the rapid Added 1980–00 2000–2020 Growth Rate
suburbanization in the state. Number % Number % 1980–00 2000–20
Table 1 Core 3,200 5% –9,000 –36% 2.3 –6.5%
Growth of Total Population, Jobs, Housing and Motor Ring 16,300 25% 1,700 7% 16.2 1.4%
Vehicles, Rhode Island, 1980, 1997, 2000, and 2020
Suburban 25,300 40% 15,700 63% 29.0 13.9%
(in thousands)
Rural 19,200 30% 16,600 66% 38.7 24.2%
1980– 1980– 1980–
1980 1997 2000 2020 1997 2000 2020 State 64,000 100% 25,000 100% 17.1 5.7%
Proj. Proj. Proj. Proj. Source: Appendix Table 3.3
(%) (%) (%)
Pop. 947 987 1,012 1,057 4.2% 6.9% 4.4% In sum, of 34,000 new housing units, all but 1,700
Jobs* 328 371 — — 13.1% — — will be built in suburban towns (15,700 units) and
Housing 373 430 437 462 15.3% 17.2% 5.7% rural towns (16,600 units). Clearly, this trend will be
Motor V. 623 710 725 831 14.0% 16.4% 14.6% a threat to the conservation of natural resources in
Source: Tables 3.3, 3.6, 3.8, 3.9 and 3.10. suburban and rural areas and will aggravate exist-
* Covered private establishmentemployment. — = not available.
ing urban decay.
According to the population projections prepared by
the Rhode Island Statewide Planning Program, LAND CONSUMPTION TRENDS
Rhode Island’s total population is expected to grow
over the next twenty years at an even slower rate Although Rhode Island has experienced very slow
than it has in the past two decades. However, in population growth rates over the last forty years,
spite of the continued slow growth in the popula- development in its suburban and rural areas has still
tion, the numbers of housing units and motor vehi- consumed a considerable amount of land.
cles are still expected to continue increasing fairly As shown in Figure 3 on the following page,
rapidly. between 1961 and 1995 land consumption in terms
of average acres per housing unit increased consid-
erably for all areas, but especially in rural and sub-
urban towns.
4 The Costs of Suburban Sprawl and Urban Decay in Rhode IslandFigure 3
Land Consumption Trends in Rhode Island, 1961–1995 PART II
(Acres per Housing Unit)
COST OF SPRAWL DEFINED
The (net) cost of sprawl is calculated to be the differ-
ence between the gross costs of sprawl and the gross
costs of the best alternative to sprawl. In our study,
we hypothesized that compact core development
would be the best alternative to sprawl. Compact
core development is a development scenario in
which projected future growth is redirected among
the four community types (core, ring, suburban, and
rural). It is assumed that there will be no further
population decline in urban areas over the next two
Furthermore, while Rhode Island’s total population decades, while there will be a considerable reduction
increased by only 16% during this thirty-four year in the growth rate of non-urban areas, as shown in
Table 4. Thus, the cost of sprawl is:
period, the state’s land consumption for residential,
commercial and industrial uses increased by 147%, Gross Costs of Sprawl
nine times faster than the population growth rate. – Gross Costs of Compact Core Development
Even more striking is that between 1961 and 1995, Net Costs of Sprawl
Rhode Island developed far more land (96,000 acres)
for residential, commercial and industrial purpose It must be noted that (net) costs of sprawl may be
than in the previous 325 years of the state’s existence alternately called (net) benefits of compact core
(65,000 acres). development.
Table 4
Table 3
Number of Housing Units to Be Added under Sprawl and
Developed Land* by Community Type
Compact Core Scenarios between 2000 and 2020
Rhode Island, 1961, 1995, and 2020
Total Developed Land* Sprawl Trend Compact Core
Land (Acres) 1961-1995 H. U. Percent H. U. Percent
(Acres) Change Urban Core –9,000 –36% 5,000 20%
1995 1961 1995 2020 Amount % Urban Ring 1,700 7% 3,750 15%
Core 28,757 12,108 18,612 18,654 6,504 54% Suburban 15,700 63% 6,250 25%
Ring 59,315 14,358 31,941 33,086 17,583 122% Rural/ES 16,600 66% 10,000 40%
Suburb 176,509 20,996 56,421 67,422 35,425 169% State Total 25,000 100% 25,000 100%
Rural 425,476 17,997 54,951 73,129 36,954 205% Source: Table 6.4
State 690,057 65,459 161,925 192,290 96,466 147%
Source: Tables 4.4, 4.6, and 4.17.
* Includes only residential,commercial, and industrial uses.
LOSS OF FARMS AND FORESTLAND
The land consumption rate was particularly high in
Scattered large-lot residential development con-
non-urban areas: the amount of developed land
sumes a large amount of land including farms and
increased by 205% in rural towns and 169% in sub-
forests. Between 1964 and 1997, the United States
urban towns. Even in urban areas, the total land
Department of Agriculture estimates that Rhode
consumption increased by 122% in ring areas and
Island’s farmland was roughly halved, from 103,801
54% in core cities.
acres in 1964 to 55,256 acres in 1997. More recently,
Figure 4, on page 6, compares the location and during the seven-year period between 1988 and
extent of developed land in 1995 with that projected 1995, Rhode Island lost approximately 11,500 acres
for 2020. of farm and forest lands (1,500 acres of farmland and
another 10,000 acres of forestland). Put another way,
HCPC, Inc. & Planimetrics, LLP | Executive Summary 5Figure 4 2020, Developed Land 6 The Costs of Suburban Sprawl and Urban Decay in Rhode Island
in seven years Rhode Island developed farm and            INFRASTRUCTURE COSTS
forestland that was almost equal to the total land
area of the City of Providence (12,029 acres.) This       Capital costs of infrastructure such as roads, sewer
loss of land has been taking place in spite of the        systems, and schools are more expensive in a sprawl
relatively slow population growth documented in           pattern than in a compact development pattern.
this study. If the actual future population growth
exceeds modest current projections, the land              Local Roads: Rhode Island Department of
resources may be consumed all the sooner.                 Transportation (RIDOT) data shows that as of 1995
                                                          rural towns had on average 16.5 miles of local roads
Future Loss of Farm and Forestland: How much              per 1,000 housing units, or almost three times as
more farm and forestlands Rhode Island will lose in       many as urban core communities (6.1 miles per 1,000
the future will depend on the pattern of develop-         housing units). At this rate, under sprawl develop-
ment the state follows. If the current sprawl trends      ment, over the next two decades 228 miles of local
continue, as much as 3,100 acres of additional farm-      roads could be constructed at the cost of $182 mil-
land and 24,000 acres of forestland will most likely      lion vs. 130 miles at a price of $104 million under the
be consumed by 2020. However, the acreage of farm-        compact core development scenario. In short, if
land consumption under the compact core develop-          Rhode Island develops in a compact development
ment pattern is estimated at 1,600 acres, approxi-        pattern, $78 million or 43% of projected local road
mately one-half of that resulting from the sprawl         construction costs could be saved during the next
development pattern. Thus, the compact core devel-        twenty years.
opment model could preserve as much as 1,500 acres
of farmland. Similarly, 14,000 acres of forestland        State Roads: RIDOT officials believe that there will
would be developed under the compact core sce-            be little need to expand the existing state highway
nario, resulting in a savings of 10,000 acres of these    system in the near future. However, with sprawl,
important natural resources.                              more travel mileage by drivers will necessitate more
                                                          frequent repairs, resurfacing, and rebuilding of the
Economic Value of Farmland: Farming adds to the           existing systems.
rural character of a town, but it is also a business.
This report estimates that an additional 1,500 acres      School Facility Expansion Costs: This study projects
of farmland will be lost under the sprawl develop-        that the K–12 public school students in the state will
ment scenario versus the compact core development         increase by 8,900 students in two decades, or on
model. The economic value of the agricultural prod-       average 445 students per year. As shown in Table 5,
ucts that would be produced on those 1,500 acres is       although the statewide increase is projected to be
estimated at $13.6 million.                               8,900 students, this figure masks the projected gain
                                                          of 11,800 students in non-urban towns (5,200 stu-
Loss of Rural Character: Many suburban and rural          dents in suburban towns and 6,600 students in rural
residents value the rural character of their towns.       towns) because the core cities are projected to lose
For example, West Greenwich’s Comprehensive               3,400 students while ring areas will gain only 500
Town Plan states that its first development goal is to:   students under the sprawl (trend) scenario.
“Promote preservation of the Town’s rural charac-
ter…”. (Town of West Greenwich Comprehensive Plan,        In contrast, under the compact core scenario, the
p. VI-30.) Unfortunately, at the rate that land con-      core cities are also forecast to gain students (1,900
sumption is occurring in suburban and rural towns,        students), while enrollment growth in rural and sub-
many towns are going to lose their rural character.       urban areas will be considerably reduced.
The projected population growth indicates that three
more rural towns will become suburban towns over
the next two decades. This means that in the year
2020, there will be only 12 rural towns left, and at
the current rate of development, all of these 12 rural
towns will become suburban towns over the next 80
years (12 rural towns converted at the rate of 3
towns every two decades). In short, by the year
2100, the entire state of Rhode Island may not have
any rural towns at all.
Table 5 Table 6
Public School Enrollment Growth and Capital Costs of Composite Utility Lines
Projected Costs of School Expansion, Under Trend and Compact Core Development Scenarios
Rhode Island 2000–2020 Rhode Island, 2000–2020
Sprawl Compact Core Sprawl Compact Core Costs of
Enroll- Costs of Enroll- Costs of Net Length Costs Length Costs Sprawl
ment School ment School Costs of Miles $MM Miles $MM $MM
Change Addi- Change Addi- Sprawl Urban Core 0 $0 3 $4 -$4
2000–20 tions 2000–20 tions ($MM)
Urban Ring 5 $7 11 $16 -$9
($MM) ($MM)
Suburban 117 $131 46 $52 $79
Core -3,400 - 1,900 $19 -$19
Rural 187 $168 112 $101 $67
Ring 500 $5 1,100 $12 -$7 State 309 $306 172 $173 $133
Suburban 5,200 $52 2,000 $21 +$31
Source: Table 9.10
Rural 6,600 $66 4,000 $40 +$26
State 8,900 $123 9,000 $92 +$31 As shown in Table 6, the costs of composite utility
100% 74% 26% lines under sprawl development are estimated at
Source: Table 9.9 $306 million vs. $173 million under compact core
development. Thus, the net costs of sprawl or the
The enrollment changes will be reflected in the capi-
benefits of the compact core development option
tal costs of school expansion programs faced by vari-
could be potentially $133 million, or 43% in savings.
ous communities. Under sprawl development, core
cities will be faced with excess school capacities Since utility-line installation costs are generally
while suburban and rural areas will have to add assumed by the utility companies, they will eventu-
more school facilities. On the other hand, under a ally be reflected in a higher utility rate structure for
compact core development model, the enrollment all customers.
growth should be more evenly spread among the
Operating Costs of Infrastructure: Capital costs are
four community groups leading to many fewer
one-time costs over the useful life of facilities; how-
school expansion programs. As shown in Table 5,
ever, operating costs of these facilities are annually
over the next two decades sprawl will cost an esti-
recurring costs whose cumulative sum over the next
mated $123 million as a result of school expansions
twenty years should prove considerable. It is esti-
compared to $92 million under the compact core sce-
mated that Rhode Island could spend as much as
nario. In sum, the statewide savings from adopting
$181 million more in operating infrastructure under
a compact core development plan could be $31 mil-
the sprawl development than the core development
lion. The savings are particularly pronounced in
model over the next twenty years.
suburban and rural communities: suburban towns
could save $31 million and rural areas, $26 million. • Local Roads …. ……………. $14 million
Meanwhile, urban core cities could incur an extra • School Facility Management $19 million
$19 million and urban ring communities could spend • Pupil Transportation……….. $ 6 million
$7 million more for school expansion programs. • Public Sewer System……….. $142 million
Utility Lines Installation Costs: The lengths of Total $181 million
‘composite’ utility lines (sanitary sewers, water sup- Source: Tables 9.13, 9.15, 9.17 and 9.18
ply, storm drainage, natural gas pipeline systems,
and electricity and telephone lines) were estimated
at 308 miles under the sprawl development and 173 SOCIAL COSTS OF DECAYING
miles under the compact core development model. URBAN CENTERS
Thus, sprawl development would require 133 more Poverty in the Core Cities: Decaying urban centers
miles of utility lines (43% more) than the compact are an undesired effect of suburban sprawl. As the
core devlopment model. (These estimates factor in core cities experienced an exodus of mostly middle
the impact of potential in-fill development and the and upper income households, many low-income
percentage of new homes likely to have septic sys- families moved into the core cities. The 1990 U.S.
tems and/or wells.) Census of Population data indicate that whereas the
five core cities had 30% of the state’s total
8 The Costs of Suburban Sprawl and Urban Decay in Rhode Islandnumber of families, they had 61% of the families Social Stratification: The flight of the mostly non-
below the poverty level. (See Figure 5 below.) poor to non-urban areas and the concentration of the
poor in central cities has accentuated an urban-sub-
Figure 5 Distribution of Families Below Poverty Level
urban contrast. Social stratification is clearly exhibit-
ed by geographical separation of society by income
level, ethnicity and race. We list the following statis-
tics that highlight the contrast between suburban
communities and inner cities:
• 82% of all minority students in the state are con-
centrated in the five core cities, with only 10% in
ring, 5% in suburban, and 3% in rural areas.
• Although minority students constituted only 27%
of core cities’ public school enrollment in 1981, by
1997, they represented nearly 60% of all public
Similarly, the core cities had a high concentration of school students in core cities.
populations needing public aid:
Over the next twenty years, the urban-suburban
• 69% of the state’s total Family Independence dichotomy is likely to become more pronounced if
Program (formerly known as AFDC) cases the current sprawl trend continues.
in 1997
• 64% of the state’s total food stamp cases in 1995
• 71% of the state’s total number of students ECONOMIC IMPACTS ON DECAYING
eligible for free/reduced lunch in 1998 URBAN CENTERS
Loss of Jobs from Core Cities: The core cities not While social changes in core cities have necessitated
only lost many people to the suburbs, but they also greater state and municipal expenditures to provide
lost jobs. Between 1980 and 1997, the five core cities community services and assistance to needy fami-
lost 4,600 private covered jobs (-3%) while the non- lies, the tax base (property value) of core cities has
core communities gained nearly 48,000 jobs as diminished because of a deteriorating physical envi-
shown in Figure 7. Jobs are now less accessible to ronment.
low-income families living in core cities. Vacant Buildings and Lots: The continued exodus
Figure 6 of people and businesses from the core cities pro-
Covered Private Job Growth in Urban Core and Non–core duced a large stock of empty (often abandoned)
Areas, Rhode Island, 1980–1997*
buildings and vacant lots. As of 1999, 560 buildings
were vacant in Providence alone. Vacant lots in
Providence covered 934 acres of land in 1998, nearly
8% of the citywide acreage.
As of 1995, there were approximately 10,788 vacant
lots in the five urban core communities, consisting of
8,723 residential vacant lots and 2,065
commercial/industrial vacant lots. These vacant lots
represented an estimated loss of $1.3 billion worth
of assessed valuations in the five core cities.
If the current trends continue, core cities are project-
*Including urban ring, suburban and rural areas. ed to lose an additional 9,000 residential units and
an unknown number of commercial/industrial
establishments by 2020. Thus, under a sprawl pat-
tern, it is certain that more vacant buildings and
empty lots will materialize in core cities, which will
in turn cause a further depreciation of inner city
HCPC, Inc. & Planimetrics, LLP | Executive Summary 9property values. However, if the current trend is Table 7
Changes in Full (Equalized) Property Values
reversed and the core cities gain more households,
Rhode Island, 1988-1998
core cities will not only stop the increase in vacant
lots but will also be able to redevelop many of the Changes in Property Changes in % Change
Values 1988–1998 Population in Effective
vacant lots currently existing, thus converting non- 1988–1998 Tax Rate
tax producing lots into tax-paying properties. It is $Billion Percent Persons Percent Percent
estimated that over the next twenty years compact Core -$3.26 -24% -21,800 -7% +44%
core development will benefit core cities by reclaim- Ring -$1.46 -10% -5,700 -2% +31%
ing $400 million more in taxes, consisting of $183 Suburban +$1.93 +12% +11,100 +4% +19%
million from residential redevelopment and $217 Rural +$2.11 +24% +12,700 +5% +15%
million from commercial/industrial development. State -$0.68 -1% -3,700 -0.4% +24%
(These figures represent the net tax revenue increase Source: Tables 10.17, 10.18 and 10.22
after calculating the costs of providing community
Increasing Tax Rates in Urban Areas: Since the
services to an increased number of households.)
value of the urban tax base has declined, central
Citywide Effects on Core City Property Values: The cities have had to increase tax rates in order to main-
negative impacts on decaying cities are not confined tain tax revenues. Between 1988 and 1998, the effec-
to vacant buildings and lots. These impacts are city- tive tax rates of central cities increased nearly three
wide for two major reasons: (1) a decline in housing times faster than those for the rural towns. Overall
demand and an excess housing supply tend to effective tax rate increases were 44% in core cities,
reduce the property values throughout core cities; 31% in ring communities, 19% in suburban towns,
and (2) vacant buildings and lots scattered through- and 15% in rural towns (see last column of Table 7).
out cities negatively affect the property values of
Core Cities’ Tax Revenue Loss under Sprawl:
entire neighborhoods. (The value of a well-main-
Given that sprawl has been present for some time,
tained building will decrease if the building next to
what impacts do we project for core cities under the
it is a boarded-up building.)
sprawl and compact core scenarios?
As shown in Table 7, the full or equalized property
It is estimated that during the next two decades the
value (in 1998 dollars) of Rhode Island declined by
five core cities will lose 22,200 persons and $3.3 bil-
1% between 1988 and 1998 while the statewide popu-
lion in total property values if the current sprawl
lation declined by 0.4%. However, such statewide
trends prevail. In contrast, core cities could add
data mask the fact that urban core cities lost over $3.3
9,000 persons and increase their property values by
billion worth of property values, a decline of 24% in
$1.3 billion under a compact core development sce-
a decade. Similarly, urban ring communities lost $1.5
nario. In other words, if the compact core scenario is
billion in property value, a decline of 10%. In con-
realized, the core cities’ property values could have
trast, suburban towns’ property values increased by
a net increase of nearly $4.7 billion, which consists
$1.9 billion or 12%, while rural areas experienced a
of not losing more than $3.3 billion combined with a
gain of $2.1 billion in property values or 24%. These
gain of more than $1.3 billion in extra property val-
changes in property values paralleled very closely
ues resulting from the redirected population growth.
population changes in these communities.
The nearly $4.7 billion in extra net property values
It must be noted that the decrease in property valua- can be translated into cumulative tax revenues of
tions in urban areas was due largely to the deprecia- $782 million over the next twenty years, or annual
tion of existing properties, while the increase in tax revenues of $39 million per year at the current
property values in non-urban areas was largely due effective tax rate.
to the addition of new homes. Here is another rea-
son why purchasing a home in urban areas has often
not been a good investment, and why some who
could afford to leave cities have done so.
10 The Costs of Suburban Sprawl and Urban Decay in Rhode IslandFISCAL IMPACT OF SPRAWL ON • The sprawl development model could produce
NON-URBAN AREAS $3.4 million more in tax benefits to the suburban
and rural towns from commercial and industrial
In spite of increased tax bases, why have suburban sources than would be generated by the compact
and rural towns been experiencing tax rate hikes? development model, but not enough to offset the
The answer lies in the circular model of suburban tax revenue shortfalls resulting from increased
sprawl. According to past studies, four Rhode Island residential construction.
towns (Hopkinton, West Greenwich, Little Compton, • Farms, forests and open space in suburban and
and North Kingstown) spend on average $1.17 for rural communities generate net tax surpluses as
every $1.00 collected from residential properties. In long as they are not developed residentially. With
other words, residential development is a net tax compact development, less tax money ($0.48 mil-
burden to towns because expenditures to serve these lion) will be lost from farm, forest, and open
residences exceed the town revenues resulting from space land uses than under sprawl development.
residential development. Therefore, as more
dwellings are built, a higher tax liability develops, Table 8
Municipal Revenue Surplus or Shortfall by Land Use
producing tax rate hikes. (Southern New England
under Sprawl and Compact Core Development
Forest Consortium, Inc., Cost of Community Services Rhode Island, 2020
for selected New England towns; Town of North
Revenue Surplus or Shortfall
Kingstown, Cost of Community Services, Study; and a in the Year 2020 Difference in
study of Little Compton by Houston L. and D. Land Use Trend Compact Tax Surplus
Wichelns) (Sprawl) Core or Shortfall
$Million $ Million $Million
It was also found that commercial/industrial land as Residential -$47.1 -$23.9 -$23.1
well as open spaces provide tax benefits to towns Commercial/
Industrial +$6.7 +$3.3 +$3.4
because towns spend only 43 cents per one-dollar of
Farms, Forests
property tax revenue from commercial/industrial & Open Spaces -$1.1 -$0.6 -$0.5
land uses, and 38 cents per one-dollar of revenue Total -$41.5 -$21.3 -$20.2
from open spaces. As more farms, forestlands and Source: Table 11.6
open spaces are consumed for residential develop-
ment, net tax benefits turn into net tax liabilities. Suburban and rural towns are likely to experience
revenue shortfalls under both the sprawl and com-
In order to minimize the potential tax rate hikes due pact scenarios. However, overall annual revenue
to residential development, many towns are actively deficits are projected to be greater under the sprawl
seeking new commercial and industrial develop- scenario than under compact development. By 2020,
ments. However, the dilemma of sprawl is that the potential annual deficit of $41.5 million under a
more employment opportunities brought by commer- sprawl scenario could be as much as $20.2 million
cial and industrial development attract more house- more than the deficit of $21.3 million under a com-
holds into towns. Thus, the commercial/industrial pact scenario. The cumulative impact over the twen-
development itself can set off another cycle of more ty years could be as much as $212 million, or, on
homes, less open space, tax hikes, and more com- average, $10.6 million per year.
mercial/industrial developments.
Fiscal Impact of Various Land Uses: A comparison
of the fiscal impact of various land uses under the
sprawl and compact core scenarios is summarized in
Table 8. Note that
• Under the compact development scenario, resi-
dential land uses produce $23.1 million less
inmunicipal revenue shortfalls to suburban and
rural communities than sprawl development
does.
HCPC, Inc. & Planimetrics, LLP | Executive Summary 11You can also read