The Cutaneous Inflammatory Response to Thermal Burn Injury in a Murine Model - MDPI
←
→
Page content transcription
If your browser does not render page correctly, please read the page content below
International Journal of
           Molecular Sciences

Article
The Cutaneous Inflammatory Response to Thermal
Burn Injury in a Murine Model
Zabeen Lateef 1 , Gabriella Stuart 1 , Nicola Jones 1 , Andrew Mercer 2 , Stephen Fleming 2
and Lyn Wise 1, *
 1    Department of Pharmacology and Toxicology, School of Biomedical Sciences, University of Otago,
      Dunedin 9054, New Zealand; zabeen.lateef@otago.ac.nz (Z.L.); gabriella.stuart@otago.ac.nz (G.S.);
      nicky.jones@otago.ac.nz (N.J.)
 2    Department of Microbiology and Immunology, School of Biomedical Sciences, University of Otago,
      Dunedin 9054, New Zealand; andy.mercer@otago.ac.nz (A.M.); stephen.fleming@otago.ac.nz (S.F.)
 *    Correspondence: lyn.wise@otago.ac.nz; Tel.: +64-3-479-7723

 Received: 30 December 2018; Accepted: 24 January 2019; Published: 28 January 2019

 Abstract: Many burn interventions aim to target the inflammatory response as a means of enhancing
 healing or limiting hypertrophic scarring. Murine models of human burns have been developed, but
 the inflammatory response to injury in these models has not been well defined. The aim of this study
 was to profile inflammatory cell populations and gene expression relative to healing and scarring in a
 murine model of thermal burns. Cutaneous injuries were created on the dorsal region of C57Bl/6
 mice using a heated metal rod. Animals were euthanized at selected time points over ten weeks, with
 the lesions evaluated using macroscopic measurements, histology, immunofluorescent histochemistry
 and quantitative PCR. The burn method generated a reproducible, partial-thickness injury that
 healed within two weeks through both contraction and re-epithelialization, in a manner similar to
 human burns. The injury caused an immediate increase in pro-inflammatory cytokine and chemokine
 expression, coinciding with an influx of neutrophils, and the disappearance of Langerhans cells and
 mast cells. This preceded an influx of dendritic cells and macrophages, a quarter of which displayed
 an inflammatory (M1) phenotype, with both populations peaking at closure. As with human burns,
 the residual scar increased in size, epidermal and dermal thickness, and mast cell numbers over
 10 weeks, but abnormal collagen I-collagen III ratios, fibre organization and macrophage populations
 resolved 3–4 weeks after closure. Characterisation of the inflammatory response in this promising
 murine burn model will assist future studies of burn complications and aid in the preclinical testing
 of new anti-inflammatory and anti-scarring therapies.

 Keywords: thermal burn; inflammation; neutrophil; macrophage; mast cell; Langerhans cell;
 dendritic cell; collagen; hypertrophic scar; mice

1. Introduction
      Burns are traumatic injuries that can occur in the home or workplace. There are an estimated
180,000 deaths every year caused by burns, the vast majority in low-middle income countries [1].
With 11 million people requiring medical attention for burns world-wide, in 2004, non-fatal burn
injuries represent a leading cause of morbidity. While early burn excision and skin grafting has
significantly improved outcomes for these patients, slow healing, infections and scarring still provide
major challenges to burn care [2]. As such, burn survivors often have prolonged hospitalization,
life-long physical impediments, emotional distress and impaired quality of life.

Int. J. Mol. Sci. 2019, 20, 538; doi:10.3390/ijms20030538                          www.mdpi.com/journal/ijms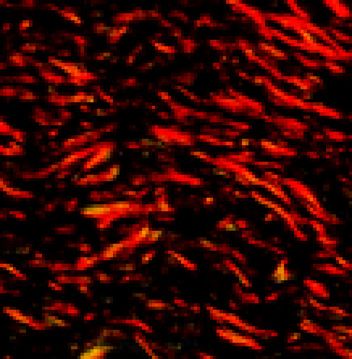
Int. J. Mol. Sci. 2019, 20, 538                                                                       2 of 17

      Thermal and scald burns account for the majority of reported skin burns, with injuries classified
as superficial, partial-thickness, full-thickness or subdermal depending on the depth of damage [3].
Superficial burns affect only the epidermis, exhibiting erythema and pain. Partial-thickness burns
are classified as superficial or deep, extending to the papillary and reticular dermis, respectively, and
can present with blisters, erythema, oedema and diminished sensation. Full-thickness and subdermal
burns extend below the skin, and can damage subcutaneous adipose, fascia, muscle or bone. The depth
of the burn greatly influences healing outcomes. Superficial burns resolve without scarring within 3 to
5 days. Full-thickness and subdermal burns, however, are slow to heal, require surgical intervention,
lead to hypertrophic scarring, and increase the risk of infection, shock and death. Partial-thickness
burns are the most common, accounting for 86% of all burns in the recent Bradford Burn Study [4].
While partial-thickness burns are usually non-fatal, those originally deemed to be superficial can
progress into deep or full-thickness burns [3]. The wound depth, or area of necrotic tissue, is thought
to progress, in part, due to damage to the dermal microvasculature and the resulting tissue hypoxia.
Burn wound extension is clinically important as it can confound diagnosis, treatment selection and
ultimately patient outcomes.
      Each burn type instigates a wound healing response consisting of three over-lapping phases:
inflammation, proliferation, and remodelling [5,6]. The response starts with release of histamine,
free radicals and inflammatory cytokines, which increase vasodilation and tissue oedema. This
brings neutrophils and monocytes to the site, which in turn provide chemotactic signals that recruit
macrophages. The inflammatory cells then phagocytose necrotic tissue, protect against pathogens,
and produce growth factors that initiate migratory and proliferative responses. Keratinocytes then
re-epithelialize the wound, and the vascularized granulation tissue is restored by endothelial cells and
fibroblasts. In parallel, fibroblasts differentiate into myofibroblasts, contributing to burn contraction
and to deposition and realignment of collagen fibres, in a manner that determines scar pliability.
      As burn-associated deaths decrease in high-income countries, the aim of burn care is shifting
towards improving complications associated with an impaired healing response [2]. Healing rate
correlates with the extent of damage, as deeper burns show a greater inflammatory response. Analyses
of human burn tissues indicate that a delay in neutrophil infiltration is associated with increased burn
wound depth [7], with deep burn wounds showing peak influx of neutrophils at one week post burn,
with a transition to macrophages within 2–3 weeks [8–10]. However, in patients with severe burn
injuries that cover a greater body surface area, or in patients that fail to survive, this inflammatory cell
influx begins later and persists longer [8,9]. Pro-inflammatory cytokine levels also peak after 1–2 weeks
in the blood of adults with deep burn wounds [11,12], while increased and sustained cytokine
production is associated with more severe burn wounds and with non-survival [13,14]. Damage
to the skin barrier also disrupts resident immune cells, with activation and emigration of epidermal
Langerhans cells (LC) and dermal dendritic cell (DC) from the skin [15] likely to increase susceptibility
to infection, and the risk of sepsis and systemic inflammation. Hypertrophic scarring [16], which
arises from deep burn wounds, leads to pain, pruritus and impaired motility, and is characterised by
prolonged wound inflammation, contraction, fibrosis, abnormal collagen deposition, and excess LC and
mast cell numbers [17,18]. The inflammatory response is therefore central to most burn complications.
      In order to understand burn complications, optimise current treatment regimes and identify novel
therapeutic targets, reliable animal models are needed. The choice of a reproducible experimental
model is crucial and ideally should be as close as possible to replicate burn injuries in humans. A range
of species have been evaluated for burn studies [19,20], and one of the most commonly used is the
mouse. With a short healing time, robust immune system, cost effective housing, maintenance and
reproduction, and availability of genetically-modified variants and specific reagents, murine models
have provided key insights into burn healing response [21–24]. The mouse does, however, have
its limitations as a burn model, as its skin is thin and healing occurs primarily through contraction
and not re-epithelialization as in humans [23]. The abundance of hair follicles also provides an
enriched pool of progenitor cells that mean healing in mice is accelerated relative to humans [25].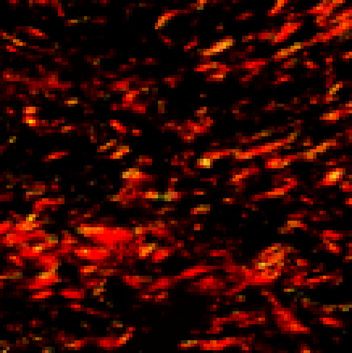
Int. J. Mol. Sci. 2019, 20, 538                                                                     3 of 17

Differences also exist in the immune response between humans and mice, particularly with regards
to chemokines, cytokines and cytokine receptors [26,27]. These differences mean that unlike with
humans, burn injuries in mice do not lead to excessive scarring [23]. Scarring does appear more
hypertrophic following chemical burns [28], bleomycin treatment [29], applied mechanical force [30]
and in tight-skin mice [31]. Another issue with murine models is that there has been no standardization
with regards to the burn generation technique used. Numerous techniques have been tried, including
heated water [22], sodium hydroxide [28], hot air [21] or heated metal [24,28,32], but with varying
consistency with regards to burn depth. Arguably, the most consistent method of application is the
heated metal rod, where by the burn depth correlates with contact time [33]. But, as with many burn
techniques, the inflammatory responses in this model have not been well defined.
      So, to improve the translatability of any findings generated in this murine thermal burn model,
key inflammatory processes need to be assessed to identify similarities and differences to human burns.
The aim of this study was therefore to create partial-thickness burns in C57Bl/6 mice using a heated
metal rod, and to profile inflammatory cell populations and gene expression relative to healing and
scarring kinetics over a 10-week period. A partial-thickness wound model was chosen as this burn
type represents a significant clinical challenge that requires, and would likely respond to, therapeutic
intervention. The burn wound was left open as there is no clear evidence from human clinical trials to
support the use of dressing for partial-thickness burns [34]. Changes in wound area, width, cell death
and re-epithelialization over time were examined to assess burn severity, and the rate and method
of burn closure, relative to that of human burns [19,24,35,36]. The scar area, thickness and collagen
content were examined over the 10-week period to assess any commonalities with human hypertrophic
scars [29,37–40]. Changes in blood-derived neutrophils and macrophage and in skin-resident mast
cells, DC and LC were evaluated due to their reported presence in human burns or scars [8,9,15,17,18].
Inflammatory cytokines, chemokines, growth factors and collagen subtypes were analysed due to their
detection in the blood of human burn patients or reported role in hypertrophic scarring [12,13,41–43].
Our hypothesis was that this model would generate a reproducible burn injury characterised by a
robust inflammatory response peaking prior to burn contraction and closure like the equivalent human
burn, but unlike with human burns, result in minimal scarring.

2. Results

2.1. Partial-Thickness Thermal Burns Heal through Contraction and Re-epithelialization
     To establish the time course of cutaneous healing in mice following a heated metal rod burn,
photographs were taken of the healing skin (Figure 1a), with histological analysis conducted on
sections of skin biopsies (Figure 1b). Burns quickly reduced in size from day 3 (Figure 1a,b), with a
10% reduction in burn area per day, and complete closure achieved by day 15 (Figure 1c). Contraction
of the burn was evident prior to closure, with a 50% reduction in burn width between day 3 and day
10 (Figure 1d). Re-epithelialization of the burn began at day 3, with ~50% coverage by day 7, and
complete coverage achieved by day 14 (Figure 1d). DNA fragmentation characteristic of apoptotic and
necrotic cells progressed from the upper dermis, hair follicles, and adipose layer at day 1, to the eschar
at day 7 (Figure 2a). The depth of the burn was consistent (0.55 ± 0.04 mm), and equivalent to the depth
of the panniculus carnosus (PC) (Figure 2b). These results indicate that this thermal burn produces a
consistent partial-thickness injury that heals through both contraction and re-epithelialization within
two weeks.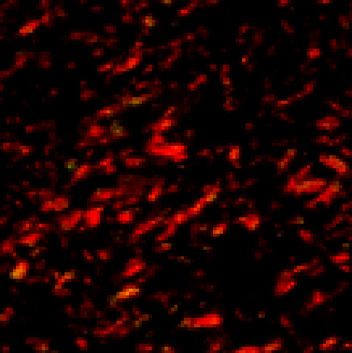
Int. J. Mol. Sci. 2019, 20, 538                                                                                                                                                  4 of 17
      Int. J. Mol. Sci. 2019, 20,                                                                                                                                                     4 of 17

        (a)                                            (b)

                         d1

                         d3

                         d7

                         d10

                         d14
                                                4 mm                                                                                                                 1 mm

        (c)                                                          (d)                                              (e)
                                  100                                                  10                                                        120
                                                                                                                      Re-epithelialization (%)
         Residual burn area (%)

                                                                                                                                                 100
                                   80                                                   8
                                                                     Burn width (mm)

                                                                                                                                                  80
                                   60                                                   6
                                                                                                                                                  60
                                   40                                                   4
                                                                                                                                                  40

                                   20                                                   2
                                                                                                                                                  20

                                    0                                                   0                                                          0
                                        1   3     5    7   10   14                          1    3    7    10    14                                    1    3    7    10    14
                                            Days post burn                                      Days post burn                                             Days post burn

       Figure 1. Heated metal rod burns heal through contraction and re-epithelialization. (a) Photographs
            Figure 1. Heated metal rod burns heal through contraction and re-epithelialization. (a) Photographs
       and (b) images of Martius, Scarlet and Blue (MSB)-stained sections of healing skin at the indicated day
            and (b) images of Martius, Scarlet and Blue (MSB)-stained sections of healing skin at the indicated
       post thermal burn. Scale is as indicated. (c) Burn closure is shown as a change in the percentage of the
            day post thermal burn. Scale is as indicated. (c) Burn closure is shown as a change in the percentage
       original burn area over-time. (d) Burn contraction is shown as the change in burn width over-time.
            of the original burn area over-time. (d) Burn contraction is shown as the change in burn width over-
       (e) Burn re-epithelialization is shown as the change in the percentage neo-epidermal coverage over-time.
            time. (e) Burn re-epithelialization is shown as the change in the percentage neo-epidermal coverage
       Data represents the mean ± SEM, n = 8.
            over-time. Data represents the mean ± SEM, n = 8.
Int.
 Int.J.J.Mol.
          Mol.Sci.  2019,20,
               Sci.2019,  20,538                                                                                                5 5ofof1717

        (a)                                                                      (b)
                                                                                                1.5   full-thickness skin
        d1                                                                                            panniculus carnosus
                                                                                                      burn

                                                                                  Depth (mm2)
                                                                                                1.0

        d3
                                                                                                0.5

        d7                                                                                      0.0
                                                                                                      1           3         7
                                                                        1 mm
                                                                                                          Days post burn

        Figure2.2.Application
       Figure      Applicationofofaaheated
                                         heatedmetal
                                                   metalrod
                                                          rodresults
                                                               resultsinina apartial-thickness
                                                                              partial-thicknessskin
                                                                                                  skinburn.
                                                                                                        burn.(a)
                                                                                                               (a)Images
                                                                                                                    Imagesofof
       healing skin   sections with   terminal   deoxynucleotidyl     transferase-mediated
        healing skin sections with terminal deoxynucleotidyl transferase-mediated deoxyuridine deoxyuridine    triphosphate
       nick-end  labelling
        triphosphate         (TUNEL)
                        nick-end          at the
                                   labelling     indicated
                                              (TUNEL)         dayindicated
                                                          at the   post thermal    burn.
                                                                             day post      Scale burn.
                                                                                        thermal  is as indicated.   (b) Burn
                                                                                                        Scale is as indicated.
       depth overdepth
        (b) Burn    time isover
                            showntimerelative  to therelative
                                        is shown       depth of
                                                              tofull-thickness
                                                                  the depth of skin    and the panniculus
                                                                                  full-thickness  skin and carnosus.    Data
                                                                                                             the panniculus
       represents  the  mean   ±  SEM,   n  = 6.
        carnosus. Data represents the mean ± SEM, n = 6.
2.2. Partial-Thickness Skin Burns Result in a Persistent Scar
 2.2. Partial-Thickness Skin Burns Result in a Persistent Scar
      To establish the extent of scarring in mice following a heated rod burn, photographs were taken
       To establish the extent of scarring in mice following a heated rod burn, photographs were taken
of the residual scar at the indicated time points (Figure 3a), with histological analysis conducted
 of the residual scar at the indicated time points (Figure 3a), with histological analysis conducted on
on sections of skin biopsies (Figure 3b). The residual scar increased in size from day 14 to day 42
 sections of skin biopsies (Figure 3b). The residual scar increased in size from day 14 to day 42 (Figure
(Figure 3a–c), with a final area ~50% that of the original burn (Figure 3d). The epidermis of the
 3a–c), with a final area ~50% that of the original burn (Figure 3d). The epidermis of the scar was three
scar was three times that of undamaged skin at day 14 but had returned to normal thickness by
 times that of undamaged skin at day 14 but had returned to normal thickness by day 28 (Figure 3e).
day 28 (Figure 3e). At day 70, however the epidermal scar thickness had increased to twice that of
 At day 70, however the epidermal scar thickness had increased to twice that of undamaged skin
undamaged skin (Figure 3e). The dermal scar to increase in area relative to its thickness over the
 (Figure 3e). The dermal scar to increase in area relative to its thickness over the 70 days. (Figure 3f).
70 days. (Figure 3f). Collagen density within the scar also increased over time and was equivalent in
 Collagen density within the scar also increased over time and was equivalent in abundance to
abundance to undamaged skin by day 70 (Figure 3g). Parallel collagen fibre formation was observed
 undamaged skin by day 70 (Figure 3g). Parallel collagen fibre formation was observed from day 28
from day 28 to day 56, with basket weave-like texture reminiscent of normal skin evident at day 70
 to day 56, with basket weave-like texture reminiscent of normal skin evident at day 70 (Figure 3c).
(Figure 3c). There also appeared to be an increase in the presence of skin appendages, such as hair
 There also appeared to be an increase in the presence of skin appendages, such as hair follicles, within
follicles, within the scar at day 70 (Figure 3c). These results indicate that this thermal burn produces a
 the scar at day 70 (Figure 3c). These results indicate that this thermal burn produces a scar that
scar that increases in size and matures over 10 weeks.
 increases in size and matures over 10 weeks.
2.3. Partial-Thickness Skin Burns Lead to Changes in the Inflammatory Cell Population during the Healing and
Scarring Process
      To establish inflammatory cell dynamics following a heated rod burn, immunofluorescent and
histological analyses were conducted on sections of skin biopsies (Figure 4a–d). Immunofluorescent
staining for the neutrophil marker, granulocyte-differentiation antigen (Gr-1), was evident within the
burn and scar tissue from day 1 to day 42 (Figure 4e) but was most abundant in the eschar at day
7 (Figure 4a). F4/80 staining showed a substantial influx of macrophages below the burn at day 7
(Figure 4a), persisting at that level in the scar until day 21 and remaining above that of normal skin
at all time-points examined (Figure 4f). Staining for calprotectin and inducible nitric oxide synthase
(iNOS), which are expressed in M1 macrophages, showed an increase in double-stained cells from
day 7 that peaked at day 14 within the scar tissue (Figure 4b), then persisted above that of normal
skin (Figure 4g). The markers for antigen presenting cells of the skin—dermal DC and epidermal
LC—showed contrasting profiles. Major histocompatibility complex (MHC) class II-positive DC
increased within the healing burn, peaking at day 14 (Figure 4c,h), then reducing to the number found
in normal skin from day 21. Cluster of differentiation (CD)207-positive LC however decreased over
time, remaining at ~20% of that of normal skin from day 7 to day 70 (Figure 4c,i). Toluidine blue
staining showed a reduction in skin-resident mast cell granules until day 14, with numbers increasing
Int. J. Mol. Sci. 2019, 20, 538                                                                                                                                                                                                                       6 of 17

in the scar tissue to higher than that of normal skin, peaking at day 70 post burn (Figure 4d,j). These
results indicate there is a strong influx of neutrophils, DC and macrophages following this thermal burn,
with a contrasting reduction in epidermal LC and dermal mast cells. Changes in the inflammatory cell
populations also persist during scar remodelling, with the numbers of LC and mast cells lower and
higher
   Int. J. than  normal
           Mol. Sci.        skin, respectively.
                     2019, 20,                                                                        6 of 17

                                       (a)                    (b)                                                                            (c)

                                   d14

                                   d21

                                   d28

                                   d42

                                   d56

                                   d70
                                                       4 mm                                                            1 mm                                                       1 mm                                        50 µm

     (d)                                                      (e)                                                        (f)                                                      (g)
                       0.3                                                           4                                                       8000                                                              80
                                                                                                                                                                                   Collagen density (% area)
                                                              Epidermal scar index

                                                                                                                         Dermal scar index

                                                                                     3                                                       6000                                                              60
     Scar area (mm2)

                                                                                                                                                                                                                    normal
                       0.2                                                                                                                                                                                           skin

                                                                                     2                                                       4000                                                              40

                       0.1
                                                                                     1                                                       2000                                                              20

                       0.0                                                           0                                                          0                                                               0
                             14   21   28    42   56    70                               14   21   28   42   56   70                                14   21   28   42   56   70                                      14      21   28   42   56   70
                                  Days post burn                                              Days post burn                                             Days post burn                                                      Days post burn

          Figure   3. 3.Heated
              Figure     Heated metal   rod burns
                                 metal rod   burnsresult
                                                    resultinina persistent
                                                                a persistent   scar.
                                                                           scar.      (a) Photographs
                                                                                 (a) Photographs        and images
                                                                                                   and images         of
                                                                                                               of (b) MSB-
          (b)stained
               MSB-stained   and (c) picrosirius red-stained   sections of skin scars at the indicated day post-thermal
                       and (c) picrosirius red-stained sections of skin scars at the indicated day post-thermal burn.
          burn. Collagen deposition within the scars is shown at higher magnification in the right panel. Scale is
              Collagen deposition within the scars is shown at higher magnification in the right panel. Scale is as
          as indicated. (d) Scar area is shown as a change in the percentage of the area over-time. (e) Epidermal
              indicated. (d) Scar area is shown as a change in the percentage of the area over-time. (e) Epidermal
          scar index is shown as the change in epidermal width within the scar relative to adjacent skin over-time.
              scar index is shown as the change in epidermal width within the scar relative to adjacent skin over-
          (f) Dermal scar index is shown as the change in the dermal scar area relative to the average scar width
              time. (f) Dermal scar index is shown as the change in the dermal scar area relative to the average scar
          over-time. (g) Collagen density is shown as the change in the percentage of the area of collagen staining
              width over-time. (g) Collagen density is shown as the change in the percentage of the area of collagen
          over-time. Data represents the mean ± SEM, n = 8.
              staining over-time. Data represents the mean ± SEM, n = 8.

   2.3. Partial-Thickness Skin Burns Lead to Changes in the Inflammatory Cell Population during the Healing
   and Scarring Process
         To establish inflammatory cell dynamics following a heated rod burn, immunofluorescent and
   histological analyses were conducted on sections of skin biopsies (Figure 4a–d). Immunofluorescent
   staining for the neutrophil marker, granulocyte-differentiation antigen (Gr-1), was evident within the
   burn and scar tissue from day 1 to day 42 (Figure 4e) but was most abundant in the eschar at day 7
   (Figure 4a). F4/80 staining showed a substantial influx of macrophages below the burn at day 7
   (Figure 4a), persisting at that level in the scar until day 21 and remaining above that of normal skin
   at all time-points examined (Figure 4f). Staining for calprotectin and inducible nitric oxide synthase
staining showed a reduction in skin-resident mast cell granules until day 14, with numbers increasing
in the scar tissue to higher than that of normal skin, peaking at day 70 post burn (Figure 4d,j). These
results indicate there is a strong influx of neutrophils, DC and macrophages following this thermal
burn, with a contrasting reduction in epidermal LC and dermal mast cells. Changes in the
Int. J. Mol. Sci. 2019,
inflammatory 20,populations
cell 538 also persist during scar remodelling, with the numbers of LC and 7mast
of 17
cells lower and higher than normal skin, respectively.
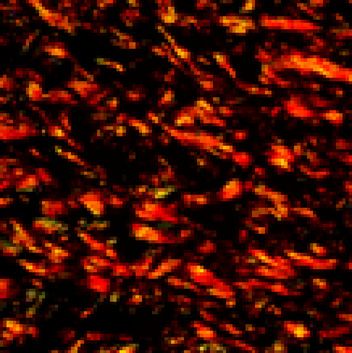
(a) Day 7 post burn Gr1 F4/80 DAPI (b) Day 14 post burn calprotectin iNOS DAPI
75 µm
1 mm 1 mm 100 µm
(c) Day 14 post burn MHC II CD207 DAPI (d) Day 70 post burn toluidine blue
1 1
2 150 µm
2
1 mm 750 µm 100 µm
(e) (f) (g)
10000 1000 250
F4/80+ macrophages / mm2
Gr-1+ neutrophils / mm2
calprotectin+ / iNOS+
800
macrophages / mm2
1000 200
100 600 150
10 400 100
normal
skin
1 200 50
normal
normal skin
0.1 0 skin 0
1 3 7 10 14 21 42 56 70 1 3 7 10 14 21 42 56 70 1 3 7 10 14 21 42 56 70
Days post burn Days post burn Days post burn
(h) (i) (j)
400 2500 30
toluidine blue+ mast cells / mm2
CD207+ LC / mm2 epidermis
normal
skin
2000
MHCII+ DC / mm2
300
20
1500
200
1000
10
100 normal
normal 500 skin
skin
0 0 0
1 3 7 10 14 21 42 56 70 1 3 7 10 14 21 42 56 70 1 3 7 10 14 21 42 56 70
Days post burn Days post burn Days post burn
Figure 4. Profile of inflammatory cell populations during healing and scarring of heated rod burns.
Figure 4. Profile of inflammatory cell populations during healing and scarring of heated rod burns.
Images of skin sections stained with 40 ,6-diamidino-2-phenylindole (DAPI) and antibodies against
Images of skin sections stained with 4′,6-diamidino-2-phenylindole (DAPI) and antibodies against (a)
(a) Gr-1 and F4/80, (b) calprotectin and iNOS, (c) MHC II and CD207, or with (d) toluidine blue at the
Gr-1 and F4/80, (b) calprotectin and iNOS, (c) MHC II and CD207, or with (d) toluidine blue at the
indicated day post thermal burn. Cell-specific staining is shown at higher magnification in the right
indicated day post thermal burn. Cell-specific staining is shown at higher magnification in the right
panel. Scale is as indicated. Changes in the number of (e) Gr-1++ neutrophils, (f) F4/80++ macrophages,
panel. Scale is as indicated. Changes in the number of (e) Gr-1 neutrophils, (f) F4/80 macrophages,
(g) calprotectin+ and iNOS+ + macrophages, (h) MHC+ II+ DC, (i) CD207 + LC, and (j) toluidine blue+
(g) calprotectin+ and iNOS macrophages, (h) MHC II DC, (i) CD207+ LC, and (j) toluidine blue+ mast
mast cells within the burn/scar over time are expressed relative to area. Values for normal skin are as
cells within the burn/scar over time are expressed relative to area. Values for normal skin are as
indicated. Data represents the mean ± SEM, n = 6.
indicated. Data represents the mean ± SEM, n = 6.
2.4. Partial-Thickness Skin Burns Lead to Changes in Inflammatory Gene Expression that Peak during the
2.4. Partial-Thickness
Healing Skin BurnsEffects
Process, with Sustained Lead toonChanges in Inflammatory
Fibrotic Gene Expression Gene Expression that Peak during the
Healing Process, with Sustained Effects on Fibrotic Gene Expression
To establish the timing of the inflammatory response following a heated rod burn, quantitative
polymerase chain reactions (PCR) were used to profile gene expression in the healing skin (Figure 5).
Expression of the pro-inflammatory cytokines, interleukin (IL)-1β, IL-6 and tumour necrosis factor
(TNF) peaked in the healing burn at ~day 3, returning to below that of normal skin by day 10
(Figure 5a–c). The pro-inflammatory chemokines, macrophage chemoattractant protein (MCP)-1
and macrophage inflammatory protein (MIP)-2α peaked in burn tissue at day 1 and 3, respectively,
again dropping below base-line at day 10 and day 14 (Figure 5d,e). The anti-inflammatory cytokine,
IL-10, initially increased in expression within the burn at day 1, but then decreased well below
that of undamaged skin from day 7 (Figure 5f). Expression of vascular endothelial growth factor
(VEGF)-A, which is critical for vascularization, increased in skin burns only at day 3 and day 7
(Figure 5g). Regulators of fibroblast function, transforming growth factor (TGF)-β1 and TGF-β3,Int. J. Mol. Sci. 2019, 20, 538 8 of 17
showed contrasting expression patterns, with TGF-β1 expression greater than that of normal skin from
day 1 to day 7, while TGF-β3 expression increased from day 7 to day 14 (Figure 5h,i). With each of
these genes, the expression level within scar tissue from day 21 to day 70 post burn was equivalent
to that of normal skin. Expression of the predominant collagen (Col) types in the skin, Col3α1 and
Col1α2, was initially less than that of normal skin but then showed contrasting expression patterns,
with Col3α1 expression greater than that of normal skin from day 14 to day 28, and Col1α2 expression
increased at day 28 and from day 56 to day 70 (Figure 5j,k). These findings suggest that this thermal
burn induces a strong pro-inflammatory response that subsides prior to burn closure, but that leads to
sustained effects
Int. J. Mol. Sci. on scar remodelling.
2019, 20, 9 of 17
(a) (b) (c)
150 40 15
30
IL-1β mRNA
100 10
TNF mRNA
IL-6 mRNA
20
50 5
10
0 0 0
1 3 7 10 14 1 3 7 10 14 1 3 7 10 14
Days post burn Days post burn Days post burn
(d) (e) (f)
15 8000 2.0
6000 1.5
MCP-1 mRNA
MIP-2α mRNA
IL-10 mRNA
10
4000 1.0
5
2000 0.5
0 0 0.0
1 3 7 10 14 1 3 7 10 14 1 3 7 10 14
Days post burn Days post burn Days post burn
(g) (h) (i)
2.5 2.0 2.0
2.0
1.5 1.5
VEGF-A mRNA
TGF-β1 mRNA
TGF-β3 mRNA
1.5
1.0 1.0
1.0
0.5 0.5
0.5
0.0 0.0 0.0
1 3 7 10 14 1 3 7 10 14 1 3 7 10 14
Days post burn Days post burn Days post burn
(j) (k)
5 4
4
3
Col1α2 mRNA
Col3α1 mRNA
3
2
2
1
1
0 0
14 21 28 42 56 70 14 21 28 42 56 70
Days post burn Days post burn
Figure 5.5. Profile
Figure Profile ofofgene
geneexpression
expressionduring
duringhealing
healingand
andscarring
scarringofofheated
heatedrod
rodburns.
burns.Quantitative
Quantitative
PCR
PCR was used to measure expression of (a) IL-1β, (b) IL-6, (c) TNF, (d) MCP-1, (e) MIP-2α,
was used to measure expression of (a) IL-1β, (b) IL-6, (c) TNF, (d) MCP-1, (e) MIP-2α, (f)
(f) IL-10,
IL-10,
(g)
(g) VEGF-A, (h) TGF-β1, (i) TGF-β3 (j) Col3α1, and (k) Col1α2 in samples taken of healing skin.skin.
VEGF-A, (h) TGF-β1, (i) TGF-β3 (j) Col3α1, and (k) Col1α2 in samples taken of healing The
The
levellevel of mRNA
of mRNA is relative
is relative to thattoofthat
TATAof box
TATA box binding
binding protein protein (TBP)
(TBP) and andskin.
normal normal
Dataskin. Data
represents
represents the mean ± SEM, n = 4.
the mean ± SEM, n = 4.
3. Discussion
The inflammatory response is central to most burn complications, and many current and new
burn interventions aim to target this process. Reliable animal models are therefore critical to defining
to the role of inflammation in the impaired healing, susceptibility to infection and hypertrophicInt. J. Mol. Sci. 2019, 20, 538 9 of 17
3. Discussion
The inflammatory response is central to most burn complications, and many current and new
burn interventions aim to target this process. Reliable animal models are therefore critical to defining
to the role of inflammation in the impaired healing, susceptibility to infection and hypertrophic
scarring observed post burns in humans. Reproducible murine burn models have been developed,
but the inflammatory responses to injury in these models have not been well defined. So, to improve
the translatability of any findings generated in this murine thermal burn model, the inflammatory
processes need to be assessed, so as to identify key similarities and differences with human burns.
This study profiled the inflammatory cell populations and gene expression relative to healing and
scarring kinetics following a heated metal rod burn in C57Bl/6 mice. Consistent with our hypothesis,
this model generated a reproducible, partial-thickness burn injury, which showed a strong influx of
neutrophils with increased pro-inflammatory cytokine and chemokine gene expression that preceded
wound contraction, and re-epithelialization. In contrast to our hypothesis, the macrophage and mast
cell populations persisted into the remodelling phase, despite inflammatory gene expression subsiding,
with the burn injury resulting in a large scar that persisted for at least 10 weeks.
Superficial burns in humans are limited to the epidermis and papillary dermis, result in blister
formation and tend to heal quickly [3]. Application of a heated rod in this murine model caused cell
death to the depth of the panniculus carnosus, lacked blister formation and took two weeks to heal.
This suggests the wound was consistent with that of a deep partial-thickness burn in humans. This
model also showed an extended influx of inflammatory cells, with the peak neutrophil infiltration after
one week, and macrophages numbers peaking 2–3 weeks post burn. This appears consistent with deep
partial- or full-thickness burns in humans that survive their injury [8–10]. The immediate post-burn
expression of IL-6, IL-10, VEGF-A and MCP-1, in the heated rod model is, in turn, consistent with
detection of the same inflammatory mediators in the blood of burns patients [11–14]. However, the
peak expression of TNF and IL-1β, 3 days post burn, differs from human blood where these cytokines
continue to be detected for at least 60 days [11,13]. Persistent cytokine levels in the blood could reflect
systemic inflammation as opposed to burn site expression. Analysis of systemic cytokine levels would
therefore be needed to determine if the murine model accurately replicates the systemic inflammation
characteristic of human burn wounds.
Wound macrophages exhibit different phenotypes based on their pathway of activation, and
the ratio of these phenotypes alters as a wound matures. During the early inflammatory phase of
wound healing in mice, 85% of macrophages have an inflammatory M1 phenotype [44]. The ratio
switches as the proliferative phase of healing begins, and now 80% of macrophages have a reparative
M2 phenotype [44] M1 macrophages are pro-inflammatory, secreting mediators such as calprotectin,
nitric oxide, TNF and IL-6, while M2 macrophages are anti-inflammatory and reparative, producing
cytokines like IL-10, and growth factors such as platelet-derived growth factor-β, TGF-β1 and VEGF-A.
Depletion of macrophages at the early stage of healing in mice reduces inflammation and delays
healing [45], also limiting scarring [46], while macrophage depletion mid healing causes a greater delay
in wound closure, with sustained inflammation and edema [45]. M2 macrophages also promote wound
repair and can exasperate scarring in mice, as chemical inhibition of the M1-M2 transition with GW2580
suppressed collagen production [47], while transplantation of CD301b-positive M2 macrophages
increased fibroblast proliferation and angiogenesis [48]. Profiling of macrophage phenotypes in human
skin showed infiltration of M1 macrophages for 2 weeks after traumatic or burn injury, while M2
macrophages peaked after 3–4 weeks in the proliferative hypertrophic scar [49]. The peripheral blood
of severely burned patients is also dominated by MCP-1-producing M2b monocytes [50]. In the
heated rod model, macrophage numbers increased post burn, peaking after 1–2 weeks, and although
the influx of M1 macrophages showed a similar pattern, they generally represented only 25% of
the total macrophage population at each time point. This ratio is very different to that reported for
full-thickness excisional wounds. The ratio of M1 to M2 macrophages may vary according to mouse
strain, wound type or depth, but this finding would require further experimental validation. StainingInt. J. Mol. Sci. 2019, 20, 538 10 of 17
for additional phenotype-specific markers would ensure the antibodies used are sufficiently sensitive
to detect macrophages with the M1 phenotype and also clarify whether monocytes in the blood, and
macrophages that persist in the scar tissue are of an M2 phenotype.
Peak inflammatory cytokine and chemokine gene expression coincided with tissue necrosis, mast
cell degranulation, and the influx of neutrophils in the heated rod model, but levels diminished
during the period of the macrophage influx. IL-10, TGF-β1 and VEGF-A, by contrast were at maximal
expression level during the first week post burn and were not as abundant when macrophages were at
their maximal. This suggests the relative contribution of macrophages to the production of these genes
in this burn model is low, and that alternative methods may be needed to assess the gene expression
profiles specific to different macrophage phenotypes. The expression of VEGF-A did, however,
coincide with the initiation of burn re-epithelialization, which is consistent with studies in which
VEGF-A promoted wound re-epithelialization, through induction of keratinocyte proliferation and
migration and expression of matrix metalloproteinases [35]. VEGF-A also induces angiogenesis [51],
but the extend of vascularization post burn was not examined in this model. The expression of
TGF-β1 preceded contraction of the injured skin, with stabilization of burn width in concordance with
the increased expression of TGF-β3. Wound contraction is mediated by myofibroblasts, and their
differentiation state, contractility and collagen production are dependent on a high TGF-β1 to TGF-β3
ratio [52,53]. These findings suggest myofibroblast numbers peak by day 10 post burn in this heated
rod model, but further validation and comparison with human burn tissues is required.
Human skin contains epidermal LC and dermal DC, which are key inducers of the adaptive
immune response upon infection. Burn injuries are highly susceptible to infection and in a human ex
vivo burn model, thermal injury induced LC and DC emigration from the skin, with upregulation of
MHC II and costimulatory molecules such as CD80, CD86 and CD40 [15]. In the heated-rod model,
DC numbers initially reduced in the burn but were replenished within 3 days and continued to
increase in number until closure was achieved. This suggests the innate immune response was not
compromised in these mice, and that DC contribute to wound healing responses. Indeed, other studies
in mice have shown DC repopulate the skin by day 4 post burn, modulating neutrophil-mediated
anti-microbial responses [54], and accelerating burn closure through enhanced angiogenesis and
TGF-β1 expression [55]. While LC emigration from the burn was also noted in the heated rod
model, LC depletion was maintained in the remodeling scar. Human hypertrophic scars in contrast
exhibit increased numbers of LCs relative to normal scars and normal skin [18]. The immunological
consequence of LC loss and its functional relevance to scar formation post burn are therefore unclear.
Systemic infections following burns are linked to a sustained pro-inflammatory response,
compounded by compensatory immunosuppressive responses. While inflammatory cells, including
M1 macrophages and DC, persisted in the healing skin after thermal injury, localized production of
pro-inflammatory mediators subsided quickly. Dermal DC emigrating from ex vivo human burns [15]
and splenic DCs in mice subjected to burn injuries [56] reportedly had impaired T cell-activating
capacity. This was linked to expression of immunosuppressive factors, such as IL-10, IL-4, TGF-β
and PDGF, all produced during scar remodeling. Sustained changes in circulating immune cells have
also been observed in mice following a full-thickness burn injury, with increased IL-10 levels in the
blood maintained for 84 days [57]. In this model, only transient expression of the anti-inflammatory
factor, IL-10 was observed within the burn. This is, however, consistent with the detection of IL-10
in the blood of humans suffering from less severe full-thickness burns [11,13]. Systemic changes in
circulating immune cells or cytokine profile were not assessed, and further investigation is required to
determine if immune suppression is a feature of this model.
Mast cells are resident in the skin and completely degranulation following wounding, which
leads to a reduction in staining with granule-specific dyes [58]. Consistent with this, a reduction
in granulated mast cells was observed post burn in the heated rod model. Mast cells contribute to
inflammation, re-epithelialization and angiogenesis through the release of histamine and TNF, and
the synthesis of IL-1β, IL-6, keratinocyte growth factor and VEGF [59]. In tissues that heal quicklyInt. J. Mol. Sci. 2019, 20, 538 11 of 17
with less inflammation and scarring, such as the skin of early gestation mice [58], and the oral mucosa
of pigs [60], reductions in mast cell number, size and degranulation have been reported. Mast cells
also affect fibroblasts, modulating collagen remodelling as opposed to production [61], with higher
numbers observed in hypertrophic scars than in normal skin or normal scars across human and animal
models [17,62]. The high mast cell numbers in the scar tissue in this burn model, is therefore consistent
with that of hypertrophic scars.
Human hypertrophic scars increase in size over a period of 3–6 months, then begin to mature,
flattening and softening over at least a year. Developing scars exhibit a thickened dermis and epidermis,
pronounced inflammatory infiltrate and an abundance of parallel type III collagen fibres [29,37].
Mature hypertrophic scars display more pronounced dermal thickening, and absence of dermal
appendages, collagen whorls and a flattened epidermis [29,39]. In the heated rod model, the residual
scars gradually increased in area, dermal thickness, and in the abundance and size of parallel collagen
fibres. A thickened epidermis and inflammatory infiltrate, with high type III collagen expression
was also evident in the early scar, suggesting that for 3–4 weeks this model is consistent with a
developing human hypertrophic scar. After this point, the scar began to mature, with a reduced
epidermal thickness and inflammatory infiltrate, and increased collagen type I expression. By 10 weeks,
however, the scar showed signs of collagen remodeling into basket-weave fibres and skin appendage
regeneration, indicating the scar was diminishing [25,38]. This pattern of development and resolution
is consistent with other murine models that require mechanical or chemical intervention to generate
the hypertrophic scar [28–30].
The heated rod murine model has been [24,28,32], and likely will continue to be, used to
investigate interventions aimed at treating the impaired healing, infections and hypertrophic scarring
associated with human burns. The findings from this study indicate this model mimics the early
inflammatory events post burn in humans, so is appropriate for investigating anti-inflammatory and
immune-modulatory therapies, and results gained would likely be clinically translatable. The evidence
also suggests this model mimics a developing hypertrophic scar, but its use in this regard is limited
as the scar naturally resolves. The model could, however, be used to assess therapeutics aimed at
hypertrophic scar prevention as opposed to resolution. Another limitation of this model and the study
design is that the burn wound was left open, and as such was more susceptible to infection and to
interference by the mouse. Clinical treatment of superficial burns involves covering with dressings,
although there is controversy regarding their benefits for partial-thickness or deep burns [34]. Dressings
aid moisture retention within the burn, prevent eschar formation and enhance re-epithelialization,
as well as facilitate the use of topical treatments [2,16]. The healing and scarring kinetics, and the
magnitude and timing of the inflammatory response in this model may therefore differ if the heated
rod burns are covered with a dressing.
4. Materials and Methods
4.1. Murine Thermal Burn Model
All procedures were performed with approval from the Animal Ethics Committee of the
University of Otago (#86/013) with animals sourced and housed in the Hercus-Taieri Resource Unit
(Dunedin, New Zealand). C57BL/6 mice (female, 8 weeks of age) were anaesthetized by subcutaneous
(SC) injection of ketamine/domitor/atropine (75/1/0.05 mg/kg, respectively), the dorsum shaved,
depilated and cleaned with saline. Thermal injuries were performed as previously described [32], by
placement of an 8 mm-diameter aluminium rod on the dorsum for 4 s, that had been heated for 5 min in
boiling water. Mice were given SC injections of saline to prevent dehydration, bupivacaine (2 mg/kg)
for pain relief, and amphoprim (30 mg/kg) to prevent infection. No dressing or topical treatments were
applied to the burn wounds. Mice were then revived by SC injection of Antisedan (Zoetis, Auckland,
New Zealand) (5 mg/kg). Digital photographs were captured with a ruler aligned next to the burn
while mice were immobilised with inhaled isoflurane (1–5%). Mice were euthanized at day 1, 3, 7, 10,Int. J. Mol. Sci. 2019, 20, 538 12 of 17
14, 21, 28, 42 and 70, with burns surgically excised and bisected along the medial-lateral axis. One half
was fixed in 0.5% zinc salts solution and processed into paraffin wax so that the midpoint of the burn
was sectioned and compared between groups. The other half had RNA stabilized in RNAlater solution
(Qiagen, Hilden, Germany), with storage at −80 ◦ C.
4.2. Histology
Skin sections (4 µm) stained with MSB or Toluidine blue were visualized under bright light. Skin
sections (4 µm) stained with picrosirius red were visualized under dark-field with a polarized filter.
Images were taken of the section at 10× magnification then converted into panoramas using Photoshop
(Adobe Systems). Using ImageJ (http://imagej.nih.gov/ij/), measurements were taken between the
burn width, and the proportion covered with neo-epidermis. Re-epithelialization was calculated as
a percentage of the burn width covered by neo-epidermis. Four epidermal and dermal thickness
measurements were taken within the burn, with two further measurements at a distance of 500 µm on
either side of the burn. The scar tissue was outlined and the area measured, with the Dermal Scar Index
calculated by dividing the scar area by the average dermal thickness. The Epidermal Scar Index was
calculated by dividing the average of the internal epidermis thickness measurements by the average of
the distal epidermis thickness measurements. Mast cells were quantitated in images taken of Toluidine
blue-stained sections. Images were converted to 8 bit, the entire burn/scar tissue area outlined and
measured, and the threshold adjusted to highlight the stained cells which were counted using the
particle analysis tool. Collagen density within the scar tissue was examined in images of picrosirius
red-stained sections. Images were converted to 8 bit, the scar tissue was outlined and the threshold
adjusted automatically to highlight the stained collagen, with measurements taken as a percentage of
the total scar area.
4.3. Immunofluorescent Histochemistry
Skin sections (4 µm) were incubated with antibodies to Gr-1 (AlexaFluor® 488-RB6-8C; eBioscience,
San Diego, CA, USA; dilution 1:100), F4/80 (AlexaFluor® 594-BM8; eBioscience; 1:100), calprotectin
(MAC387, Abcam, Cambridge, England, 1:200) with goat anti-mouse IgG H + L (AlexaFluor® 488;
Invitrogen, Carlsbad, CA, USA; 1:500), iNOS (rabbit polyclonal ab3523; Abcam; 1:100) with goat
anti-rabbit immunoglobulin G (H + L) (AlexaFluor® 594; Invitrogen; 1:500), MHC class II IA+IE
(FITC-M5/114.15.2; Abcam; 1:400); and supernatant from cells expressing antibodies to CD207 (929F3;
1:5) in conjunction with goat anti-rat IgG2a (AlexaFluor® 594; Invitrogen; 1:500). The Dead End
Fluorometric TUNEL System (Promega, Madison, WI, USA) was used according to manufacturer’s
instructions. Nuclei were stained with DAPI (Invitrogen, 75 nM) and slides mounted with SlowFade
Gold (Invitrogen). Images were taken of the stained section at 40× magnification then converted into
panoramas. To quantify the specific cell types, 0.25 mm × 0.25 mm squares were randomly selected
within images taken of antibody-stained burn/scar tissue sections, at both the dermal/epidermal
junction (4 per section) and the hypodermis (4 per section). The number of stained cells in each square
were counted manually, with the number expressed relative its area. Four burn depth measurements
were taken from the epidermal surface to the bottom of the apoptotic/necrotic tissue highlighted by
TUNEL staining. Two additional measurements were taken, at a distance of 500 µm on either side of
the burn, from the epidermal surface to the panniculus carnosus and to the hypodermis/subcutaneous
tissue junction.
4.4. Quantitative PCR
Two burn samples from each animal were combined and homogenized, then total RNA isolated.
Synthesis of cDNA was carried out with total RNA, oligo(dT)15, and random hexamer primers using
Superscript III (Invitrogen). Quantitative PCR were conducted using Applied Biosystems 7500 Fast
PCR machine, PerfeCTa® SYBR® Green FastMix® (Quanta BioSciences, Beverly, MA, USA), and cDNAInt. J. Mol. Sci. 2019, 20, 538 13 of 17
equivalent to 5ng RNA. Primer pairs were as previously described [35,40,63]. Gene expression was
normalized to TBP [64] and to unwounded skin taken from age and sex-matched mice.
5. Conclusions
This study demonstrated that a heated metal burn produces a highly reproducible,
partial-thickness injury in mice, which mimics key aspects of the inflammatory and hypertrophic
scarring responses observed in humans, post burn. The partial-thickness burn wounds generated in
this model closed within two weeks through both contraction and re-epithelialization as seen with
human burns. Again, consistent with human burns, the injury caused an increase in the expression
of pro-inflammatory mediators, an influx of neutrophils, and the disappearance of LC and mast
cells. This was followed by an influx of DC and macrophages with both populations peaking at
burn closure. As with human burns, the residual scar increased in size, epidermal and dermal
thickness, and mast cell numbers over the 10-week period, but unlike human burns the abnormal
collagen I-collagen III ratios, fibre organization and macrophage populations resolved 3–4 weeks
after the burn closed. The model, therefore, has considerable potential to further understanding of
the complex processes implicated in burn healing complications, susceptibility to infection, and the
formation of hypertrophic scars. To increase knowledge regarding inflammatory and skin-resident
immune cells and their role in re-epithelialization and burn contraction, this model should be utilised
prior to burn closure, within two weeks. Also in the 3–4 weeks post closure, this model can be
used to investigate immune cell populations involved in scar development and remodelling. The
use of this model for this purpose may be limited as it does not appear to mimic the systemic
inflammation, immune suppression and persistent scarring associated with human burns. However,
by characterising the inflammatory response relative to healing and scarring for the murine model,
this research provides critical information that will guide the preclinical evaluation of new and much
needed anti-inflammatory and anti-scarring treatments for thermal burns.
Author Contributions: Study conceptualization, L.W., S.F. and A.M.; methodology, L.W., G.S. and N.J.; acquisition
of data, Z.L., G.S. and N.J.; analysis and interpretation of data, L.W., and Z.L.; writing—original draft preparation,
Z.L. and L.W.; writing—review and editing, L.W., S.F. and A.M.; project administration and funding acquisition,
L.W. and A.M. All authors have seen and approved the manuscript.
Funding: This research was supported by a contract from the Health Research Council of New Zealand
(No. 13/774).
Acknowledgments: We are grateful to Amanda Fisher, Janine Neill and Alisha Shaw from the Histology Unit,
Department of Pathology, and Kevalee Sriutaisuk, Department of Pharmacology and Toxicology, University of
Otago, for expert technical assistance.
Conflicts of Interest: The authors declare no conflicts of interest. The funders had no role in the design of the
study; in the collection, analyses or interpretation of data; in the writing of the manuscript, or in the decision to
publish the results.
Abbreviations
CD Cluster of differentiation
Col Collagen
DC Dendritic cell
IL Interleukin
Gr-1 granulocyte-differentiation antigen
iNOS inducible nitric oxide synthase
LC Langerhans cell
M1 Inflammatory macrophage
M2 Reparative macrophage
MCP Macrophage chemoattractant protein
MHC Major histocompatibility complex
MIP Macrophage inflammatory proteinInt. J. Mol. Sci. 2019, 20, 538 14 of 17
MSB Martius, Scarlet and Blue
PC Panniculus carnosus
PCR Polymerase chain reaction
SC Subcutaneous
TBP TATA box binding protein
TGF Transforming growth factor
TNF Tumour necrosis factor
Terminal deoxynucleotidyl transferase-mediated deoxyuridine triphosphate nick end
TUNEL
labelling
VEGF Vascular endothelial growth factor
References
1. WHO Fact Sheet: Burns. Available online: https://www.who.int/news-room/fact-sheets/detail/burns
(accessed on 6 March 2018).
2. Wang, Y.; Beekman, J.; Hew, J.; Jackson, S.; Issler-Fisher, A.C.; Parungao, R.; Lajevardi, S.S.; Li, Z.; Maitz, P.K.M.
Burn injury: Challenges and advances in burn wound healing, infection, pain and scarring. Adv. Drug
Deliv. Rev. 2018, 123, 3–17. [CrossRef]
3. Monstrey, S.; Hoeksema, H.; Verbelen, J.; Pirayesh, A.; Blondeel, P. Assessment of burn depth and burn
wound healing potential. Burns 2008, 34, 761–769. [CrossRef] [PubMed]
4. Khan, A.A.; Rawlins, J.; Shenton, A.F.; Sharpe, D.T. The Bradford Burn Study: The epidemiology of burns
presenting to an inner city emergency department. Emerg. Med. J. 2007, 24, 564–566. [CrossRef] [PubMed]
5. Evers, L.H.; Bhavsar, D.; Mailander, P. The biology of burn injury. Exp. Dermatol. 2010, 19, 777–783. [CrossRef]
[PubMed]
6. Rose, L.F.; Chan, R.K. The Burn Wound Microenvironment. Adv. Wound Care 2016, 5, 106–118. [CrossRef]
[PubMed]
7. Tyler, M.P.; Watts, A.M.; Perry, M.E.; Roberts, A.H.; McGrouther, D.A. Dermal cellular inflammation in burns.
an insight into the function of dermal microvascular anatomy. Burns 2001, 27, 433–438. [CrossRef]
8. Peng, D.; Huang, W.; Ai, S.; Wang, S. Clinical significance of leukocyte infiltrative response in deep wound
of patients with major burns. Burns 2006, 32, 946–950. [CrossRef] [PubMed]
9. Tarran, S.; Langlois, N.E.; Dziewulski, P.; Sztynda, T. Using the inflammatory cell infiltrate to estimate the
age of human burn wounds: A review and immunohistochemical study. Med. Sci. Law 2006, 46, 115–126.
[CrossRef]
10. van de Goot, F.; Krijnen, P.A.; Begieneman, M.P.; Ulrich, M.M.; Middelkoop, E.; Niessen, H.W. Acute
inflammation is persistent locally in burn wounds: A pivotal role for complement and C-reactive protein.
J. Burn Care Res. 2009, 30, 274–280. [CrossRef]
11. Finnerty, C.C.; Jeschke, M.G.; Herndon, D.N.; Gamelli, R.; Gibran, N.; Klein, M.; Silver, G.; Arnoldo, B.;
Remick, D.; Tompkins, R.G. Temporal cytokine profiles in severely burned patients: A comparison of adults
and children. Mol. Med. 2008, 14, 553–560. [CrossRef]
12. Hur, J.; Yang, H.T.; Chun, W.; Kim, J.H.; Shin, S.H.; Kang, H.J.; Kim, H.S. Inflammatory cytokines and their
prognostic ability in cases of major burn injury. Ann. Lab. Med. 2015, 35, 105–110. [CrossRef] [PubMed]
13. Jeschke, M.G.; Gauglitz, G.G.; Finnerty, C.C.; Kraft, R.; Mlcak, R.P.; Herndon, D.N. Survivors versus
nonsurvivors postburn: Differences in inflammatory and hypermetabolic trajectories. Ann. Surg. 2014, 259,
814–823. [CrossRef] [PubMed]
14. Kim, H.S.; Kim, J.H.; Yim, H.; Kim, D. Changes in the levels of interleukins 6, 8, and 10, tumor necrosis
factor alpha, and granulocyte-colony stimulating factor in Korean burn patients: Relation to burn size and
postburn time. Ann. Lab. Med. 2012, 32, 339–344. [CrossRef] [PubMed]
15. van den Berg, L.M.; de Jong, M.A.; Witte, L.; Ulrich, M.M.; Geijtenbeek, T.B. Burn injury suppresses human
dermal dendritic cell and Langerhans cell function. Cell Immunol. 2011, 268, 29–36. [CrossRef] [PubMed]
16. Finnerty, C.C.; Jeschke, M.G.; Branski, L.K.; Barret, J.P.; Dziewulski, P.; Herndon, D.N. Hypertrophic scarring:
The greatest unmet challenge after burn injury. Lancet 2016, 388, 1427–1436. [CrossRef]
17. Kischer, C.W.; Bunce, H., 3rd; Shetlah, M.R. Mast cell analyses in hypertrophic scars, hypertrophic scars
treated with pressure and mature scars. J. Investig. Dermatol. 1978, 70, 355–357. [CrossRef] [PubMed]Int. J. Mol. Sci. 2019, 20, 538 15 of 17
18. Niessen, F.B.; Schalkwijk, J.; Vos, H.; Timens, W. Hypertrophic scar formation is associated with an increased
number of epidermal Langerhans cells. J. Pathol. 2004, 202, 121–129. [CrossRef] [PubMed]
19. Abdullahi, A.; Amini-Nik, S.; Jeschke, M.G. Animal models in burn research. Cell. Mol. Life Sci. 2014, 71,
3241–3255. [CrossRef] [PubMed]
20. Domergue, S.; Jorgensen, C.; Noel, D. Advances in Research in Animal Models of Burn-Related Hypertrophic
Scarring. J. Burn Care Res. 2015, 36, e259–e266. [CrossRef] [PubMed]
21. Calum, H.; Moser, C.; Jensen, P.O.; Christophersen, L.; Maling, D.S.; van Gennip, M.; Bjarnsholt, T.; Hougen, H.P.;
Givskov, M.; Jacobsen, G.K.; et al. Thermal injury induces impaired function in polymorphonuclear
neutrophil granulocytes and reduced control of burn wound infection. Clin. Exp. Immunol. 2009, 156,
102–110. [CrossRef] [PubMed]
22. Medina, J.L.; Fourcaudot, A.B.; Sebastian, E.A.; Shankar, R.; Brown, A.W.; Leung, K.P. Standardization of
deep partial-thickness scald burns in C57BL/6 mice. Int. J. Burns Trauma 2018, 8, 26–33. [PubMed]
23. Wong, V.W.; Sorkin, M.; Glotzbach, J.P.; Longaker, M.T.; Gurtner, G.C. Surgical approaches to create murine
models of human wound healing. J. Biomed. Biotechnol. 2011, 2011, 969618. [CrossRef] [PubMed]
24. Wu, J.C.; Rose, L.F.; Christy, R.J.; Leung, K.P.; Chan, R.K. Full-Thickness Thermal Injury Delays Wound
Closure in a Murine Model. Adv. Wound Care 2015, 4, 83–91. [CrossRef] [PubMed]
25. Ito, M.; Yang, Z.; Andl, T.; Cui, C.; Kim, N.; Millar, S.E.; Cotsarelis, G. Wnt-dependent de novo hair follicle
regeneration in adult mouse skin after wounding. Nature 2007, 447, 316–320. [CrossRef] [PubMed]
26. Mestas, J.; Hughes, C.C. Of mice and not men: Differences between mouse and human immunology.
J. Immunol. 2004, 172, 2731–2738. [CrossRef] [PubMed]
27. Olson, T.S.; Ley, K. Chemokines and chemokine receptors in leukocyte trafficking. Am. J. Physiol. Regul.
Integr. Comp. Physiol. 2002, 283, R7–R28. [CrossRef] [PubMed]
28. Kim, M.; Kim, H.; Kang, H.W. Comparative evaluations of hypertrophic scar formation in in vivo models.
Lasers Surg. Med. 2018, 50, 661–668. [CrossRef]
29. Cameron, A.M.; Adams, D.H.; Greenwood, J.E.; Anderson, P.J.; Cowin, A.J. A novel murine model of
hypertrophic scarring using subcutaneous infusion of bleomycin. Plast. Reconstruct. Surg. 2014, 133, 69–78.
[CrossRef]
30. Aarabi, S.; Bhatt, K.A.; Shi, Y.; Paterno, J.; Chang, E.I.; Loh, S.A.; Holmes, J.W.; Longaker, M.T.; Yee, H.;
Gurtner, G.C. Mechanical load initiates hypertrophic scar formation through decreased cellular apoptosis.
FASEB J. 2007, 21, 3250–3261. [CrossRef]
31. Long, K.B.; Artlett, C.M.; Blankenhorn, E.P. Tight skin 2 mice exhibit a novel time line of events leading to
increased extracellular matrix deposition and dermal fibrosis. Matrix Biol. 2014, 38, 91–100. [CrossRef]
32. Zhang, X.; Wei, X.; Liu, L.; Marti, G.P.; Ghanamah, M.S.; Arshad, M.J.; Strom, L.; Spence, R.; Jeng, J.;
Milner, S.; et al. Association of increasing burn severity in mice with delayed mobilization of circulating
angiogenic cells. Arch. Surg. 2010, 145, 259–266. [CrossRef] [PubMed]
33. Cai, E.Z.; Ang, C.H.; Raju, A.; Tan, K.B.; Hing, E.C.; Loo, Y.; Wong, Y.C.; Lee, H.; Lim, J.; Moochhala, S.M.; et al.
Creation of consistent burn wounds: A rat model. Arch. Plast. Surg. 2014, 41, 317–324. [CrossRef] [PubMed]
34. Wasiak, J.; Cleland, H.; Campbell, F.; Spinks, A. Dressings for superficial and partial thickness burns.
Cochrane Database Syst. Rev. 2013, Cd002106. [CrossRef] [PubMed]
35. Wise, L.M.; Inder, M.K.; Real, N.C.; Stuart, G.S.; Fleming, S.B.; Mercer, A.A. The vascular endothelial growth
factor (VEGF)-E encoded by orf virus regulates keratinocyte proliferation and migration and promotes
epidermal regeneration. Cell. Microbiol. 2012, 14, 1376–1390. [CrossRef] [PubMed]
36. Singer, A.J.; McClain, S.A.; Taira, B.R.; Guerriero, J.L.; Zong, W. Apoptosis and necrosis in the ischemic zone
adjacent to third degree burns. Acad. Emerg. Med. 2008, 15, 549–554. [CrossRef] [PubMed]
37. Lee, J.Y.; Yang, C.C.; Chao, S.C.; Wong, T.W. Histopathological differential diagnosis of keloid and
hypertrophic scar. Am. J. Dermatopathol. 2004, 26, 379–384. [CrossRef]
38. Rawlins, J.M.; Lam, W.L.; Karoo, R.O.; Naylor, I.L.; Sharpe, D.T. Quantifying collagen type in mature burn
scars: A novel approach using histology and digital image analysis. J. Burn Care Res. 2006, 27, 60–65.
[CrossRef]
39. Verhaegen, P.D.; van Zuijlen, P.P.; Pennings, N.M.; van Marle, J.; Niessen, F.B.; van der Horst, C.M.;
Middelkoop, E. Differences in collagen architecture between keloid, hypertrophic scar, normotrophic scar,
and normal skin: An objective histopathological analysis. Wound Repair Regen. 2009, 17, 649–656. [CrossRef]You can also read