THE DANISH AIR QUALITY MONITORING - PROGRAMME ANNUAL SUMMARY FOR 2010 AU NATIONAL ENVIRONMENTAL RESEARCH INSTITUTE
←
→
Page content transcription
If your browser does not render page correctly, please read the page content below
The Danish Air Quality Monitoring
Programme
Annual Summary for 2010
NERI Technical Report no. 836     2011

AU
              NATIONAL ENVIRONMENTAL RESEARCH INSTITUTE
              AARHUS UNIVERSITY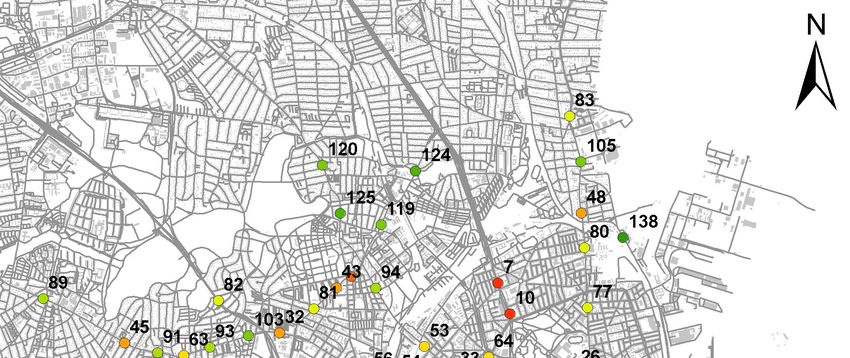
[Blank page]
THE DANISH AIR QUALITY MONITORING
     PROGRAMME
     Annual Summary for 2010

     NERI Technical Report no. 836   2011

     Thomas Ellermann
     Claus Nordstrøm
     Jørgen Brandt
     Jesper Christensen
     Matthias Ketzel
     Steen Solvang Jensen

AU
     NATIONAL ENVIRONMENTAL RESEARCH INSTITUTE
     AARHUS UNIVERSITY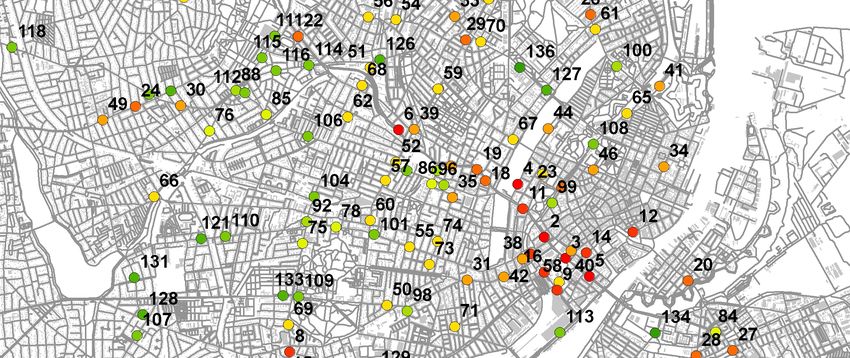
'DWDVKHHW
Series title and no.: NERI Technical Report No 836
Title: The Danish Air Quality Monitoring Programme
Subtitle: Annual Summary for 2010
Authors: Thomas Ellermann, Claus Nordstrøm, Jørgen Brandt, Jesper Christensen, Matthias Ketzel &
Steen Solvang Jensen
Department: Department of Atmospheric Environment
Publisher: National Environmental Research Institute
Aarhus University - Denmark
URL: http://www.neri.dk
Year of publication: 2011
Referee: Ole Hertel
Technical support: Axel Egeløv, Lone Grundahl, Bjarne Jensen, Christina F. Emborg, Henrik W. Madsen, Birgit
Thomsen, Jane Søfting, Lizzi Stausgaard, Hans P. Ahleson, Hans Nielsen, Mary-Ann Chrille-
sen, Tom Rasmussen, Teddy Krongaard, Helle Vibeke Andersen, Jonna Riedel & Stefan Bern-
berg.
Financial support: Ministry of the Environment and Municipalities of Copenhagen, Aalborg, Aarhus and Odense.
Please cite as: Ellermann, T., Nordstrøm, C., Brandt, J., Christensen, J., Ketzel, M. & Jensen, S.S. 2011: The
Danish Air Quality Monitoring Programme. Annual Summary for 2010. National Environmental
Research Institute, Aarhus University. 55 pp. -NERI Technical Report No. 836.
http://www.dmu.dk/Pub/FR836.pdf
Reproduction permitted provided the source is explicitly acknowledged
Abstract: The air quality in Danish cities has been monitored continuously since 1982 within the Danish
Air Quality Monitoring network. The aim is to follow the concentration levels of toxic pollutants in
the urban atmosphere and to provide the necessary knowledge to assess the trends, to perform
source apportionment, and to understand the governing processes that determine the level of
air pollution in Denmark. In 2010 the air quality was measured in four Danish cities and at two
background sites. In addition model calculations were carried out to supplement the measure-
ments. At only one street station (H.C. Andersens Boulevard) in Copenhagen NO2 was found in
concentrations above EU limit values while NO2 in Odense, Aarhus and Aalborg was below the
limit value. Model calculations indicate exceedances of NO2 limit values at several streets in
Copenhagen. Both PM10 and PM2.5 were below limit values at all stations. The concentrations
for most pollutants have been strongly decreasing during the last decades, however, only a
slight decrease has been observed for NO2 and O3.
Keywords: Atmospheric pollution, urban pollution, nitrogen compounds, ozone, sulphur compounds, heavy
metals, volatile organic pollutants, dispersion models
Layout: Majbritt Pedersen-Ulrich
-
ISBN: 978-87-7073-246-8
ISSN (electronic): 1600-0048
Number of pages: 55
Internet version: The report is available in electronic format (pdf) at NERI's website
http://www.dmu.dk/Pub/FR836.pdf
2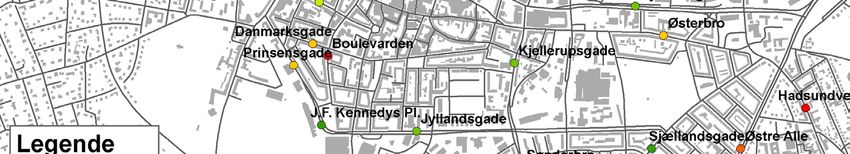
&RQWHQWV

6XPPDU\DQG&RQFOXVLRQ

'DQLVKVXPPDU\'DQVNUHVXPp

      ,QWURGXFWLRQ

      0HDVXUHPHQWVDQGPRGHOFDOFXODWLRQV
2.1     Measurements 13
2.2     Model calculations 15

      1LWURJHQR[LGHV
3.1     Yearly statistics 17
3.2     Trends 18
3.3     Results from model calculations 19

      2]RQH
4.1     Annual statistics 26
4.2     Trends 27
4.3     Results from model calculations 28

      &DUERQPRQR[LGH
5.1     Annual statistics 31
5.2     Trends 32

      %HQ]HQHDQG7ROXHQH
6.1     Annual statistics 33
6.2     Trends 34

      3DUWLFOHV 76330DQG30SDUWLFOHQXPEHU
7.1     Particle measurements 35
7.2     Annual statistics 35
7.3     Trends 38
7.4     Subtraction of salt from winter salting and sea 40

      +HDY\0HWDOV
8.1     Measurements of Heavy Metals 42
8.2     Annual statistics 43
8.3     Trends 44

      6XOSKXUGLR[LGH
9.1     Annual statistics 45
9.2     Trends 45

 3RO\DURPDWLF+\GURFDUERQV 3$+V
10.1    Sampling and analysis 46
10.2    Results 46
10.3    Trends 47

                                                             3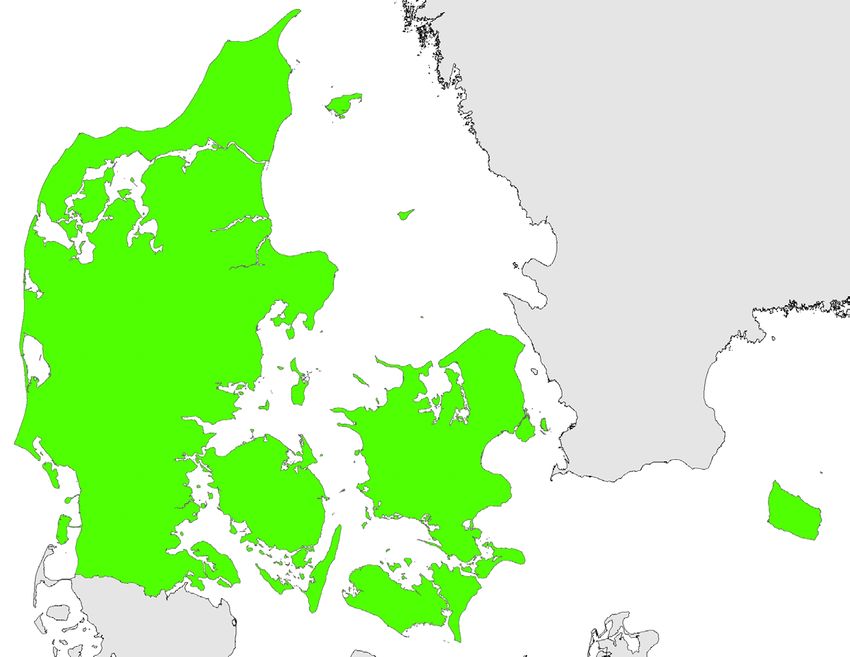
 2UJDQLFFDUERQDQGHOHPHQWDOFDUERQ
    11.1   Annual statistics 48

     2]RQHSUHFXUVRUV
    12.1   Annual statistics 51

     5HIHUHQFHV

    $SSHQGL[
    Pollutants measured in the LMP Network 54

    'DQPDUNV0LOM¡XQGHUV¡JHOVHU

    )DJOLJHUDSSRUWHUIUD'08


4
6XPPDU\DQG&RQFOXVLRQ
This report presents the result of the Danish Air Quality Monitoring
Programme in 2010. The monitoring programme is carried out by the
National Environmental Research Institute (NERI) at University of Aar-
hus. The programme is based on continuous measurements at nine
monitoring stations situated in the four largest cities and two stations in
background areas. These measurements are supplemented with model
calculations using NERI’s air quality models.
The aim of the program is to monitor air pollutants relevant to human
health in accordance with the EU air quality directives. The programme
includes measurements of sulphur dioxide (SO2), nitrogen oxides
(NOx/NO2), particulate mass (PM10 and PM2.5), particle number, benzene
(C6H6), toluene (C7H8), carbon monoxide (CO), ozone (O3), lead (Pb), ar-
senic (As), cadmium (Cd), mercury (Hg), nickel (Ni), and polycyclic aro-
matic hydrocarbons (PAH). In 2009 the programme was expanded with
measurements of a number of volatile organic compounds (VOC’s) that
are precursors for formation of ozone. The measurements and model cal-
culations are used to evaluate the Danish air quality in relation to limit
values as well as to follow trends. Further, the program serves as basis
for determination of sources of the air pollutants, basis for evaluation of
the impact of regulations of emissions and as basis for various research
projects related to air quality.
Due to the revision of the monitoring program there is a number of
changes in the monitoring program and in this years report. The main
changes are the following:
• The two Danish monitoring programs (the Background monitoring
programme aimed at assessing the atmospheric depositions to nature
and the Air quality monitoring program measurements related to
human health) has been integrated into one program with two annual
reports. The first one with focus on air quality and human health and
the second one with focus on air quality and environment. The mate-
rial previously presented in this report on air quality and vegetation
has therefore been moved to the second report.
• The rural monitoring station at Lille Valby was moved about two km
west in June 2010 and is now situated at Risø close to NERI.
• Activities concerning measurements of heavy metals have been re-
duced because the concentrations are low compared to limit values.
Moreover, a new analysis technique has been used for analysis of
heavy metals. It has therefore only been possible to analyse for those
five heavy metals that are included in the EU directives. However, it
is expected that more metals will be included during 2011.
• As a new thing this report presents results from analysis of sodium.
This is in order to be able to correct PM10 for the content of salt from
sea and winter salting of roads.
• Finally, the report presents results from measurements of number of
particles in Copenhagen.
5PM10 were at all the stations below both the annual limit value (40
µg/m3) and the limit value for the 35th highest daily average value for
PM10 (50 µg/m3). PM2.5 was lower than the annual limit value (25 µg/m3)
valid from 2015. The number of particles in ambient air were about 16000
particles per cm3 at the street station H.C. Andersens Boulevard. This is
considerably higher than in urban and rural background. A significant
reduction in particle number has been observed since 2002.
The sodium content in PM10 on street stations were about 1 µg/m3 corre-
sponding to en estimated annual salt content (NaCl) of about 2.6 µg/m3.
High diurnal values of salt above 10 µg/m3 was observed during periods
with salting of roads.
The annual limit value for NO2 (40 µg/m3 in 2010) was exceeded at one
street station in Copenhagen (H.C. Andersens Boulevard), whereas no
exceedances were observed in Odense, Aalborg and Aarhus. The NO2
concentrations generally decreased in 2010. However, at one station in
Copenhagen (1103) an increase was observed. This is believed to be a
temporary effect due to ongoing local construction work at two nearby
sites.
Model calculations at selected streets in Copenhagen and Aalborg indi-
cate that the limit value was exceeded at several streets in Copenhagen
but not in Aalborg in 2010. In general modelling confirmed that the
street station at H.C. Andersens Boulevard (1103) in Copenhagen repre-
sents one of the most polluted streets in Copenhagen, whereas the traffic
station in Aalborg (6153) represents the average level for the 31 selected
streets in Aalborg. Due to new traffic information Sydhavnsgade in Co-
penhagen has now significant higher NO2 concentration as now by far
the most polluted street of the 138 selected streets in Copenhagen. The
model calculations show a tendency for high concentrations on streets
with housing on one side of the street and open space on the other side.
NERI will in 2011 participate in a project with Danish EPA with supple-
mentary measurements in order to examine some of the hot spot situa-
tions in Copenhagen further.
The ozone levels were in 2010 almost the same as in 2009 at all rural and
urban background stations and no clear trend was thus observed. The in-
formation threshold at 180 µg/m3 was exceeded once. The target value
for the max 8 hours ozone concentration on 120 µg/m3 was not ex-
ceeded, but the long-term objective for this target was exceeded at all
non-traffic stations.
The report presents results for volatile organic compounds (VOC) meas-
ured at the urban background in Copenhagen. VOC’s can act as ozone
precursors, although the formation of ozone in Denmark is in general
small due to moderate solar radiation. The ozone pollution in Denmark
is to a large extent caused by long distance transport of pollutants from
other European countries south of Denmark.
The levels of SO2 and heavy metals have decreased for more than two
decades and are now far below the limit values. The limit values for ben-
zene and CO are not exceeded and the levels have decreased for the last
decade.
6Measurements of particle bound PAH concentrations were performed at
H.C. Andersens Boulevard, Copenhagen. The average concentration of
benzo[a]pyrene was 0.34 ng/m3. The target value for benzo[a] pyrene (1
ng/m3) was not exceeded in 2010.
Actual data, annual and multi-annual summaries are available at the
website of NERI
(http://www.dmu.dk/International/Air).
7'DQLVKVXPPDU\'DQVNUHVXPp
Rapporten præsenterer resultater for 2010 fra Overvågningsprogrammet
for luftkvalitet i danske byer. Programmet, som udføres af Danmarks
Miljøundersøgelser (DMU) ved Aarhus Universitet, er baseret på målin-
ger ved ni målestationer placeret i de fire største danske byer samt ved to
baggrundsmålestationer udenfor byerne. Disse målinger kombineres
med anvendelse af modelberegninger med DMU’s luftkvalitetsmodeller.
Formålet med programmet er at overvåge luftforurening af betydning
for sundhed i overensstemmelse med EU’s luftkvalitetsdirektiver. I hen-
hold til disse og øvrige danske behov måles koncentrationer af svovldi-
oxid (SO2), nitrogenoxider (NOx/NO2), partikelmasse (PM10 og PM2.5),
partikel antal, benzen (C6H6) og toluen (C7H8), carbonmonoxid (CO),
ozon (O3), bly (Pb), arsen (As), cadmium (Cd), kviksølv (Hg), nikkel (Ni)
og polyaromatiske kulbrinter (PAH) i luften i danske byer samt udvalgte
flygtige kulbrinter (VOC), der kan føre til dannelse af ozon. Målingerne
og modelberegningerne anvendes til at vurdere om EU’s grænseværdier
for luftkvalitet er overholdt. Rapporten beskriver endvidere udviklingen
i koncentrationerne. Desuden tjener resultaterne som grundlag for vur-
dering af kilderne til luftforureningen, vurdering af effekt af reduktions-
tiltag og som grundlag for en række videnskabelige undersøgelser fx
vurdering af små partiklers effekt på sundheden.
Der er fastsat grænse- og målværdier for flere af de målte stoffer. Græn-
seværdierne skal overholdes fra 2005 eller 2010. Frem til ikrafttrædelses-
tidspunktet er det tilladt at overskride disse grænseværdier indenfor en
fastsat tolerancemargin, som løbende reduceres. En detaljeret beskrivelse
af gældende mål- og grænseværdier og deres gennemførelse findes i en
bekendtgørelse fra Miljøministeriet (Miljøministeriet 2010). Bekendtgø-
relsen er baseret på det 4. datterdirektiv om tungmetaller og PAH (EC
2005) samt det nye luftkvalitetsdirektiv vedtaget i 2008 (EC 2008). En af
de væsentligste ændringer i det nye direktiv i forhold til det tidligere
luftrammedirektiv og de tre første datterdirektiver (EC 1996, 1999, 2000
og 2002) er, at der stilles krav om målinger af de fine partikler (PM2.5), og
at der er indført en grænseværdi for PM2.5, som skal overholdes i 2015.
Overvågningsprogrammet er blevet revideret i 2010 og som følge heraf
er der foretaget en række ændringer i programmet og i dette års rapport.
De væsentligste ændringer er følgende:
• De to danske luftovervågningsprogrammer (Baggrundsovervåg-
ningsprogrammet med fokus på den atmosfæriske afsætning på natur
og vandmiljø samt Luftkvalitetsmoniteringsprogrammet med fokus
på sundhed) er blevet lagt sammen til et samlet overvågningspro-
gram med to årlige rapporter. Den første rapport har fokus på luft-
kvalitet i relation til sundhed og den anden har fokus på luftkvalitet
og miljø. Materiale i relation til luftkvalitet og miljø er derfor flyttet
fra den første rapport over til den anden rapport.
• Landbaggrundsmålestationen ved Lille Valby er blevet flyttet ca. 2
km mod vest i juni 2010 og er nu placeret på Risø tæt ved DMU-AU.
8• Målinger af tungmetaller er blevet reduceret i det reviderede pro-
gram, fordi koncentrationerne er lave i sammenligning med grænse-
værdierne. Endvidere er der taget en ny analyseteknik i brug ved ana-
lyserne for tungmetaller, hvilket har medført at der kun er analyseret
for de fire tungmetaller, som er omfattet af direktiverne. Det forventes
at antallet af tungmetaller vil blive udvidet i 2011.
• Som en ny ting præsenterer rapporten resultater fra analyse af ind-
holdet af natrium i PM10, således at det vil være muligt at korrigere
PM10 for indholdet af hav- og vejsalt.
• Endelig præsenterer rapporten for første gang resultater fra måling af
antallet af luftbårne partikeler i København.
De væsentligste konklusioner fra overvågningsprogrammet i 2010 er føl-
gende:
• I 2010 blev grænseværdien for NO2 overskredet på en (H.C. Ander-
sens Boulevard) af de to gademålestationer i København. I Odense,
Aarhus og Aalborg var der ingen overskridelser. Koncentrationerne
af NO2 faldt generelt fra 2009 til 2010, undtagen på gademålestationen
ved H.C. Andersens Boulevard (1103) i København, hvor en stigning
blev observeret. Stigningen skyldes formentligt en midlertidig på-
virkning fra to større byggerier nær ved målestationen.
• Modelberegninger indikerer, at grænseværdien i 2010 var overskredet
på en række gadestrækninger i København, men ikke på udvalgte
gadestrækninger i Aalborg. Modelberegningerne viste endvidere, at
gademålestationen ved H.C. Andersens Boulevard (1103) i Køben-
havn repræsenterer en af de mest forurenede gader i København,
mens gademålestationen i Aalborg (6153) repræsenterer et middelni-
veau set i forhold til de 31 udvalgte gader i Aalborg. Sydhavnsgade i
København har nu en betydeligt højere koncentration af NO2 end tid-
ligere rapporteret og er nu den gade med de højeste koncentrationer.
Årsagen til dette skift er nye trafikinformationer fra Københavns
Kommune. Modelberegningerne viser en tendens til, at gader med de
højeste koncentrationer af NO2 er gader med såkaldt ensidig bebyg-
gelse – dvs. høje huse på den ene side og ingen bebyggelse på den
anden side. DMU vil i 2011 deltage i et projekt sammen med Miljøsty-
relsen med supplerende målinger af NO2 med det formål at undersø-
ge situationer med meget høje NO2-koncentrationer yderligere.
• I 2010 var der ingen målestationer, hvor grænseværdierne for luftens
indhold af partikler mindre end 10 µm (PM10) blev overskredet.
• Indholdet af partikler mindre end 2.5 µm (PM2.5) overskred ikke de
kommende grænseværdier, som skal overholdes fra 2015.
• Antallet af partikler mellem 6 og 700 nm var omkring 16.000 partikler
per cm3 på gademålestationen H.C. Andersens Boulevard, mens det
var betydeligt mindre i by- og landbaggrund. Antallet af partikler er
faldet betydeligt siden 2002.
• Indholdet af natrium i PM10 på gademålestationerne var omkring 1
µg/m3 svarende til et estimeret saltinhold (NaCl) på omkring 2.6
µg/m3. Høje døgnmiddelværdier på over 10 µg/m3 blev observeret i
perioder med saltning af veje.
9• Der er ikke fastsat egentlige grænseværdier for ozon (O3), men kun
"målværdier" og ”langsigtede mål” (hensigtsværdier). Der var i 2010
ingen overskridelser af målværdierne for beskyttelse af sundhed.
mens de langsigtede mål blev overskredet på alle bybaggrunds- og
landstationerne. Tærsklen for information af befolkningen om høje
ozonniveauer (timemiddel 180 µg/m3) blev overskredet én gang i lø-
bet af sommeren 2010.
• De øvrige målte stoffer findes i koncentrationer under grænseværdi-
erne, og for flere stoffer (fx svovldioxid og bly) er koncentrationerne
faldet betydeligt siden målingernes start.
• Målinger af partikelbundet PAH blev fortaget på H.C. Andersens
Boulevard i København. Middelværdien for benz[a]pyren var 0,34
ng/m3. Målværdien på 1 ng/m3 var således ikke overskredet i 2010.
• For andet år præsenterer rapporten resultater for måling af udvalgte
flygtige organiske kulbrinter (VOC) i bybaggrund i København. Disse
VOC bidrager til den kemiske dannelse af ozon i Europa. I Danmark
skyldes størstedelen af ozon langtransport af luftforurening fra den
sydlige del af Europa.
10 ,QWURGXFWLRQ
The Danish Air Quality Monitoring Programme (LMP) originates back to
1981. Today the programme is part of the National Monitoring Pro-
gramme for the aquatic and terrestrial environment (NOVANA). The
program consists of an urban monitoring network with stations in the
four largest Danish cities and two background stations in rural areas
(figure 2.1) which is supplemented by model calculations. The results are
used for assessment of the air pollution in Denmark with special focus
on Danish urban areas. The programme is carried out in co-operation be-
tween the National Environmental Research Institute at Aarhus Univer-
sity (NERI), the Danish Environmental Protection Agency, the Munici-
palities of Copenhagen, Aarhus, Aalborg and Odense. NERI is responsi-
ble operating and maintaining the programme. Statistical parameters
and actual data are accessible at the website: http://www.dmu.dk/-
International/Air. Selected actual data are also available at tele-text,
Danish National Television. In addition, this report presents results from
model calculations of air quality in Denmark carried out as supplement
to the measurements.
The monitoring programme is carried out in accordance with the Danish
Statutory Order No. 851 of 30 June 2010 from the Ministry of Environ-
ment (Miljøministeriet 2010) that implements the EU directives on air
quality in Denmark. The EU legislation consisted previously of the
framework directive (EC 1996), giving general rules for network design
and limit value strategies, and a number of daughter directives giving
limit values, target values, alert thresholds, reference methods and moni-
toring strategies for specific pollutants. Four daughter directives for
NO2, SO2, particulate matter (PM10) and Pb (EC, 1999), CO and benzene
(EC, 2000), O3 (EC, 2002) and Cr, As, Cd, Hg and PAH (EC, 2005) had
been adopted. In 2008 a new directive (EC, 2008) replaced the framework
directive and the three first daughter directives. This new directive is
now implemented through the Danish statutory order (Miljøministeriet
2010). One of the major changes in the new directive is that monitoring
of PM2.5 is now part of the measurement programme.
One of the main objectives for the monitoring programme is to assess the
air quality in relation to various air quality criteria (i.e. limit values, mar-
gin of tolerance, target values, long term objectives and alert thresholds)
of which the limit values are the legally most important. The Danish
quality criteria’s are identical with those laid down in the EU directives
described above. The limit values had to be attained in 2005 or here from
2010.
The program was revised in 2010. Due to this revision of the monitoring
program there is a number of changes in the monitoring program and in
this years report. The main changes are the following:
• The two Danish monitoring programs (the background monitoring
programme aimed at assessing the atmospheric depositions to nature
and the air quality programme measurements related to human
health) has been integrated into one program with two annual re-
11ports. The first one with focus on air quality and human health and
the second one with focus on air quality and environment. The mate-
rial previously presented in this report on air quality and vegetation
has therefore been moved to the second report.
• The rural monitoring station at Lille Valby was moved about two km
west in June 2010 and is now situated at Risø close to NERI.
• The program concerning measurements of heavy metals has been re-
duced since the concentrations are low compared to limit values.
Moreover, a new analysis technique has been used for analysis of
heavy metals. This limits the amount of metals that could be ana-
lysed. However, it is expected that more metals will be included dur-
ing the next 2011.
• As a new thing this report presents results from analysis of sodium.
This is in order to be able to correct PM10 for the content of salt from
sea and winter salting of roads.
• Finally, the report presents results from measurements of number of
particles in Copenhagen.
In the following chapters the results from measurements and model cal-
culations for 2010 are presented and compared to limit and threshold
values. Please refer to the EU Directives for a detailed description of the
exact definitions of the limit values, margin of tolerance, target values
and alert thresholds.
12 0HDVXUHPHQWVDQGPRGHOFDOFXODWLRQV
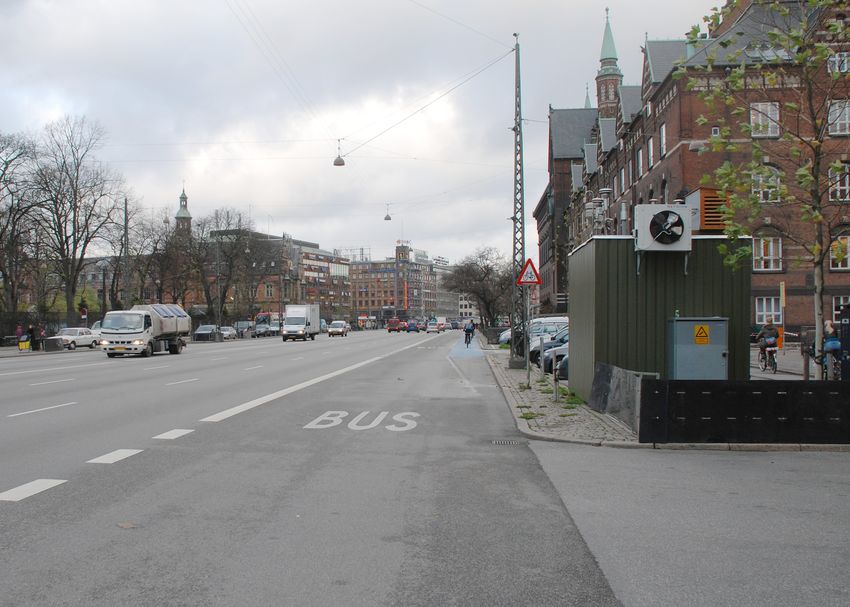
0HDVXUHPHQWV
The measuring strategy is in short to place one or more pairs of stations
in each of the four largest Danish cities. In each city one of the stations is
located close (at the sidewalk) to a street lane with a high traffic density.
The other is located within a few hundred meters from the street station,
and is representative for the urban background pollution; it is not influ-
enced by a single or a few streets or other nearby sources. In most cases
the background stations are placed on rooftops. In addition, two rural
stations monitor the pollution outside city areas. The rural station at Lille
Valby was in the middle of 2010 moved about 2 km west to Risø and is
now situated close to the National Environmental Research Institute.
Further information about the program and results is found at the web-
site: http://www.dmu.dk/International/Air.
Gadestationer
Ålborg Bybaggrund
Århus
København
Lille Valby/Risø
Odense
Keldsnor
)LJXUH1 Main stations used for monitoring of air quality in relation health.
7DEOH Main stations used for monitoring of air quality in relation to health in 2010
1DPH 6WUHHWORFDWLRQ 7\SH
Copenhagen/1257 Jagtvej Street
Copenhagen/1259 H.C. Ørsted Institute (HCØ) Urban background
Copenhagen/1103 H.C. Andersens Boulevard Street
(HCAB)
Århus/6153 Banegårdsgade Street
Århus/6159 Valdemarsgade Urban Background
Odense/9155 Albanigade Street
Odense/9159 Town hall in Odense Urban background
Aalborg/8151 Vesterbro Street
Aalborg/8158 Østerbro Urban background
Lille Valby/Risø - Rural
Keldsnor/9055 - Rural
13The following compounds were measured in 2010:
• Nitrogen oxides (nitrogen monoxid (NO), NO2 and NOx (= NO +
NO2) and particle mass (PM10 and PM2.5) were measured at all sta-
tions. PM was measXUHGE\PHDQVRI -absorption as 24 h averages.
• Elements (heavy metals) in PM were measured at Copenhagen/1103,
Copenhagen/1257, Copenhagen/1259, Århus/6153, Århus/6159 and
Lille Valby/Risø.
• Additionally PM10 was measured at Copenhagen/1103 and Copen-
hagen/1259 by means of TEOM that measures with high time resolu-
tion. PM2.5 was also measured at Copenhagen/1103, Copenha-
gen/1259 and Lille Valby/Risø by means of TEOM. Part of these
measurements was carried out in a research project funded sepa-
rately by the Danish EPA.
• Particle number were measured at Copenhagen/1103, Copenha-
gen/1259 and Lille Valby/Risø in cooperation with particle research
funded separately by the Danish EPA.
• Ozone (O3) was measured at all urban background and rural sta-
tions, and at the street stations Copenhagen/1257 and Copenha-
gen/1103
• Carbon monoxide (CO) was measured at all street stations as well as
at the urban background station, Copenhagen/1259 and the rural site
Lille Valby /Risø.
• Benzene and Toluene were measured at Copenhagen/1103 and Co-
penhagen/1257 using passive sampling on a weekly basis.
• PAH were measured at Copenhagen/1103.
• SO2 was measured at Aalborg/8151 and at Copenhagen/1103. The
main purpose was to monitor episodic high concentrations.
• Elemental carbon (EC) and organic carbon (OC) were measured at
Copenhagen/1103 and Lille Valby/Risø.
• The meteorological parameters - temperature, wind speed and direc-
tion, relative humidity and global radiation - were measured at all
urban background stations.
The pollutants are described in the appendix 1.
Measurements of gasses (NO, NOx, NO2, O3, CO, SO2) and particle
number were recorded as ½-hour averages. Particle mass (PM10 and
PM2.5) were measured both as 24 hour averages using beta measure-
ments and at ½-hour averages using TEOM (only part of particle mass).
Elements in the particles as well as PAH were measured as 24 hour aver-
ages. EC and OC were measured as 24 hour averages. Benzene and Tolu-
ene were measured weekly by passive sampling. Besides this volatile or-
ganic compounds were sampled at 24 hour averages.
Short descriptions of the measured pollutants are given in the appendix.
The actually applied measurement methods are listed at the website:
http://www.dmu.dk/En/Air.
14 0RGHOFDOFXODWLRQV
In LMP the measurements at the permanent measurement stations are
supplemented with model calculations using the Thor modelling system
(Brandt et al., 2000). This is an integrated model system, capable of per-
forming model calculations at regional scale to urban background scale
and further down to individual street canyons in cities – on both sides of
the streets (thor.dmu.dk). At present, the system includes global mete-
orological analyzed data from National Centres for Environmental Pre-
diction, United States, which is used as input to the meteorological
model MM5v3 (Grell et al., 1995). The meteorological data from MM5v3
is subsequently used to drive the air pollution models, including the
Danish Eulerian Hemispheric Model, DEHM (Christensen, 1997; Brandt
et al., 2011), the Urban Background Model, UBM (Berkowicz, 2000b) and
the Operational Street Pollution Model, OSPM (Berkowicz 2000a).
DEHM is providing air pollution input data for UBM which again is
providing air pollution input data to OSPM. Further details about the in-
tegrated THOR system can be found in Brandt et al. (2001 and 2003).
Model calculations of air quality on national scale is carried out using
DEHM (version 5.0), which is an Eulerian model where emissions, at-
mospheric transport, chemical reactions, and dry- and wet depositions of
air pollutants are calculated in a 3D grid covering the northern hemi-
sphere with a resolution of 150 km x 150 km. The model includes a two-
way nesting capability, which makes it possible to obtain higher resolu-
tion over limited areas. Three nested domains are used in LMP, where
the first nest is covering Europe with a resolution of 50 km x 50 km. The
second nest is covering Northern Europe with a resolution of 16.7 km x
16.7 km. The calculations of air quality in Denmark are carried out in a
third nest with a horizontal resolution of 5.6 km x 5.6 km. In the vertical
direction the model is divided into 29 layers covering the lowest 15 km
of the atmosphere. Of these the lowest layers are relatively thin (20 m)
while the upper layers are relatively thick (2000 m). The model includes
a comprehensive chemical scheme designed for calculation of the chemi-
cal reactions in the lower part of the atmosphere. The model calculations
for 2010 are carried out using meteorological data from the meteorologi-
cal model MM5v3 (Grell et al., 1995). The emission inventories used in
DEHM have a geographical resolution of 1 km x 1 km for Denmark
transformed into the 5.5 km x 5.5 km resolution domain and 17 km x 17
km for the remaining part of Europe. The emissions are based on Danish
national emission inventories for the year 2008 made by NERI
(www.dmu.dk) and international emission inventories for the year 2007
collected and distributed by EMEP (www.emep.int).
The Urban Background Model, UBM, calculates the urban background
air pollution based on emission inventories with a spatial resolution of 1
km x 1 km and based on input data from DEHM concerning the regional
background. UBM is suitable for calculations of urban background con-
centrations when the dominating sources are areal sources like road traf-
fic. The model includes a simple scheme for calculation of the dispersion
and transport of the air pollutants and a simple chemical model account-
ing for oxidation of nitrogen monoxide by ozone based on an assump-
tion of photochemical equilibrium on the time scale of the pollution
transport across the city area. The model is described in detail in Berko-
wicz (2000b). The emissions used in the UBM model are based on the
15newly developed SPREAD model that spatially distributes national
emissions from 2008 from all sectors on a 1 km x 1 km grid for Denmark
(Plejdrup & Gyldenkærne 2011). Previous assessments have only in-
cluded road traffic emissions also on a 1 km x 1 km grid for Denmark but
using a bottom up approach based on traffic levels on the road network
and emission factors from the emission module of the OSPM model.
Finally, the street canyon model OSPM (http://ospm.dmu.dk/) is used
to calculate the air pollution at 2 m height at the side walks of selected
streets. Meteorological data from the meteorological model MM5v3 and
air pollution concentrations from UBM are used as input to the model.
The model includes emissions from traffic, simple chemical reactions de-
scribing the reactions of air pollutants in the street canyons and the dis-
persion of the air pollution in the street canyon (due to meteorological
conditions and turbulence induced by traffic).
The traffic emission data used as input for the calculations with OSPM
have been substantially updated for this year’s report by detailed infor-
mation (average daily traffic, vehicle distribution) for the selected streets
obtained from the municipalities of Copenhagen and Aalborg based on a
project on evaluation of the effects of environmental zones (Jensen at al.
2011). Emission factors are based on the latest version of the COPERT IV
model applied for 2010 conditions taking account of the effect of the en-
vironmental zones by means of a detailed analysis of the vehicle compo-
sition using video number plate analysis linked to the National Auto
Registry at a street in Copenhagen, for details see Jensen at al. (2011). The
input data for the OSPM model on traffic volume and street configura-
tions for the selected urban streets are generated using the AirGIS sys-
tem (Jensen et al., 2001; http://airgis.dmu.dk).
The model calculations for 2010 for Copenhagen and Aalborg have been
carried out using the full model calculation system based on the THOR
system, including DEHM, UBM, and OSPM. The calculations were car-
ried out in order to determine the NO2 concentration in 138 streets in
Copenhagen and 31 streets in Aalborg.
16 1LWURJHQR[LGHV
7455 40 200
*) Limit value exceeded.
7DEOH Nitrogen oxides (NOx=NO+NO2) 2010. All parameters are based on hourly
averages.
8QLW
JP DV12 1XPEHU $YHUDJH 0HGLDQ
KLJK
SHUFHQWLOH HVW
7UDIILF
Copenhagen/1257 8028 86 66 287 479
Copenhagen/1103 7405 133 105 416 679
Aarhus/6153 8310 87 67 308 696
Odense/9155 7836 75 43 340 616
Aalborg/8151 7955 104 68 416 587
8UEDQ%DFNJURXQG
Copenhagen/1259 7918 21 16 74 144
Aarhus/6159 8237 34 20 169 472
Odense/9159 8116 24 17 92 282
Aalborg/8158 7869 23 14 109 295
5XUDO
Lille Valby/Risø 7078 12 8 52 105
Keldsnor/9055 8123 9 6 36 67
The limit values are from EU Directive 2008/50/EC (EC, 2008).
17Number of informations to the public due to exceedance of the alert
threshold for NO2 (three hours average 400 µg/m3) in 2010: 0.
7UHQGV
70
NO2 - annual averages
60
50
40
3
µg/m
30
20
10
0
1983 1985 1987 1989 1991 1993 1995 1997 1999 2001 2003 2005 2007 2009
Copenhagen/1103 Copenhagen/1257 Århus/6153
Odense/9155 Aalborg/8151 Copenhagen/1259
Århus/6159 Odense/9159 Ålborg/8159
Lille Valby/2090 Keldsnor/9055
250
NOx - annual averages
200
150
3
µg/m
100
50
0
1992 1994 1996 1998 2000 2002 2004 2006 2008 2010
Copenhagen/1103 Copenhagen/1257 Århus/6153
Odense/9155 Aalborg/8151 Copenhagen/1259
Århus/6159 Odense/9159 Ålborg/8159
Lille Valby/2090 Keldsnor/9055
)LJXUH The graphs show the time series for the annual average values of NO2 and
NOx. The dashed line on the upper graph indicates the limit value that enters into force in
2010. Previous results from Copenhagen/1103 can be found at the homepage of Copen-
hagen Environmental Protection Agency (www.Miljoe.kk.dk)
18Both NO2 and NOx increased in 2010 compared to 2009 at the street sta-
tion H.C. Andersens Boulevard (Copenhagen/1103). At all other stations
the levels were as in 2009 or a slight decrease was observed. The increase
observed at H. C. Andersens Boulevard is believed to be a temporary ef-
fect due to ongoing local construction work at two nearby sites.
5HVXOWVIURPPRGHOFDOFXODWLRQV
Model calculations have been performed for selected streets in
Copenhagen (capital) and Aalborg (fourth largest city) as well as in a
resolution of 5.6 km x 5.6 km for the entire country.
The selected streets represent busy streets and are mainly street canyons.
Concentrations are elevated in this type of streets due to the high
emissions and restricted dispersion conditions. 138 streets were selected
in Copenhagen and 31 in Aalborg. Average Daily Traffic (ADT) was
between 9,200 and 67,000 vehicles/day in Copenhagen and between
2,700 and 29,000 vehicles/day in Aalborg. Based on information from
Copenhagen and Aalborg municipalities the ADT and vehicle
distribution on all streets have been updated compared to last year’s
report. This work was performed within a project on the evaluation of
the effects of environmental zones, see details in Jensen et al. (2011). One
street in Aalborg (Ved Stranden) was omitted from calculations on
request from the Municipality of Aalborg since traffic in 2010 on this
street is not representative for normal conditions due to ongoing
construction affecting traffic at this street.
Model calculations have been carried out in order to determine the
annual concentrations of NO2 to be able to compare with limit values.
The air quality limit value for the annual mean is 40 µg/m3 in 2010. The
number of exceedances is also given.
An interlinked modelling approach has been applied. The Danish
Eulerian Hemispheric Model (DEHM) calculates regional background
concentrations, the Urban Background Model (UBM) calculates the
urban background concentrations based on DEHM data, and the
Operational Street Pollution Model (OSPM) calculates street
concentrations based on UBM data. The emission data for the DEHM
model are based on various international emission inventories, and
emissions for the UBM model are based on the national emission
inventory that has been recalculated for a 1 km x 1 km grid. Road
emissions are based on the COPERT IV emission model. This model is
also integrated into the OSPM model. This year the COPERT emission
data used in OSPM has been updated with the latest emission factors
especially for heavy duty vehicles, resulting in a higher number of
weight classes for trucks and buses, now 19 classes in comparison to 6
classes before. The composition of the vehicle fleet has been updated
according to the database used in the national emission reporting and
detailed video number plate analysis performed on one street in
Copenhagen and linked to information from the National Auto Registry.
Therefore the vehicle composition takes account of the effect of the
environmental zones introduced in Copenhagen and Aalborg (Jensen at
al. 2011).
19The environmental zones have been implemented in Denmark for five
urban areas: the municipalities of Copenhagen, Frederiksberg, Aarhus,
Odense and Aalborg. The environmental zones are implemented in two
stages. Particle filters on diesel-powered heavy-duty vehicles > 3.5 tons
are required for emission standard Euro II and older by September 1,
2008 (stage one) and for Euro III and older by July 1, 2010 (stage two).
The environmental zones came into force in Copenhagen on September
1, 2008 and in Aalborg on February 1, 2009.
Although the environmental zone requirements are not designed to
reduce NOx emissions, they are expected to have an impact on NOx
emissions since some older heavy-duty vehicles are to some extend
replaced with newer vehicles that comply with the Euro IV and V
emission standards.
As part of a project, that evaluates the effects of the environmental zones
on air quality in Denmark, the full effect of the environmental zones
(stage two) has been evaluated for all 5 municipalities for 2010 (Jensen at
al. 2011).
The calculations presented below for Copenhagen and Aalborg for 2010
include the full effect of the regulation (stage two) and are identical with
the results presented in Jensen at al. (2011).
OSPM calculations have been compared to measured NO2
concentrations at street monitoring stations in Copenhagen (Jagtvej and
H.C. Andersens Boulevard) and in Aalborg (Vesterbro). UBM
calculations have been compared to the NO2 measurements at the urban
background monitoring stations in Copenhagen and Aalborg. At all
urban and street stations the model predicts annual NO2 concentrations
within ±20%.
0RGHOFDOFXODWLRQVIRU&RSHQKDJHQ
The annual mean concentrations of NO2 for Copenhagen in 2010 are
shown in Figure 3.2.
In 2010 the limit value for the annual mean concentration was exceeded
in 29 out of the 138 selected streets in Copenhagen (Figure 3.3). In 2009
the number of streets exceeding the limit value plus margin of tolerance
was 48. The average concentration at all streets has been reduced from
2009 to 2010 by about 4 µg/m3. The reasons for the reduction between
2009 and 2010 are the reduction of the NOx emissions due the
introduction of the environmental zone and the normal renewal of the
vehicle fleet with newer less polluting vehicles and the scrapping of
older cars.
Moreover, the number of streets exceeding the limit value is very
sensitive to small changes in concentrations and uncertainties in the
assumptions taken in the emission estimation and model calculations as
can be seen from Figure 3.2.
202010 (incl. environmental zone)
60 Street Urban background
50
Limit value
40
NO2 (µg m-3)
30
20
10
0
1 5 9 13 17 21 25 29 33 37 41 45 49 53 57 61 65 69 73 77 81 85 89 93 97 101 105 109 113 117 121 125 129 133 137
)LJXUHAnnual mean concentrations of NO2 in 2010 for 138 streets in Copenhagen. The contribution from traffic in the street
canyons is based on the street canyon model OSPM. The urban background (dark red colour) is obtained from calculations with
the urban background model UBM with input from the regional scale model DEHM. The value for a street is for the kerb side with
the highest annual mean concentration. The names of the streets can be seen in Table 3.5. Arrows indicate the street segments
with measurement stations.
The streets where the limit value were exceeded all have a daily traffic
intensity of more than about 12,000 vehicles per day. However, it is not
only the traffic intensity alone which determines the concentration of
NO2. Also the width of the streets, the height of the surrounding
buildings, openings in the building façade, the share of heavy-duty
vehicles and orientation of the street have large impact on the
concentration of NO2 in a street.
The names of the 138 streets are given in Table 3.5 and the locations of
the streets together with the annual NO2 concentration levels are shown
in Figure 3.5. It is seen that the spatial distribution of the exceedances of
the limit value is not just concentrated to a few main roads but
distributed throughout the city.
Due to the above mentioned major update of traffic information
provided by the Copenhagen Municipality (Chapter 3.3) the order of the
streets has been changed substantially compared to former years. The
street Sydhavnsgade has replaced Nørre Søgade as the street with the
highest NO2 levels. Both streets are about 20 m wide and have buildings
on only one side of about 18 m height. However, at Nørre Søgade the
traffic input for the model calculations has been reduced by 11% to now
29 000 vehicles per day and the heavy-duty vehicles (HDV) has been
reduced from about 8.3% to 2.9%. The fraction of HDV for Nørre Søgade
was previously assumed to be similar to a standard urban street type
(Type F) but is now based on an assessment of traffic counts. The traffic
volume at Sydhavnsgade has been doubled to now 49 000 vehicles per
day (4.7% HDV) and has most likely been underestimated in previous
years. The Danish EPA has initiated a project scheduled for autumn 2011
that will measure NO2 concentrations using passive samplers at some of
the streets that show very high NO2 levels in the model calculations.
NERI participates in this project.
217DEOH Number and names for the streets that are shown in Figure 3.3 and 3.5. The streets are numbered (1-
138) according to NO2 levels in 2010 (1 = highest, 138 = lowest). The numbers in parenthesis refer to different
segments of the same street that has more than one model calculation. * indicate the street segments with meas-
urement stations.
1XPEHU 6WUHHWQDPH 1XPEHU 6WUHHWQDPH 1XPEHU 6WUHHWQDPH
1 Sydhavnsgade 47 Gammel Køge Landevej(1) 93 Frederikssundsvej(6)
2 H C Andersens Boulevard(3) 48 Strandvejen(3) 94 Tagensvej(1)
3* H C Andersens Boulevard(1) 49 Jyllingevej(2) 95 Amagerbrogade(1)
4 Nørre Søgade 50 Vesterbrogade(3) 96 Rosenørns Alle
5 H C Andersens Boulevard(2) 51 Nordre Fasanvej(3) 97 Englandsvej(1)
6 Ågade 52 Falkoner Alle(2) 98 Vesterfælledvej
7 Lyngbyvej(2) 53 Tagensvej(2) 99 Nørre Voldgade(2)
8 Toftegårds Allé(1) 54 Mimersgade 100 Dag Hammarskjølds Allé
9 Bernstorffsgade(2) 55 Gammel Kongevej(2) 101 Gammel Kongevej(1)
10 Lyngbyvej(3) 56 Frederikssundsvej(1) 102 Slotsherrensvej(2)
11 Gyldenløvesgade 57 Falkoner Alle(1) 103 Frederikssundsvej(4)
12 Holmens Kanal 58 Tietgensgade 104 Nordre Fasanvej(1)
13 Hammerichsgade 59 Jagtvej(3) 105 Strandvejen(2)
14 Stormgade 60 Falkoner Alle(3) 106 Godthåbsvej(3)
15 Toftegårds Allé(2) 61 Østerbrogade(4) 107 Vigerslevvej(1)
16 Bernstorffsgade(1) 62 Nordre Fasanvej(5) 108 Øster Voldgade(2)
17 Tuborgvej(3) 63 Frederikssundsvej(8) 109 Roskildevej(2)
18 Åboulevard(1) 64 Jagtvej(2) 110 Peter Bangs Vej(2)
19 Åboulevard(3) 65 Øster Voldgade(1) 111 Hulgårdsvej(1)
20 Torvegade 66 Grøndals Parkvej 112 Godthåbsvej(1)
21 P Knudsens Gade(1) 67 Nørrebrogade 113 Kalvebod Brygge
22 Borups Alle 68 Nordre Fasanvej(4) 114 Hillerødgade(3)
23 Nørre Voldgade(1) 69 Søndre Fasanvej(2) 115 Hulgårdsvej(2)
24 Jyllingevej(1) 70 Tagensvej(4) 116 Hillerødgade(4)
25 Folehaven(1) 71 Istedgade 117 Rolighedsvej
26 Østerbrogade(3) 72 Nørre Farimagsgade 118 Slotsherrensvej(1)
27 Amagerbrogade(2) 73 Alhambravej 119 Tuborgvej(2)
28 Amagerfælledvej 74 H.C. Ørsteds Vej(2) 120 Frederiksborgvej(1)
29* Jagtvej(1) 75 Søndre Fasanvej(1) 121 Peter Bangs Vej(1)
30 Sallingvej(2) 76 Rebildvej 122 Amagerbrogade(3)
31 Vesterbrogade(2) 77 Østerbrogade(1) 123 Bellahøjvej
32 Frederikssundsvej(3) 78 Smallegade 124 Tuborgvej(1)
33 Tagensvej(3) 79 Folehaven(2) 125 Frederiksborgvej(2)
34 Bredgade 80 Østerbrogade(2) 126 Hillerødgade(1)
35 H.C. Ørsteds Vej(1) 81 Tomsgårdsvej(2) 127 Fredensgade
36 Åboulevard(2) 82 Hareskovvej 128 Ålholmvej(2)
37 P Knudsens Gade(2) 83 Strandvejen(1) 129 Vigerslev Allé
38 Vester Farimagsgade 84 Amager Boulevard 130 Røde Mellemvej(1)
39 Jagtvej(4) 85 Godthåbsvej(2) 131 Ålholmvej(1)
40 Vester Voldgade 86 Bülowsvej(2) 132 Gammel Køge Landevej(2)
41 Folke Bernadottes Allé 87 Bülowsvej(1) 133 Roskildevej(1)
42 Vesterbrogade(1) 88 Sallingvej(1) 134 Artillerivej
43 Tomsgårdsvej(1) 89 Frederikssundsvej(2) 135 Røde Mellemvej(2)
44 Øster Søgade 90 Vigerslevvej(2) 136 Tagensvej(5)
45 Frederikssundsvej(5) 91 Frederikssundsvej(7) 137 Englandsvej(2)
46 Gothersgade(1) 92 Nordre Fasanvej(2) 138 Strandvænget(2)
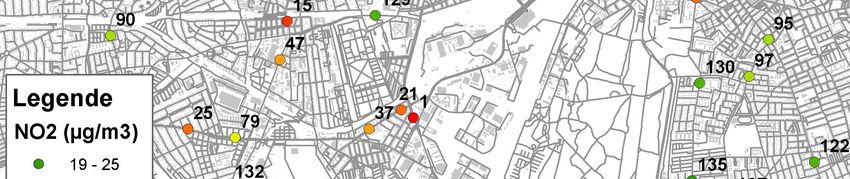
22)LJXUH Map showing the locations of the selected streets in Copenhagen and the annual mean concentra-
tions of NO2 for 2010. The contribution from traffic in the street canyons is based on the street canyon model
OSPM. The urban background is obtained from calculations with the urban background model UBM with input
from the regional scale model DEHM. The value for a street is for the kerb side with the highest annual mean
concentration. The names and numbers for the streets are shown in Table 3.5.
23 0RGHOFDOFXODWLRQVIRU$DOERUJ
For Aalborg the model calculations show in general a reduction in the
NO2 concentrations compared with 2009 for the same reasons given for
Copenhagen in the previous section. The average NO2 concentration was
about 4 µg/m3 lower in 2010 than in 2009.
According to the model calculations the limit value for the annual mean
concentration in 2010 was not exceeded at any of the 31 selected streets
compared to 4 exceedances in 2009 (Figure 3.5 and Figure 3.6).
One street in Aalborg (Ved Stranden) was removed from the calculation
streets on request from the Municipality of Aalborg since traffic on this
street is not representative for normal conditions due to construction
affecting traffic at this street.
45
2010 (incl. enivironmental zone) Limit value
40
35 Street Urban background
30
NO2 (µg m-3 )
25
20
15
10
5
0
l.
ej
de
de
j
de
e
e
j
j
e
2
1
en
ej
n
o
2
1
e
ro
j
v
de
de
e
e
le
e
de
ve
ve
2
1
ve
P
d
ad
ad
or
de
br
sv
d
ad
d
dv
Ke tetv
n
ind ej en
de
de
Al
rb
o
ga
ga
o
ga
ej
ga
ga
ga
ys
a
ga
ro
ga
nd
se
je
yt
er
lm
sg
br
br
sg
ar
rg
og
te
sv
ste
ga
ga
e
ks
gs
ps
ve
ob
ns
ed
ro
N
er
ds
su
an
nd
er
as
er
er
ev
str
is
ste
nd
ho
nd
v
br
se
ar
ns
ns
rb
rg
ru
Ø
se
ro
nd
H
nd
st
nn
Th
st
st
år
K
ad
Sk
Sø
ul
nd
Ø
ll a
er
lla
el
Ø
m
ste
av
av
Ve
Bo
le
eb
Ve
Ve
in
ng
ra
ra
Bo
H
st
Jy
æ
an
el
Li
Pr
yh
nn
yh
St
St
Ø
Vi
Ve
Kj
Sj
F.
D
rb
N
N
Da
J.
Fo
)LJXUHAnnual mean concentrations of NO2 in 2010 for 31 streets in Aalborg. The contribution from traffic in the street canyons
is based on the street canyon model OSPM. The urban background (dark red colour) is obtained from calculations with the urban
background model UBM with input from the regional scale model DEHM. The value for a street is for the kerb side with the highest
annual mean concentration. Arrow indicate street segment with measurement station.
24)LJXUHMap showing the location of the selected streets in Aalborg and the annual mean
concentrations of NO2 for 2010. The contribution from traffic in the street canyons is based on
the street canyon model OSPM. The urban background is obtained from calculations with the
urban background model UBM with input from the regional scale model DEHM. The value for
a street is for the kerb side with the highest annual mean concentration. Vesterbro 1 is the
street segment with the measurement station.
25 2]RQH
$QQXDOVWDWLVWLFV
7DEOH2zone (O3) 2010. All parameters are based on one-hour average values. The eight hour values are calcu-
lated as a moving average based on hourly measurements. Days above target value is the number of days that the
maximum running eight hour average exceeds 120 µg/m3.
8QLW
JP 1XPEHURI $YHUDJH 0HGLDQ 0D[ 'D\VDERYH 0D[
UHVXOWV WDUJHWYDOXH
KRXUV KRXUV KRXU
8UEDQ%DFNJURXQG
Copenhagen/1259 7790 56 57 148 5 173
Århus/6159 8105 50 52 140 2 151
Odense/9159 7769 49 50 123 1 164
Aalborg/8158 7588 54 56 137 2 154
5XUDO
Lille Valby/2090-Risø 1 7494 57 60 120 0 129
Keldsnor/9055 7851 60 61 147 6 171
7UDIILF
Copenhagen/1257 7594 40 39 116 0 136
Copenhagen/1103 7038 33 31 105 2 127
Target value >7154 - - - 25 -
Long term objective >7154 - - 120 - -
1. Lille Valby/Risø was closed down during part of the summer period due to the movement of the station
The maximum 8 hours daily mean value must not exceed 120 µg/m3
more than 25 days per calendar year averaged over three years. This tar-
get value was not exceeded for 2008-2010 at any of the stations.
The target values and long term objectives are given in the EU Directive
2008/50/EC (EC, 2008).
Number of information to the public due to exceedance of the informa-
tion threshold (180 µg/m3) in 2010: 1 at the rural background station Ul-
borg.
Number of information to the public due to exceedance of the alert
threshold (240 µg/m3) in 2010: 0.
26 7UHQGV
90
80 O3 - annual average
70
60
50
3
µg/m
40
30
20
10
0
1992 1994 1996 1998 2000 2002 2004 2006 2008 2010
Copenhagen/1103 Copenhagen/1257 Copenhagen/1259
Århus/6159 Ålborg/8159 Odense/9159
Lille Valby/2090 Keldsnor/9055
250
O3 - max 8 h. average
200
150
3
µg/m
100
50
0
1992 1994 1996 1998 2000 2002 2004 2006 2008 2010
Copenhagen/1103 Copenhagen/1257 Copenhagen/1259
Århus/6159 Ålborg/8159 Odense/9159
Lille Valby/2090 Keldsnor/9055
)LJXUH Annual average values and the max. 8 hour average value. The latter is calcu-
lated as hourly 8 hour running averages according to the provisions in the EU Directive
(EC, 2008). Previous results from Copenhagen/1103 can be found at the Website of the
Copenhagen Environmental Protection Agency (www. Miljoe.kk.dk).
27 5HVXOWVIURPPRGHOFDOFXODWLRQV
The target value for protection of human health is that the running 8
hour means concentration of ozone must not exceed 120 µg/m3 more
than 25 times during a calendar year. The long term objectives are that
the running 8 hour mean concentration of ozone must not exceed 120
µg/m3. The target value and long term objective are given in the EU Di-
rective (EC, 2008). Results from the model calculations for 2010 show
that the maximum daily 8 hour mean value was only exceeded 120
µg/m3 up 5 days during 2010 (Figure 4.3). Similar results were obtained
for 2008 and 2009 and hence the target value was not exceeded. How-
ever, the long term objective was exceeded at several places in Denmark;
mainly in the coastal areas (Figure 4.4).
According to the directive (EC, 2008) the public has to be informed if the
one hour average concentration exceeds the information threshold at 180
µg/m3. Based on measurements this threshold was exceeded one time in
2010 in western Jutland. The model calculations show that the one hour
mean concentration did not exceed 180 µg/m3 in 2010 (Figure 4.5). How-
ever, the model results are 10-20% lower than the measurements. The
reason for this discrepancy is most likely that the model does not include
emissions of ozone precursors from wild fires. Large wild fires are
known to increase episodic ozone concentrations. Work has been initi-
ated to include emissions from wild fires in the model. Inclusion of emis-
sions of wild fires in the model calculations may increase the area where
the long term objective for ozone was exceeded in 2010.
)LJXUH Annual mean concentrations of O3 (µg/m3) for 2010 calculated using DEHM.
The figure shows the average concentrations for the 6 km x 6 km grit cells used in the
model
28)LJXUH Number of exceedances of 120 µg/m3 for 8-hour running mean concentra-
tions of ozone in 2010. The calculations were carried out using DEHM.
)LJXUH Maximum 8 hour running mean concentration (µg/m3) of ozone in 2010
calculated using DEHM.
29)LJXUH Maximum one hour mean concentration of ozone (µg/m3) in 2010 calcu-
lated using DEHM
30 &DUERQPRQR[LGH
$QQXDOVWDWLVWLFV
7DEOH Annual statistics for carbon monoxide (CO) in 2010. All parameters are based on hourly average. The 8-
hour values are calculated as a moving average based on hourly results.
8QLW
JP 1XPEHU $YHUDJH 0HGLDQ
0D[ 0D[KRXU
SHUFHQWLOH SHUFHQWLOH KRXUV
7UDIILF
Copenhagen/1257 7875 481 420 1242 1954 1642 2935
Copenhagen/1103 7596 510 463 1145 1638 1485 3194
Århus/6153 8066 406 356 966 1694 1843 2604
Odense/9155 7764 475 358 1535 2777 2576 4278
Aalborg/8151 7772 514 441 1275 1881 1515 2164
8UEDQ%DFNJURXQG
Copenhagen/1259 7782 297 279 594 977 919 1105
5XUDO
Lille Valby/2090-Risø 7176 262 240 569 844 788 929
EU Limit value - - - - - 10 000 -
WHO Guideline values - - - - - 10 000 30 000
The limit value is based on EU Directive 2008/50/EC (EC, 2008).
The guideline values are proposed by WHO (2000).
31 7UHQGV
1800
1600 CO - annual averages
1400
1200
1000
µg/m3 800
600
400
200
0
1994 1996 1998 2000 2002 2004 2006 2008 2010
Copenhagen/1103 Copenhagen/1257 Copenhagen/1259
Aahus/6153 Odense/9155 Aalborg/8151
Lille Valby-Risø
10000
9000 CO - annual 8 h max
8000
7000
6000
3
µg/m
5000
4000
3000
2000
1000
0
1994 1996 1998 2000 2002 2004 2006 2008 2010
Copenhagen/1103 Copenhagen/1257 Copenhagen/1259
Aahus/6153 Odense/9155 Aalborg/8151
Lille Valby-Risø
)LJXUH Annual average values and highest 8-hour value calculated based on an
hourly moving average. Previous results from Copenhagen/1103 can be found at the
website of the Copenhagen Environmental Protection Agency (www.Miljoe.kk.dk).
32You can also read