The dash from gas. Could demand in New South Wales fall to half?
←
→
Page content transcription
If your browser does not render page correctly, please read the page content below
The
dash
from
gas.
Could
demand
in
New
South
Wales
fall
to
half?
January
2015
-‐
Rev
0
Tim
Forcey
-‐
Energy
Advisor,
Melbourne
Energy
Institute
Mike
Sandiford
-‐
Director,
Melbourne
Energy
Institute
Table
of
Contents
1.
Summary
..............................................................................................................................
4
2.
Historical
New
South
Wales
gas
demand
..............................................................................
7
Historical
NSW
gas
demand
in
the
electricity
generation
sector
...................................................
9
Historical
NSW
gas
demand
in
the
manufacturing
sector
............................................................
10
Historical
NSW
gas
demand
in
the
buildings
sector
.....................................................................
11
Water
heating
..........................................................................................................................................
12
Space
heating
...........................................................................................................................................
13
3.
Historical
gas
supply
to
NSW
..............................................................................................
14
4.
Gas
exports
will
greatly
exceed
domestic
use
.....................................................................
15
5.
Higher
domestic
prices
and
consumer
concerns
..................................................................
16
6.
A
scenario
of
declining
NSW
fossil
gas
demand
...................................................................
17
Future
NSW
gas
use
for
electricity
generation
............................................................................
18
Future
NSW
gas
use
in
manufacturing
.........................................................................................
19
Reduced
manufacturing
output
...............................................................................................................
20
Fuel-‐switching
in
manufacturing
.............................................................................................................
20
Energy
efficiency
measures
in
manufacturing
.........................................................................................
21
Overall
......................................................................................................................................................
21
Future
NSW
gas
use
in
residential
and
commercial
buildings
.....................................................
22
Fuel-‐switching
in
buildings
.......................................................................................................................
23
Energy
efficiency
in
buildings
...................................................................................................................
24
Consumer
behavioural
responses
............................................................................................................
24
Warmer
winter
temperatures
.................................................................................................................
24
The
possibility
that
a
gas
death
spiral
shrinks
the
customer
base
in
NSW
..............................................
25
Electricity-‐only
retailers
actively
promoting
fuel-‐switching
from
gas
......................................................
25
7.
Biogas
and
gas-‐from-‐waste
.................................................................................................
25
8.
Existing
gas
supply
capacity
is
adequate
to
meet
peak
demand
..........................................
26
9.
Policies
to
ease
the
transition
to
higher
gas
prices
..............................................................
27
10.
References
.......................................................................................................................
28
Melbourne
Energy
Institute
2
McCoy
Building,
School
of
Earth
Sciences,
University
of
Melbourne,
Victoria
3010,
Australia
T:
+61
3
8344
3519
F:
+61
3
8344
7761
E:
info-‐mei@unimelb.edu.au
W:
www.energy.unimelb.edu.au

About the University of Melbourne Energy Institute (MEI) The University of Melbourne Energy Institute is an access point for industry, government and community groups seeking to work with leading researchers on innovative solutions in the following areas: new energy resources; developing new ways to harness renewable energy; more efficient ways to use energy; securing energy waste; and framing optimal laws and regulation to achieve energy outcomes. Acknowledgement The University of Melbourne Energy Institute acknowledges The Australia Institute (TAI) for their support of this research. Melbourne Energy Institute 3 McCoy Building, School of Earth Sciences, University of Melbourne, Victoria 3010, Australia T: +61 3 8344 3519 F: +61 3 8344 7761 E: info-‐mei@unimelb.edu.au W: www.energy.unimelb.edu.au
1. Summary Gas transmission and distribution costs often make up the largest part of a consumer’s gas supply bill [1]. Investments in gas supply infrastructure are based on estimates of future demand. If demand is overestimated, unnecessary infrastructure is built. Such poor investment decisions drive up the costs that small and large gas consumers must pay. Recent unprecedented electricity price increases in New South Wales (NSW) were partly due to overinvestment in network infrastructure that, in turn, was partly a result of year-‐after-‐year overestimation of electricity demand by the responsible planning bodies. A present danger is that future gas demand in NSW is now likewise being overestimated. Rather than continuously growing over the next ten years, there are many reasons why NSW gas demand will decline. Wholesale gas prices in eastern Australia are forecast to increase at an unprecedented pace – doubling and even tripling -‐ as a result of imminent coal seam gas exports to Asia from Gladstone, Queensland. Rising gas prices will dampen domestic gas demand across NSW and the other eastern states. Other factors will act in concert with rising gas prices to drive down gas demand. These include the carbon price repeal, ongoing energy efficiency schemes, environmental conservation efforts, warmer winter temperatures, technological advances, and the falling costs of alternatives to gas. With respect to gas supply, NSW is situated in the middle of the interconnected eastern Australian domestic gas market. Since the mid 1970’s, gas for NSW has largely been supplied via pipeline from the neighbouring states of South Australia and Victoria. More recently, significant quantities of recoverable coal seam gas have been identified within NSW itself. However, some farming and community groups are concerned about the impacts and risks posed by this industry. The NSW state government has responded to the changing eastern Australian gas landscape by revising coal seam gas production regulations. The NSW state government and parliament are investigating how rising gas prices will impact consumers. Melbourne Energy Institute 4 McCoy Building, School of Earth Sciences, University of Melbourne, Victoria 3010, Australia T: +61 3 8344 3519 F: +61 3 8344 7761 E: info-‐mei@unimelb.edu.au W: www.energy.unimelb.edu.au
In
order
to
inform
this
important
issue,
the
University
of
Melbourne
Energy
Institute
(MEI)
has
developed
a
plausible
scenario
that
captures
the
effect
of
downward
pressures
on
NSW
gas
demand.
In
this
scenario
over
the
next
ten
years
(Figure
1),
NSW
annual
gas
demand
declines
to
approximately
half
of
the
level
seen
in
recent
years.
This
scenario
contrasts
with
forecasts
such
as
those
published
by
the
Australian
Energy
Market
Operator
(AEMO)
that
suggest
there
will
be
little
change
in
NSW
gas
demand
(the
dashed
line
on
Figure
1).1
The
MEI
scenario
examines
each
gas
demand
sector.
The
amount
of
gas
used
for
electricity
generation
is
at
particular
risk
of
falling
dramatically
because
of
rising
gas
prices,
falling
electricity
demand,
and
the
carbon
price
repeal.
In
other
demand
sectors,
energy
efficiency
strategies
used
in
recent
years
to
reduce
electricity
demand
are
re-‐directed
toward
reducing
gas
use.
In
this
scenario,
cheaper
fuels
and
alternatives
to
gas
are
used,
such
as
electric
air-‐source
heat
pumps
that
heat
water
and
building
spaces.
160
140
NSW
gas
demand
(petajoules
per
year)
120
100
Fossil
gas
used
in
electricity
80
generadon
Fossil
gas
used
in
homes
and
60
commercial
buildings
Fossil
gas
used
in
manufacturing
and
40
other
minor
uses
Forecast
derived
from
the
Australian
20
Energy
Market
Operator
0
Australian
financial
year
ending
30
June
Figure
1:
NSW
declining
annual
fossil
gas
demand
scenario
(MEI)
1
We
adjusted
AEMO’s
2013
National
Gas
Forecast
to
account
for
the
use
of
financial
years
versus
calendar
years
and
other
bases
differences
that
exist
between
AEMO
and
the
Australian
Government’s
Bureau
of
Resources
and
Energy
Economics.
Melbourne
Energy
Institute
5
McCoy
Building,
School
of
Earth
Sciences,
University
of
Melbourne,
Victoria
3010,
Australia
T:
+61
3
8344
3519
F:
+61
3
8344
7761
E:
info-‐mei@unimelb.edu.au
W:
www.energy.unimelb.edu.au
MEI
also
investigated
how
declining
gas
demand
eases
the
challenge
of
meeting
consumer
needs
on
peak
winter
days.
In
its
2013
Gas
Statement
of
Opportunities,
AEMO
identified
that
winter
daily
supply
shortfalls
starting
in
2018
could
occur
if
all
of
the
following
conditions
prevail:
• daily
winter
gas
demand
rises
above
0.41
petajoules
per
day
• most
South
Australian
gas
is
diverted
to
Queensland
for
export
LNG
production
• no
significant
new
gas
supply
or
storage
infrastructure
is
built
and
• contractual
peak-‐daily
supply
mechanisms
are
not
employed.
In
the
MEI
scenario,
peak-‐daily
winter
gas
demand
in
2018
and
later
years
can
be
adequately
supplied
from
existing
gas
sources
and
supply
pipelines.
Importantly,
no
expansion
of
gas
supply
infrastructure
is
needed
in
this
scenario
because
no
supply
shortfall
appears.
(Figure
2)
AEMO
demand
forecast
0.70
AEMO
supply
concern
threshold
Gas
supply
or
demand
(petajoules
per
day)
MEI
scenario
0.60
0.50
0.40
0.30
0.20
0.10
0.00
Figure
2:
MEI
scenario
for
NSW
2018
gas
supply
/
demand,
compared
with
AEMO
forecast
Melbourne
Energy
Institute
6
McCoy
Building,
School
of
Earth
Sciences,
University
of
Melbourne,
Victoria
3010,
Australia
T:
+61
3
8344
3519
F:
+61
3
8344
7761
E:
info-‐mei@unimelb.edu.au
W:
www.energy.unimelb.edu.au
The
Australian
Government,
the
New
South
Wales
Government,
and
NSW
local
councils
can
pursue
policies
to
ease
the
transition
to
higher
gas
prices.
These
include
policies
that
would:
• act
on
recommendations
such
as
those
documented
by
the
Alternative
Technology
Association
with
respect
to
residential
fuel-‐switching
from
gas
to
electricity
• remove
subsidies
that
encourage
uneconomic
use
of
gas
where
other
options
exist
such
as
using
efficient
electrically-‐powered
appliances
• remove
subsidies
that
encourage
uneconomic
expansion
of
the
gas
grid
• inform
gas
consumers
of
the
potential
advantages
of
switching
to
other
fuel
sources
and
of
applying
energy
efficiency
measures
• strengthen
the
regulatory
oversight
of
the
sometimes-‐misleading
marketing
of
gas
and
gas
appliances
• facilitate
identification
and
financing
of
economic
fuel-‐switching
and
energy
efficiency
projects
• reduce
infrastructure
costs
by
rationalising
the
gas
grid
where
economically
advisable.
2. Historical
New
South
Wales
gas
demand
For
many
years,
eastern
Australian
consumers
have
been
able
to
purchase
some
of
the
lowest-‐cost
fossil
gas
in
the
developed
world
[2]
and
gas
has
found
many
uses.
Figure
3
illustrates
historical
NSW
gas
use
by
sector
for
the
Australian
financial
year
ending
30
June
2013
(FY
2012-‐13).
The
largest
use
of
gas
is
for
manufacturing.
In
residential
and
commercial
buildings,
gas
is
used
along
with
electricity,
roof-‐top
solar
thermal,
and
wood
for
space
heating,
water
heating,
and
cooking.
Gas
is
also
used
for
electricity
generation
[3].
Gas
used
in
manufacturing
Gas
used
in
homes
and
commercial
buildings
Gas
used
in
electricity
generadon
Other
minor
gas
use
Figure
3:
2012-‐13
NSW
gas
use
by
sector
(MEI)
Melbourne
Energy
Institute
7
McCoy
Building,
School
of
Earth
Sciences,
University
of
Melbourne,
Victoria
3010,
Australia
T:
+61
3
8344
3519
F:
+61
3
8344
7761
E:
info-‐mei@unimelb.edu.au
W:
www.energy.unimelb.edu.au
Figure
4
shows
historical
NSW
gas
use
by
sector
from
FY
2000-‐01
to
FY
2012-‐13
[3].
Over
that
period,
gas
demand
in
the
manufacturing
sector
declined
by
16%.
Moving
in
the
other
direction,
gas
demand
in
the
buildings
sector
increased
by
18%
while
gas
for
electricity
generation
more
than
doubled,
rising
in
particular
since
2008-‐09.
Historical
gas
demand
in
each
of
these
sectors
is
discussed
in
more
detail
below.
150
Gas
used
in
NSW
gas
demand
(petajoules
per
year)
125
electricity
generadon
100
Gas
used
in
homes
and
commercial
75
buildings
Gas
used
in
manufacturing
50
25
Other
minor
gas
uses
0
Australian
financial
year
ending
30
June
Figure
4:
Historical
NSW
gas
use
by
sector
(MEI)
Melbourne
Energy
Institute
8
McCoy
Building,
School
of
Earth
Sciences,
University
of
Melbourne,
Victoria
3010,
Australia
T:
+61
3
8344
3519
F:
+61
3
8344
7761
E:
info-‐mei@unimelb.edu.au
W:
www.energy.unimelb.edu.au
Historical
NSW
gas
demand
in
the
electricity
generation
sector
The
most
significant
change
shown
in
Figure
4
occurred
in
the
electricity
generation
sector.
Over
the
last
six
years,
the
amount
of
gas
used
for
electricity
generation
in
NSW
grew
significantly
as
gas-‐fired
electricity
generation
capacity
expanded
from
220
MW
to
2,000
MW
[4].
Gas
use
quadrupled
over
just
two
years
from
FY
2007-‐08
to
FY
2009-‐10.
These
gas-‐fired
electricity
generation
investments
were
driven
by
factors
such
as:
• the
experience
of
near-‐shortfalls
of
electricity
supply
(and
therefore
high
National
Electricity
Market
prices)
due
to
a
decade-‐long
drought
that
reduced
the
output
of
hydro
and
coal
generators,
• the
expectation
that
annual
electricity
demand
would
continuously
rise
with
population
and
economic
growth,
• the
expectation
that
peak
electricity
demand
would
increase
each
year
with
population
and
economic
growth
and
ongoing
summer
heat
waves,
• the
assumption
that
low-‐cost
gas
would
be
widely
available,
• the
anticipation
of
climate-‐policy
that
would
favour
gas-‐fired
electricity
generation
over
coal.
However,
even
with
these
investments,
electricity
generated
by
burning
gas
has
accounted
for,
at
most,
only
7%
of
all
the
electricity
generated
in
NSW
(FY
2012-‐13).
Black
coal
remains
the
dominant
fuel
for
electricity
generation
in
that
state
[3,4].
Melbourne
Energy
Institute
9
McCoy
Building,
School
of
Earth
Sciences,
University
of
Melbourne,
Victoria
3010,
Australia
T:
+61
3
8344
3519
F:
+61
3
8344
7761
E:
info-‐mei@unimelb.edu.au
W:
www.energy.unimelb.edu.au
Historical
NSW
gas
demand
in
the
manufacturing
sector
Figure
5
shows
the
amount
of
gas
used
in
NSW
for
manufacturing
from
FY
2000-‐01
to
FY
2012-‐13.
This
data
is
derived
from
energy
statistics
provided
by
the
Australian
government2
[3].
Most
gas
used
in
NSW
for
manufacturing
is
burned
to
produce
process
heat
at
a
range
of
temperature
levels
(see
Section
6),
with
one
main
exception:
the
primary
component
of
fossil
gas,
methane,3
is
used
for
chemical
feedstock
by
Orica
at
Kooragang
Island
to
make
ammonia
[5].
This
methane
feedstock
volume
of
seven
petajoules/yr,
shown
separately
in
black
on
Figure
5,
makes
up
approximately
11%
of
all
gas
used
in
manufacturing,
but
just
5%
of
the
all
gas
used
in
NSW.
Overall,
gas
used
in
NSW
manufacturing
has
declined
by
16%
over
the
twelve-‐year
period
from
FY
2000-‐01
to
FY
2012-‐13
(an
average
decline
rate
of
1.3%/yr).
ClimateWorks
describes
typical
Australian
industrial
energy
efficiency
improvements
of
1%/yr
[6].
The
potential
for
further
demand
reduction
in
this
sector
is
described
in
Section
6.
80
Chemicals,
oil
refining,
iron,
NSW
manufacturing
gas
demand
(petajoules
per
year)
70
steel,
and
other
metals
60
Non-‐metallic
mineral
mfg
(e.g.
50
glass,
cement,
ceramics)
40
Food,
beverage,
tobacco
30
20
Texdle,
footwear,
machinery,
10
equipment,
furniture
0
Methane
for
chemical
feedstock
Australian
financial
year
ending
30
June
Figure
5:
Historical
NSW
gas
use
for
manufacturing
(MEI)
2
Some
breakdown
of
demand
within
the
manufacturing
sector
is
provided
by
the
Australian
government,
but
for
reasons
of
business
commercial
confidentiality,
the
gas
used
by
the
largest
consumers
must
be
aggregated
into
the
category
named
“Chemicals,
oil
refining,
iron,
steel,
and
other
metals”.
3
Chemical
feedstock
used
by
Qenos
at
Botany
in
the
manufacture
of
plastics
is
predominantly
made
from
the
conventional
fossil
gas
component
ethane.
This
is
delivered
via
a
separate
pipeline
from
Moomba,
South
Australia
[7].
This
separate
specialty
chemical
feedstock,
with
a
volume
of
14
PJ/yr,
has
been
excluded
from
all
figures
presented
in
this
paper.
Melbourne
Energy
Institute
10
McCoy
Building,
School
of
Earth
Sciences,
University
of
Melbourne,
Victoria
3010,
Australia
T:
+61
3
8344
3519
F:
+61
3
8344
7761
E:
info-‐mei@unimelb.edu.au
W:
www.energy.unimelb.edu.au
Historical
NSW
gas
demand
in
the
buildings
sector
Gas
is
used
in
NSW
buildings,
along
with
electricity,
roof-‐top
solar
thermal
and
wood,
for
space
heating,
water
heating,
and
cooking.
Figure
6
shows
gas
use
in
NSW
commercial
and
residential
buildings
from
FY
2000-‐01
to
FY
2012-‐13
(derived
from
[3]).
Gas
demand
in
the
combined
buildings
sector
increased
by
18%
over
that
full
period,
with
most
of
this
growth
occurring
just
since
FY
2007-‐08.
This
growth
may
be
explained
by:
• population
and
economic
growth,
• rising
affluence,
• anxiety
about
rising
electricity
prices
and
consequent
fuel-‐switching
from
electricity
to
gas,
• views
that
gas
may
have
better
environmental
outcomes
than
coal-‐based
electricity,
• government
incentives,
• active
and
sometimes
misleading
promotion
of
gas
use
in
buildings
by
the
gas
industry
[8].
Despite
the
above,
Core
Energy
cites
data
from
Jemena
that
indicates
new
dwellings
in
NSW
use
significantly
less
gas
than
the
existing
residential
average
[9].
40
NSW
gas
demand
for
buildings
(petajoules
per
year)
Gas
used
in
35
commercial
buildings
30
Residendal
cooking
25
Residendal
20
water
headng
15
Residendal
space
headng
10
Residendal
5
other
0
Australian
financial
year
ending
30
June
Figure
6:
Historical
NSW
gas
use
in
residential
and
commercial
buildings
(MEI)
Melbourne
Energy
Institute
11
McCoy
Building,
School
of
Earth
Sciences,
University
of
Melbourne,
Victoria
3010,
Australia
T:
+61
3
8344
3519
F:
+61
3
8344
7761
E:
info-‐mei@unimelb.edu.au
W:
www.energy.unimelb.edu.au
Water
heating
The
largest
sub-‐category
of
demand
shown
in
Figure
6
is
gas
used
for
water
heating.
In
NSW,
the
types
of
water
heaters
commonly
employed
include:
• gas,
• electric-‐resistive,
• electric
air-‐source
heat
pump,
• roof-‐top
solar
thermal
(boosted
by
gas
or
electricity).
Approximately
40%
of
residential
water
heaters
in
NSW
are
mainly
fuelled
by
gas
[10].
Electric
air-‐source
heat
pump
hot
water
heaters
have
been
available
in
Australia
for
many
years,
yet
many
consumers
and
other
stakeholders
are
unfamiliar
with
their
operation
and
economics.
As
far
back
in
time
as
2006,
15%
of
new
houses
in
NSW
were
being
fitted
with
air-‐source
heat
pump
hot
water
systems
[11].
As
reported
by
the
NSW
state
government,
air-‐source
heat
pump
water
heaters…
“…are
highly
efficient,
using
around
70
per
cent
less
electricity
than
other
electric
water
heaters.
They
work
by
extracting
heat
from
the
atmosphere
using
a
refrigerant
gas
and
a
compressor
(similar
to
a
fridge)
to
warm
up
water
stored
in
a
tank
at
ground
level.”
[12]
Throughout
Australia,
air-‐source
heat
pump
water
heaters
have
represented
up
to
10%
of
total
water
heater
sales;
however,
with
a
reduction
of
some
government
incentives,
sales
have
fallen
[13].
As
is
the
case
for
solar-‐thermal
water
heaters,
air-‐source
heat
pump
hot
water
heaters
remain
eligible
for
small-‐scale
renewable
energy
technology
certificates
(STCs)
[14].
Melbourne
Energy
Institute
12
McCoy
Building,
School
of
Earth
Sciences,
University
of
Melbourne,
Victoria
3010,
Australia
T:
+61
3
8344
3519
F:
+61
3
8344
7761
E:
info-‐mei@unimelb.edu.au
W:
www.energy.unimelb.edu.au
Space
heating
Figure
7
illustrates
the
penetration
of
the
various
types
of
space-‐heaters
used
in
residential
buildings
[9].
(Note
that
the
percentages
shown
on
Figure
7
sum
to
more
than
100%
because
multiple
types
of
systems
can
be
used
in
a
given
home.)
The
space
heater
most
commonly
found
in
NSW
homes
is
the
electric
reverse-‐cycle
air-‐source
heat
pump
(also
referred
to
as
a
reverse-‐cycle
air
conditioner).
Like
the
air-‐source
heat
pump
water
heater
described
above,
this
type
of
space
heater
is
particularly
effective4
in
NSW’s
relatively
warm
winter
climate5.
These
devices
also
provide
the
homeowner
with
space-‐cooling
during
periods
of
hot
weather
[8].
The
NSW
state
government
indicates
that
a
heat
pump
is
less
costly
to
operate
than
a
gas
heater
with
the
same
star
rating
[15].
The
deployment
of
air-‐source
heat
pumps
is
rapidly
growing
in
NSW.
Over
the
last
ten
years
their
market
penetration
has
significantly
surpassed
that
of
gas
space
heating
systems
[9].
45
40
35
Penetra[on
(%)
30
25
20
15
10
5
0
Electric
-‐
Electric
-‐
Gas
-‐
not
Wood
Gas
-‐
ducted
Other
reverse
cycle
resisdve
ducted
air-‐source
heat
pump
Figure
7:
Penetration
of
different
types
of
space
heating
systems
in
NSW
4
The
most
efficient
(seven
star)
air-‐source
heat
pump
space
heater
on
the
Australian
market
is
able
to
capture
approximately
five
units
of
free
renewable/ambient
heat
for
every
one
unit
of
electricity
used.
See
www.energyrating.gov.au
In
other
words,
heat
pumps
can
be
five
times
as
efficient
as
electric-‐resistive
or
gas
heating.
In
Australia,
heat
pump
hot
water
heaters
are
eligible
for
renewable
energy
credits
whereas
heat
pump
space
heaters
are
not
eligible.
5
July
(winter)
temperatures
in
Sydney
(Observatory
Hill)
range
from
8
°C
(average
July
low)
to
16
°C
(average
July
high).
Melbourne
Energy
Institute
13
McCoy
Building,
School
of
Earth
Sciences,
University
of
Melbourne,
Victoria
3010,
Australia
T:
+61
3
8344
3519
F:
+61
3
8344
7761
E:
info-‐mei@unimelb.edu.au
W:
www.energy.unimelb.edu.au
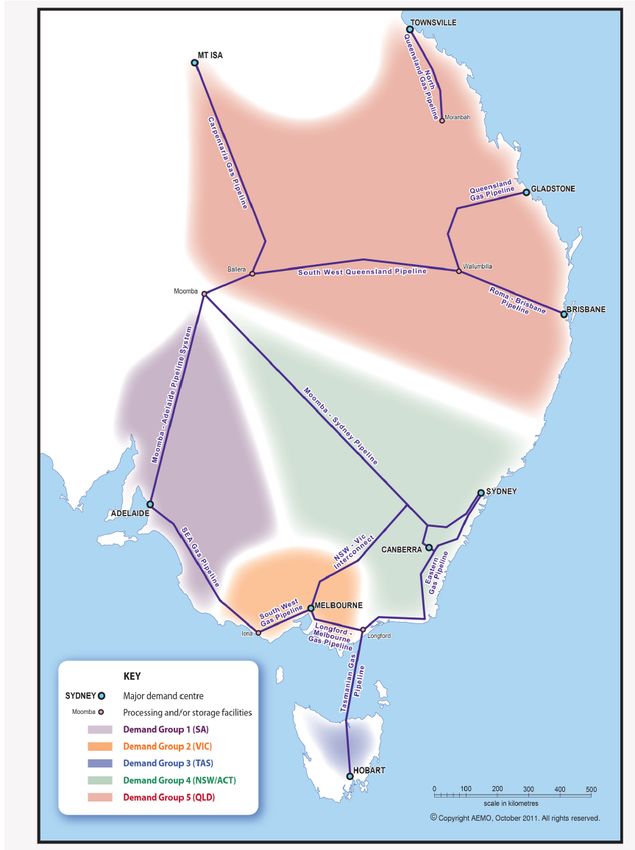
3. Historical
gas
supply
to
NSW
As
shown
in
green
on
Figure
8,
NSW
is
situated
in
the
middle
of
the
interconnected
eastern
Australian
domestic
gas
market6
[2].
Figure
8:
The
interconnected
eastern
Australian
gas
market
(from
AEMO
2011
Gas
Statement)
6
References
to
NSW
can
be
assumed
to
include
the
Australian
Capital
Territory,
abbreviated
as
ACT.
Melbourne
Energy
Institute
14
McCoy
Building,
School
of
Earth
Sciences,
University
of
Melbourne,
Victoria
3010,
Australia
T:
+61
3
8344
3519
F:
+61
3
8344
7761
E:
info-‐mei@unimelb.edu.au
W:
www.energy.unimelb.edu.au
Since
the
mid
1970’s,
gas
for
NSW
has
largely
been
supplied
via
pipeline
from
the
neighbouring
states
of
South
Australia
and
Victoria.7
In
those
neighbouring
states,
fossil
gas
and
oil
extraction
using
conventional
methods
was
centred
in
the
Bass
Strait
(offshore
of
eastern
Victoria)
and
at
Moomba
in
South
Australia.
4. Gas
exports
will
greatly
exceed
domestic
use
Starting
in
about
2007,
the
eastern
Australian
gas
market
began
to
change.
Identified
reserves
of
coal
seam
gas
(CSG)
in
NSW’s
neighbouring
state
of
Queensland8
grew
to
the
point
where
developers
could
see
that
gas
could
be
produced
at
volumes
many
times
greater
than
the
entire
eastern
Australian
domestic
market
[2].
The
focus
of
gas
developers
therefore
turned
to
exporting
liquefied
natural
gas
(LNG)
to
customers
in
Asia.
Today,
six
LNG
facilities
(known
as
“trains”)
are
under
construction
in
Gladstone,
Queensland.
The
first
started
exporting
LNG
in
late
2014
[16].
Figure
9
compares
a
view
of
NSW
gas
demand
in
2017
with
the
amount
of
gas
that
is
contracted
for
export
from
Queensland
that
same
year.
The
amount
of
gas
used
for
export
may
exceed
the
amount
of
gas
used
in
NSW
by
fourteen
times.
Gas
for
LNG
export
from
Queensland
in
2017
NSW
gas
demand
in
2017
Figure
9:
Queensland
gas
export
volumes
compared
with
NSW
gas
demand
(MEI)
7
Minor
gas
production
commenced
at
Camden
NSW
in
2001.
Capacity
at
that
facility
is
now
26
terajoules
per
day.
8
Coal
seam
gas
(CSG)
has
been
commercially
produced
in
Queensland
since
1999.
Melbourne
Energy
Institute
15
McCoy
Building,
School
of
Earth
Sciences,
University
of
Melbourne,
Victoria
3010,
Australia
T:
+61
3
8344
3519
F:
+61
3
8344
7761
E:
info-‐mei@unimelb.edu.au
W:
www.energy.unimelb.edu.au
You can also read