The determinants of genetic diversity in butterflies - Lewontin's paradox revisited - bioRxiv
←
→
Page content transcription
If your browser does not render page correctly, please read the page content below
bioRxiv preprint first posted online Jan. 29, 2019; doi: http://dx.doi.org/10.1101/534123. The copyright holder for this preprint
 (which was not peer-reviewed) is the author/funder, who has granted bioRxiv a license to display the preprint in perpetuity.
                              It is made available under a CC-BY-NC-ND 4.0 International license.

                                       The determinants of genetic diversity in butterflies –
                                       Lewontin’s paradox revisited
                                       Alexander Mackintosh 1,* Dominik R. Laetsch 1 , Alexander Hayward 2 , Martin
                                       Waterfall 1 , Roger Vila 3 , Konrad Lohse1,* ,

                                       1 Institute of Evolutionary Biology, University of Edinburgh, EH9 3FL
                                       Edinburgh, Scotland
                                       2 Centre for Ecology and Conservation, University of Exeter, Penryn, UK
                                       3 Institut de Biologia Evolutiva (CSIC Universitat Pompeu Fabra), Passeig
                                       Marı́tim de la Barceloneta 37, ESP-08003 Barcelona, Spain

                                       * konrad.lohse@ed.ac.uk

                                        Abstract
                                       Under the neutral theory genetic diversity is expected to be a simple function of
                                       population size. However, comparative studies have consistently failed to find any
                                       strong correlation between measures of census population size and genetic diversity.
                                       Instead, a recent comparative study across several animal phyla identified propagule size
                                       as the strongest predictor of genetic diversity, suggesting that r-strategists that produce
                                       many offspring but invest little in each, have greater long-term effective population sizes.
                                       We present a comparison of genome-wide levels of genetic diversity across 38 species of
                                       European butterflies (Papilionoidea). We show that across butterflies, genetic diversity
                                       varies over an order of magnitude and that this variation cannot be explained by
                                       differences in abundance, fecundity, host plant use or geographic range. Instead, we find
                                       that genetic diversity is negatively correlated with body size and positively with the
                                       length of the genetic map. This suggests that variation in genetic diversity is
                                       determined both by fluctuation in Ne and the effect of selection on linked neutral sites.

                                        Introduction
                                       The genetic diversity segregating within a species is a central quantity; it determines the
                                       evolutionary potential of a species, and is, in turn, the outcome of its selective and
                                       demographic past. Under the neutral theory [1] genetic diversity is expected to be
                                       proportional to the product of the effective population size, Ne , and the per-generation
                                       mutation rate, µ [2] (assuming an infinite sites mutation model). Given that census
                                       population size varies widely across the tree of life, much of the variation in genetic
                                       diversity between species should be due to differences in census size. In actuality,
                                       correlates of census size, such as geographic range, have repeatedly been found to be
                                       poor predictors of genetic diversity [3, 4, 5, 6]. In addition, genetic diversity seems to
                                       vary remarkably little overall given the wide range of population sizes seen in nature.
                                       While the finite number of sites in the genome puts a hard upper bound on the levels of
                                       genetic diversity that are possible [7], neutral genetic diversity in natural populations

                                                                                                                                    1/25
bioRxiv preprint first posted online Jan. 29, 2019; doi: http://dx.doi.org/10.1101/534123. The copyright holder for this preprint
 (which was not peer-reviewed) is the author/funder, who has granted bioRxiv a license to display the preprint in perpetuity.
                              It is made available under a CC-BY-NC-ND 4.0 International license.

                                       generally remains well below this. This observation, known as Lewontin’s paradox [5],
                                       has baffled evolutionary biologists for over half a century.
                                           Proposed solutions to the paradox are generally of two types; the first seeks to
                                       explain why there may be a negative relationship between Ne and µ [8], and the second
                                       why Ne should show such little variation between species [9]. Given the constraints on µ
                                       and the difficulty in obtaining direct estimates, recent comparative studies have focused
                                       on identifying life-history factors which determine and constrain variation in long term
                                       Ne and hence genetic diversity [10]. In particular, Romiguier et al. [4] and Chen et al.
                                       [11] have uncovered a striking correlation between reproductive strategy and genetic
                                       diversity across the animal kingdom: species that are short-lived and invest little into
                                       many offspring (r-strategists) tend to have higher genetic diversity than long-lived
                                       species with few offspring and large parental investment (K-strategists). One
                                       explanation for this result is that K-strategists are able to avoid extinction at low
                                       population sizes while r-strategists require much larger populations to do so, and thus
                                       the reproductive strategy of a species will greatly effect its long-term Ne .
                                           An alternative (but not mutually exclusive) explanation for the narrow range of
                                       genetic diversity observed in nature, is that natural selection continuously removes
                                       neutral diversity linked to either beneficial [9] or deleterious variants [12]. Because the
                                       efficacy of selection depends on Ne s, selection is expected to be more efficient and
                                       therefore remove more neutral linked sites in species with large Ne . Recently,
                                       Corbett-Detig et al. [13] have shown that the proportional reduction of neutral diversity
                                       due to selection at linked sites does indeed correlate with measures of census size such
                                       as geographic range and (negatively) with body size. While Corbett-Detig et al. [13]
                                       argue that this can explain ”... why neutral diversity does not scale as expected with
                                       census size”, a reanalysis of their data [14] concludes that the effect of linked selection
                                       on neutral diversity is too small to provide a general explanation for the narrow range of
                                       genetic diversity seen in nature. Thus, while recent comparative studies have identified
                                       major life history correlates of genetic diversity across the tree of life, and have found
                                       support for the idea that selection reduces genetic diversity at linked neutral sites,
                                       several questions remain open: What determines variation in genetic diversity across
                                       species with similar life-history strategies? Can we identify life history traits other than
                                       fecundity that determine a species’ resilience against environmental fluctuations and so
                                       correlate with genetic diversity? Does linked selection merely constrain genetic diversity
                                       or can it explain variation?
                                           Here we address these questions using butterflies (Papilionoidea) as a model system.
                                       Papilionoidea share a common ancestor approximately 119 million years ago (MYA)
                                       [15], and are characterised as ‘r strategists’ given their short life span and high fecundity
                                       [16]. Butterflies, in particular European species, which we focus on, are arguably the
                                       best studied group of insects. Thanks to centuries of study by scientists, amateur
                                       naturalists, and numerous recording schemes, butterfly taxonomy, geographic ranges
                                       and life-histories are known in great detail. While butterflies exhibit comparatively little
                                       variation in life-history strategy, one may still expect fecundity traits (e.g. relative egg
                                       size and voltinism, i.e. the number of generations per year) to predict genetic diversity
                                       given the large effect of fecundity on genetic diversity across animals [4]. Alternatively,
                                       if robustness to fluctuations in population size is the ultimate determinant of genetic
                                       diversity – as Romiguier et al. argue [4] – one would expect other life history traits to
                                       correlate with genetic diversity. In particular, more specialized species may have
                                       avoided extinction in spite of small census sizes and thus have reduced long-term Ne .
                                       While niche breadth is difficult to quantify for many taxa and so has not been
                                       considered in comparative analyses of genetic diversity so far, accurate data for the
                                       number of larval host plants (LHP) exist for European butterflies.
                                           We estimated genetic diversity from de novo transcriptome data for 38 butterfly

                                                                                                                                    2/25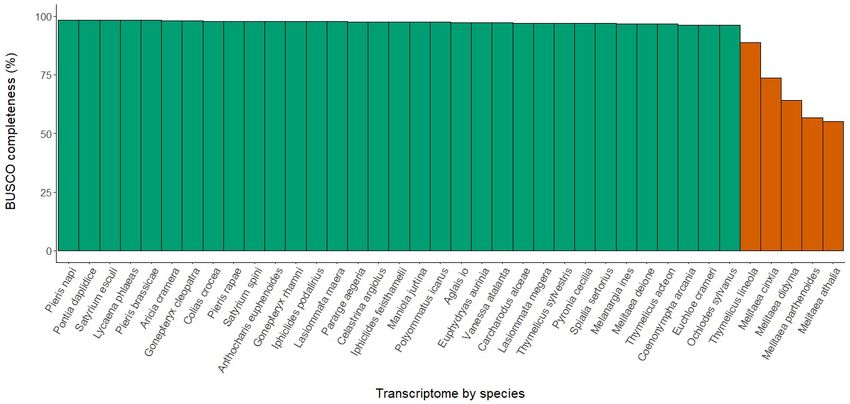
bioRxiv preprint first posted online Jan. 29, 2019; doi: http://dx.doi.org/10.1101/534123. The copyright holder for this preprint
 (which was not peer-reviewed) is the author/funder, who has granted bioRxiv a license to display the preprint in perpetuity.
                              It is made available under a CC-BY-NC-ND 4.0 International license.

                                       species (sampling two individuals in each, Supplementary Data 1) and compiled
                                       estimates of census size (which we estimated as the product of abundance and
                                       geographic range), body size, reproductive output (voltinism and relative egg volume)
                                       and the number of LHPs from the literature (Supplementary Data 2, see Methods).
                                       Additionally, we tested whether genome size and recombination rate affect genetic
                                       diversity. In the absence of detailed recombination maps, we use the number of
                                       chromosomes as a proxy for the length of the genetic map. This assumes one cross-over
                                       per chromosome and male generation on average (meiosis in female butterflies is
                                       achiasmatic), and is supported by linkage maps [17].
                                           To investigate what determines genetic diversity in butterflies, we estimated the
                                       effect of seven potential traits (census size, body size, voltinism, relative egg volume,
                                       LHP breadth, genome size and chromosome number) on average pairwise nucleotide
                                       diversity [18] in a generalized linear mixed model (see Methods for details). For
                                       simplicity, we restricted the estimation of synonymous diversity to fourfold degenerate
                                       sites, as these genic sites are the least constrained by selection (π4D ). Conversely,
                                       non-synonymous diversity was estimated at zero-fold degenerate sites (π0D ), i.e. sites
                                       were any nucleotide change leads to an amino acid difference. Our rational for
                                       modelling π4D and π0D jointly was to better understand the nature of the underlying
                                       forces at the population level: theory on linked selection predicts that any correlate of
                                       neutral genetic diversity (π4D ) that increases Ne in the absence of selection should also
                                       correlate with non-synonymous diversity (π0D ), but do so less strongly [19]. This is
                                       because the increase in diversity due to reduced genetic drift is counteracted by the
                                       removal of diversity due to more efficient selection. We would therefore expect a weaker
                                       correlation for sites that are directly affected by selection than for neutral, linked sites.
                                       In contrast, any trait that affects non-synonymous genetic diversity (π0D ) via the
                                       absolute strength of selection (i.e. affect s but not Ne ) should be more strongly
                                       correlated with diversity at non-synonymous sites (π0D ) than synonymous sites (π4D ),
                                       which are only indirectly affected.

                                        Results
                                        Neutral diversity varies over an order of magnitude across butterflies
                                       Genetic diversity was estimated for 38 species of European butterfly from five families:
                                       Papilionidae, Hesperiidae, Pieridae, Lycaenidae, Nymphalidae (Fig. 1). For 33 species,
                                       we generated and de novo assembled short read RNA-seq data for two individuals, and
                                       for five species we downloaded raw RNA-seq reads from a previous study [4]
                                       (Supplementary Data 3). We called variants for each species by mapping reads back to
                                       reference transcriptomes. Only transcripts present in a set of 1314 single-copy
                                       orthologues, which we identified from the 33 transcriptomes with high completeness
                                       (BUSCO scores 96.3 – 98.4%, Fig. S1), contributed to estimates of genetic diversity.
                                           Mean neutral genetic diversity across this set of butterfly species (π4D = 0.0173) is
                                       typical of insects [3, 13, 11]. Neutral genetic diversity (π4D ) varies over an order of
                                       magnitude: from 0.0044 in Pieris brassicae, the cabbage white, to 0.0423 in Spialia
                                       sertorius, the red-underwinged skipper (Fig. 1). Assuming neutrality and a per site and
                                       generation spontaneous mutation rate of µ = 2.9 × 10⁻⁹ [20], this range corresponds to
                                       an Ne on the order of 105 to 106 individuals. As expected, given that closely related
                                       species tend to have similar levels of genetic diversity, this range is much lower than
                                       that across distantly related animal taxa [4, 11]. In contrast to Romiguier et al. [4]
                                       whom – sampling across the entire animal kingdom – found that species in the same
                                       taxonomic family have similar genetic diversity, we observed no significant family effect
                                       in butterflies (ANOVA, F4,33 = 2.071, p = 0.107). More generally, phylogeny was a poor

                                                                                                                                    3/25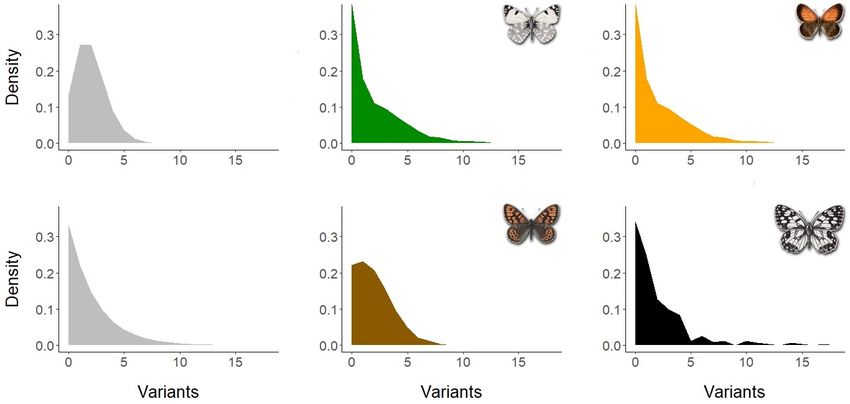
bioRxiv preprint first posted online Jan. 29, 2019; doi: http://dx.doi.org/10.1101/534123. The copyright holder for this preprint
 (which was not peer-reviewed) is the author/funder, who has granted bioRxiv a license to display the preprint in perpetuity.
                              It is made available under a CC-BY-NC-ND 4.0 International license.

                                        predictor of neutral genetic diversity in butterflies (n = 38, Pagel’s = 5.8 ∗ 10−5 ,
                                        p = 1.000, assuming that π4D evolves randomly, Fig. 1).

              Fig 1. Neutral genetic diversity (π4D ) across European butterfly species. The phylogeny is
              based on 218 single-copy orthologues and rooted with the silkmoth Bombyx mori as an
              outgroup. All nodes have 100% bootstrap support unless marked with an asterisk (70-99%).
              The barplot on the right shows genome-wide estimates of π4D for 38 focal species sampled
              from the six major clades of Papilionoidea present in Europe. The phylogeny explains very
              little of the variation in π4D in butterflies.

                                        Estimates of non-synonymous diversity and the efficacy of selection
                                       Since selection will purge (or fix) mutations at non-synonymous sites [12, 21], we expect
                                       diversity at these sites to be greatly reduced compared to synonymous sites. The
                                       efficacy of selection, which is determined by Ne and the distribution of fitness effects
                                       (DFE) of mutations is inversely proportional to π0D /π4D [19]. Under the nearly neutral
                                       theory [22] and assuming a gamma distribution for the DFE, the slope of the negative
                                       linear relationship between ln(π0D /π4D ) and ln(π4D ) is proportional to the β shape
                                       parameter [19]. Within this set of butterfly species π0D and π4D typically differed by an
                                       order of magnitude and, unsurprisingly, were strongly correlated (Pearson’s correlation,
                                       d.f. = 36, r = −0.8779, p = 4.6 ∗ 10−13 ). The slope of the relationship between
                                       ln(π0D /π4D ) and ln(π4D ) (Fig. S2) would imply a substantial fraction of weakly
                                       deleterious mutations (β = 0.44) which is higher than the estimates for Heliconius
                                       species (0.08 - 0.28) [11] but compatible with previous estimates of the DFE for
                                       Drosophila miranda obtained from inferences based on the site frequency spectrum [23].

                                                                                                                                    4/25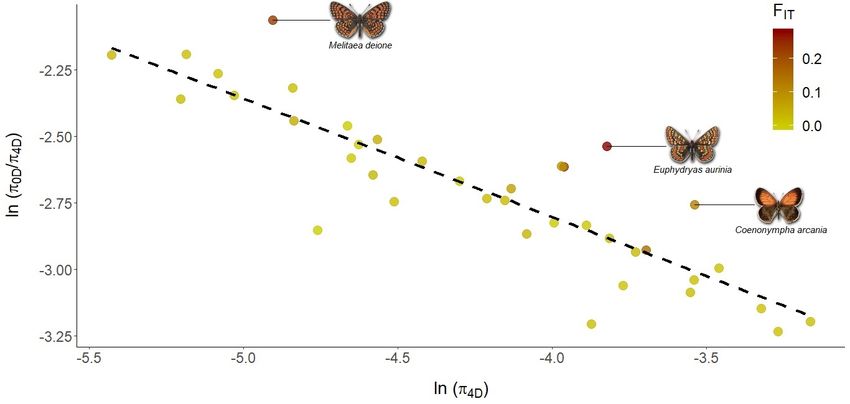
bioRxiv preprint first posted online Jan. 29, 2019; doi: http://dx.doi.org/10.1101/534123. The copyright holder for this preprint
 (which was not peer-reviewed) is the author/funder, who has granted bioRxiv a license to display the preprint in perpetuity.
                              It is made available under a CC-BY-NC-ND 4.0 International license.

                                        Nuclear and mitochondrial diversity are uncorrelated
                                       Mitochondrial (mt) genes are an easily accessible source of variation data and have been
                                       extensively used to infer the phylogeographic history of species and populations in
                                       Europe [24, 25]. However, it is becoming increasingly clear that mt diversity largely
                                       reflects selective processes [26] and variation in mt mutation rates rather than rates of
                                       genetic drift [27, 28]. Several comparative studies have shown that mt diversity is
                                       uncorrelated with measures of abundance and nuclear diversity [29, 27, 28]. We find
                                       that across European butterflies mt diversity at the COI barcode locus (πmt ) is only
                                       very weakly and non-significantly correlated with genome-wide neutral diversity π4D
                                       (Pearson’s correlation, d.f. = 36 r = 0.1523, p = 0.362) and π0D (Pearson’s correlation,
                                       d.f. = 36 r = 0.268, p = 0.104) (Fig. S3).

                                        Census population size, host plant breadth and reproductive strategy are
                                        uncorrelated with genetic diversity
                                       We find that census population size is uncorrelated with both π0D and π4D (Table S1).
                                       This suggests that present day ranges and abundance have little to do with long term
                                       Ne in butterflies. Unlike recent studies which have found that propagule size strongly
                                       correlates with neutral genetic diversity across much wider taxonomic scales [4, 11], we
                                       find no significant effect of relative egg size (egg volume / body size) on π4D (Table S1).
                                       Similarly, voltinism is uncorrelated with π4D (pM CM C = 0.151, Table S1). Although
                                       not significant, the trend of polyvoltine taxa having greater π4D is at least consistent
                                       with the idea that r-strategists have larger long-term Ne [4]. We find that the larval
                                       hosts plant (LHP) breadth has no significant effect on π4D or π0D (Table S1). This is
                                       true regardless of whether we classify species as monophagous if all LHPs are within one
                                       family (and polyphagous otherwise) or instead consider the number of LHP species as a
                                       predictor (Fig. S4).
                                           Only one trait, body size, is significantly and negatively correlated with π4D
                                       (pM CM C < 0.005, Table 1, Fig. 2A): smaller butterfly species tend to have higher
                                       genetic diversity. As predicted for correlates of long term Ne , the effect is weaker for
                                       π0D (Table 1) than π4D . We can express the effects of body size on ln(π4D ) and ln(π0D )
                                       in terms of ln(π0D /π4D ). This ratio is weakly and positively correlated with body size
                                       (posterior mean = 0.123, pM CM C = 0.049), suggesting that selection is more efficient in
                                       smaller species.

                                        Chromosome number, but not genome size, correlates with genetic
                                        diversity
                                       We find that chromosome number correlates positively and significantly with π4D
                                       (pM CM C < 0.005, Table 1, Fig. 2B). In contrast, genome size, i.e. the physical length of
                                       the genome (estimated using flow cytometry, see Methods), is uncorrelated with π4D
                                       (Table S1). Assuming that the number of genes (and other potential targets of selection)
                                       is more or less constant and independent of genome size across butterflies, the finding
                                       that neutral diversity only depends on the length of the genetic map but not the
                                       physical length of the genome is entirely consistent with population genetic predictions
                                       for the effects of linked selection [9, 30]: the aggregate effect of selection on linked sites
                                       is expected to be a function only of the density of selective targets on the genetic map
                                       but independent of the physical length [9, 12, 21].

                                        Pleistocene bottlenecks and demography
                                        Genetic diversity in many European taxa has been shaped by the cycles of isolation into
                                        and range expansion out of glacial refugia during the Pleistocene [24, 25, 31]. While we

                                                                                                                                    5/25
bioRxiv preprint first posted online Jan. 29, 2019; doi: http://dx.doi.org/10.1101/534123. The copyright holder for this preprint
 (which was not peer-reviewed) is the author/funder, who has granted bioRxiv a license to display the preprint in perpetuity.
                              It is made available under a CC-BY-NC-ND 4.0 International license.

               Fig 2. Neutral diversity π4D in butterflies is negatively correlated with body size (left) and
               positively with the number of chromosomes (right).

                                       Table 1. Posterior mean estimates of linear correlates of genetic diversity
                                       at synonymous (π4D ) and non-synonymous (π0D ) sites inferred under a
                                       minimal model.
                                             Predictor      Response Posterior mean 95% CI            pM CM C
                                             Body size      π4D       -0.321           -0.513, -0.110 0.002
                                             Body size      π0D       -0.200           -0.335, -0.064 0.005
                                             Chrom. number π4D        0.277            0.103, 0.468   0.003
                                             Chrom. number π0D        0.150            0.024, 0.267   0.017

                                                                                                                                    6/25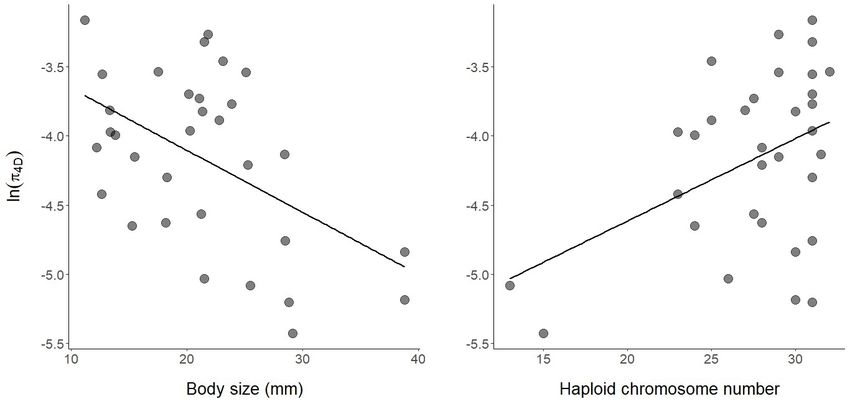
bioRxiv preprint first posted online Jan. 29, 2019; doi: http://dx.doi.org/10.1101/534123. The copyright holder for this preprint
 (which was not peer-reviewed) is the author/funder, who has granted bioRxiv a license to display the preprint in perpetuity.
                              It is made available under a CC-BY-NC-ND 4.0 International license.

                                       have sought to minimize the effects of Pleistocene history by focusing sampling on a
                                       single Pleistocene refugium, Iberia, our inferences could be confounded in at least two
                                       ways: Firstly, rather than being solely driven by long term Ne , variation in genetic
                                       diversity in Iberia may be affected by gene flow from other refugia [32] or even species
                                       [33]. Secondly, even if Iberian populations are little affected by admixture, they may
                                       have undergone drastic (and potentially different) changes in Ne in response to past
                                       climatic events. Population bottlenecks affect π, but correspond to a sudden burst in
                                       coalescence without any change in the long term rate [34]. Population bottlenecks
                                       would also affect our interpretation of π0D /π4D as a measure of the efficacy of selection:
                                       after a bottleneck π0D recovers more quickly than π4D . We therefore expect taxa that
                                       have undergone recent changes in Ne to fall above the line in ln(π4D ) vs ln(π0 /π4D )
                                       correlation (Fig. S2).
                                           While modelling demography from transcriptome data is challenging, the
                                       distribution of heterozygous sites in a single diploid individual contains information
                                       about past demography. In particular, extreme bottlenecks or a rapidly expanding
                                       populations should lead to strongly correlated pairwise coalescence times. Considering a
                                       fixed length of sequence, we expect the number of heterozygous sites S to be Poisson
                                       distributed whereas intermediate bottlenecks result in multimodal distribution of S with
                                       an increased variance relative to a constant sized population [35]. However, the majority
                                       of species show a unimodal, long tailed distribution of S, more akin to that expected for
                                       a population of constant Ne than the limiting case of an extremely bottlenecked (or
                                       rapidly expanding) population. In fact, only seven species have a higher variance in S
                                       than expected for population of constant size (Fig. S6, Fig. S7).

                                        Robustness to population structure
                                       The relationship between genetic diversity and population size predicted by the neutral
                                       theory assumes a randomly mating population at mutation-drift equilibrium. Since
                                       population structure is ubiquitous, an obvious question is to what extent our findings
                                       are confounded by differences in population structure across species. For example, it is
                                       plausible that the correlation between body size and diversity is simply a consequence of
                                       the reduced dispersal ability in smaller species. However, if this were the case, we would
                                       expect genetic differentiation to also correlate with body size. We find no evidence for
                                       this: differentiation between individuals sampled >500 km apart is low overall (median
                                       FIT = 0.019) and uncorrelated with body size (p = 0.804) (Fig. S5). Furthermore, the
                                       effect of body size on genetic diversity remains essentially unchanged if we estimate π4D
                                       and π0D within rather than between individuals. Increased population structure in
                                       smaller species can therefore not explain the negative relationship between genetic
                                       diversity and body size.
                                            However, our dataset does include a handful of species with notably high FIT within
                                       Iberia, such as the Marsh Fritillary Euphydryas aurinia and the Pearly Heath
                                       Coenonympha arcania (FIT = 0.281 and 0.122, respectively). Interestingly, both species
                                       fall above the line of best fit in Fig. S2 suggesting that selection is less efficient globally
                                       (i.e. ln(π0D /π4D ) is higher), presumably due to the presence of different locally adapted
                                       subspecies or populations. In contrast, the migratory species Vanessa atalanta is an
                                       outlier in the opposite direction and has lower diversity at non-synonymous sites (π0D )
                                       than expected given its neutral diversity (π4D ) (Fig. S2).

                                        Discussion
                                       We show that neutral genetic diversity in European butterflies varies over an order of
                                       magnitude and that this variation is uncorrelated with both current abundance and

                                                                                                                                    7/25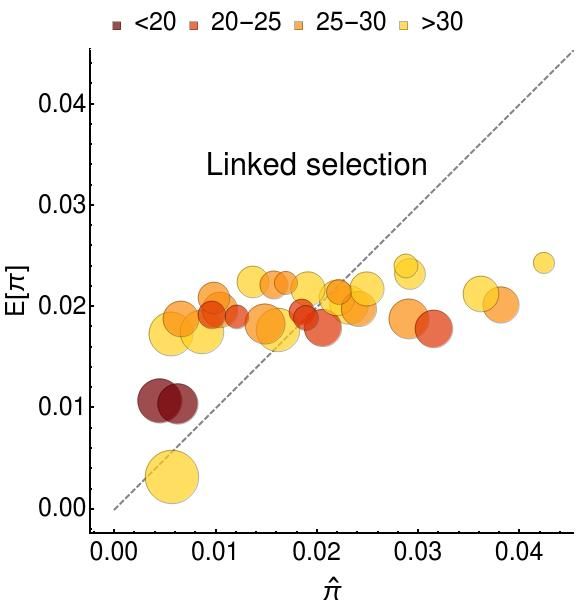
bioRxiv preprint first posted online Jan. 29, 2019; doi: http://dx.doi.org/10.1101/534123. The copyright holder for this preprint
 (which was not peer-reviewed) is the author/funder, who has granted bioRxiv a license to display the preprint in perpetuity.
                              It is made available under a CC-BY-NC-ND 4.0 International license.

                                        several key life-history traits. In particular, and in contrast to previous studies on larger
                                        taxonomic scales [4, 11], we do not find any relationship between propagule size or
                                        longevity and genetic diversity. We also find little support for the idea that generalist
                                        species have larger long term Ne and hence greater levels of genetic diversity. Instead,
                                        body size and chromosome number were the only significant correlates of neutral
                                        genetic diversity and, together, explain 42% of the variation in diversity across
                                        European butterflies. Romiguier et al. [4] have also found a significant negative
                                        correlation between body size and genetic diversity and have argued that carrying
                                        capacities are higher for smaller species, i.e. more individuals can be supported by the
                                        same finite resources, all else being equal. Alternatively, larger butterfly species may be
                                        less likely to reach carrying capacities due to other factors such as heightened predation.
                                        Either way, this relationship is not exclusive to butterflies, and has been found in
                                        mammals [36] and across animals [4] more widely.
                                            The positive correlation between chromosome number and genetic diversity is an
                                        expected consequence of linked selection and mirrors the ubiquitous intraspecific
                                        correlation between genetic diversity and recombination rate [37, 38]. However, unlike
                                        previous comparative studies which have shown that linked selection merely constrains
                                        variation in genetic diversity [13], our results demonstrate that linked selection can
                                        explain variation in genetic diversity between taxa that differ in the length of the
                                        genetic map.

                                        Niche breadth
                                       The lack of any correlation between estimates of census size and π4D we find mirrors
                                       results of previous studies [4, 3, 6, 5] and suggests that current abundance is unlikely to
                                       reflect long term Ne in European butterflies. While the distribution of heterozygosity
                                       suggests that it is unlikely that variation in genetic diversity across butterflies is due to
                                       drastic demographic events during the Pleistocene, very recent demographic changes
                                       could explain the weak relationship between estimates of census population size and
                                       π4D . In particular, the low genetic diversity of Pieris brassicae, a pest species with
                                       enormous current population sizes, is compatible with a rapid expansion which may
                                       have been too recent to leave much signal in the data: V ar[S] is not particularly low for
                                       P. brassicae (5.67 compared to the mean among species of 4.85). Interestingly, analysis
                                       of RAD-seq data from the closely related species P. rapae suggests a population
                                       expansion ≈ 20,000 yBP (shortly after the last glacial maximum) followed by divergence
                                       into subspecies 1200 yBP when Brassica cultivation intensified [39]. It is therefore
                                       possible that, by contrast, the ancestral P. brassicae population remained small after
                                       the glacial maximum and only expanded as recently as ≈ 1200 yBP.
                                           If variation in carrying capacity shapes genetic diversity in butterflies, it is perhaps
                                       surprising that niche breadth (the number of LHPs) is uncorrelated with π4D . However,
                                       given that LHPs vary drastically in geographic range and density, the number of LHPs
                                       may be a very crude predictor of a species long-term census size: a species with a single
                                       LHP may have very large populations if its host is widespread. Conversely, a generalist
                                       may have low long-term Ne due to other biotic factors. For example, C. argiolus one of
                                       the most widespread and generalist (> 100 LHPs) species in our set has relatively low
                                       neutral genetic diversity (π4D = 0.0095).
                                           There are several potential life history traits that might have large effects on long
                                       term Ne which we have not considered: in particular, how (in what life-cycle stage) and
                                       where species hibernate, the rate of parasitoid attack and the degree of migratory versus
                                       sedentary behaviour. Exploring whether these correlate with genetic diversity will
                                       require larger sets of taxa.

                                                                                                                                    8/25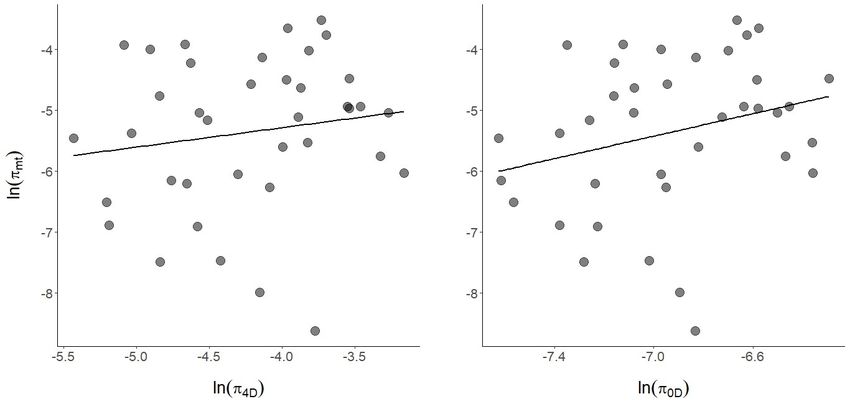
bioRxiv preprint first posted online Jan. 29, 2019; doi: http://dx.doi.org/10.1101/534123. The copyright holder for this preprint
 (which was not peer-reviewed) is the author/funder, who has granted bioRxiv a license to display the preprint in perpetuity.
                              It is made available under a CC-BY-NC-ND 4.0 International license.

                                        The evolution of chromosome number and genome size
                                       We have so far assumed that chromosome number is simply a proxy of the genetic map
                                       length and affects genetic diversity by modulating the action of linked selection.
                                       However, what is cause and effect is far from clear and chromosome number may itself
                                       depend on the efficacy of selection. Recently Hill et al. [40] found that chromosomes in
                                       Pieris napi are derived from multiple ancestral syntenic blocks, suggesting a series of
                                       fission events that was followed by the creation of a novel chromosome organisation
                                       through fusions. Because P. napi returned to a karyotype close to the ancestral nc = 31
                                       of butterflies, there appears to be some selective advantage in organising the genome
                                       this way, and chromosome rearrangements that produce karyotypes distant from
                                       nc = 31 may only be tolerated when Ne s < 1. Thus, an alternative explanation for the
                                       positive correlation between chromosome number and genetic diversity we find could be
                                       that species with low Ne are unable to purge mildly deleterious syntenic changes, such
                                       as fusions, which drift to fixation. The fact that the chromosome number effect is
                                       largely driven by the two species with the fewest chromosomes (Pieris brassicae,
                                       nc = 15, and Melanargia ines, nc = 13) which must have undergone relatively recent
                                       chromosomal fusions (given that in both cases relatives in the same genus have higher
                                       nc ) would be consistent with this. However, we find that removing both species, a
                                       positive (albeit non-significant) correlation between chromosome number and π4D
                                       remains (MCMCglmm, posterior mean = 0.284, pM CM C = 0.128). As no species within
                                       our dataset has nc >> 31, we cannot test whether the relationship between genetic
                                       diversity and chromosome number is quadratic, and thus consistent with a model where
                                       reduced Ne may lead to both increases or decreases in nc . Interestingly, species in the
                                       genus Leptidea, which have undergone very drastic and recent changes in chromosome
                                       numbers (nc ranges between 26 and 120 [41]), appear to have very low genome-wide
                                       diversity (π across all site between 0.0011 and 0.0038) [42] which is consistent with the
                                       idea that extreme karyotypes arise during periods of low Ne .
                                           Lynch & Conery [43] have put forward an analogous argument for the evolution of
                                       genome sizes which would be expected to increase in populations with low Ne because
                                       inefficient selection may allow transposable element proliferation and intron expansion.
                                       We find no support for any relationship between genome size and neutral diversity in
                                       butterflies. Instead our analyses clearly show that genome size evolves slowly and has
                                       significant phylogenetic signal across the butterflies (n = 37, Pagel’s λ = 1.000,
                                       p = 6.1 ∗ 10−7 ) whereas variation in genetic diversity has little phylogenetic structure
                                       (Fig. 1).

                                        How well is genetic diversity predicted from body size and recombination
                                        rate?
                                        Body size and chromosome number together explain 42% of the variation in genetic
                                        diversity across European butterflies (Fig. 2). We have assumed linear relationships
                                        between these predictors and genetic diversity without paying any attention to the
                                        causative forces at the population level. An alternative, population genetics approach is
                                        to model linked selection mechanistically. To gain some insight into the effects
                                        background selection (BGS) [21, 12] and recurrent selective sweeps have on
                                        genome-wide neutral diversity sites linked sites [9, 44, 30], we consider the
                                        approximation by Coop (2016) [45, eq. 20]
                                                                                                  π0
                                                                                 E[π] =                                              (1)
                                                                                           2N0 J νr +    1
                                                                                                        B(r)

                                           , where π0 = 4N0 µ is the genetic diversity in the absence of selection, J is the
                                        probability of a sweep-induced pairwise coalescence event and νr is the relative rate of

                                                                                                                                    9/25
bioRxiv preprint first posted online Jan. 29, 2019; doi: http://dx.doi.org/10.1101/534123. The copyright holder for this preprint
(which was not peer-reviewed) is the author/funder, who has granted bioRxiv a license to display the preprint in perpetuity.
It is made available under a CC-BY-NC-ND 4.0 International license.
sweeps and recombination (for details see [46, 14]). A simple approximation for the
effect of BGS is B(r) = exp −U/r [12, 47], where U is the per base rate of deleterious
mutations. Thus both the effects of BGS and positive selection depend on the ratio of
mutational input over recombination. We can scale the rates of deleterious mutations
and selective sweeps per genome (rather than per bp): assuming that the number of
selective targets is fixed across species, the terms for BGS and positive selection become
simple functions of the genetic map length, i.e. the number of chromosome (nc ):
ν/r ≈ 2νT /nc and B(r) ≈ e−2UT /nc , where νT and UT are the total number of selective
sweeps and deleterious mutations respectively. Note that we assume on average half a
crossover event per chromosome given the absence of recombination in female
Lepidoptera.
One immediate conclusion that can be drawn from the above is that given the large
number of chromosomes in butterflies (15 ≤ nc ≤ 31) BGS can only have a negligible
effects on neutral diversity: even if we assume an extreme rate of UT = 1 deleterious
mutation per genome, the reduction in diversity due to BGS B(r) only ranges between
0.94 and 0.97 in our dataset.
Furthermore, we can use eq. 1 to ask what selective parameters best fit the observed
variation in π4D . Assuming that i) N0 depends linearly on body size, ii) a spontaneous
mutation rate of µ = 2.9 × 10⁻⁹ [20], and iii) J = 10−4 , we can co-estimate both the
correlation between N0 and body size and the rate of sweeps per generation (by
minimizing the sum of squared differences between observed and predicted π4D across
species (Supplementary Data 4). Given these assumptions, the best fitting regime of
linked selection involves extremely frequent directional selection, i.e. νT ≈ 0.028, about
one sweep every 35 generations. While this approximate model of linked selection only
fits marginally better than the linear model assumed by MCMCglmm (the sum of least
squares between the observed set of π4D estimates and the expected values is 0.00226
and S = 0.00228 respectively), the latter predicts a much narrower range of π4D than is
observed (Fig. S8). Thus, the above ”back-of the envelope calculation” agrees with the
analysis of Coop [14] in showing that at approximate models of linked linked selection
provides a poor fit to the observed variation in genetic diversity.
Outlook
While we have only considered a small number of life-history traits and genomic
parameters and have modelled neither linked selection nor demography explicitly, it is
encouraging that we have identified two simple determinants, which together explain a
substantial fraction of the variance in genetic diversity across butterflies. It is clear
however, that a more complete understanding of the processes that shape genetic
diversity and how these correlate with life-history will require modelling both the
demographic and the selective past [48] explicitly. For example, a previous comparative
study based on whole genome data reconstructed the directional histories of divergence
and admixture between refugial populations for a different guild of insects [32] and
found a trend of refugial population being younger in specialist species. An important
next step is to include models of selection and its effects on linked sequence in such
inferences. Given sufficiently large samples of taxa, one can then tease apart life history
traits that affect genetic diversity via demographic parameters (Ne in the absence of
selection, gene flow between populations) from those that determine the strength of
selection itself. Rather than focusing on pairwise π, the most drastic summary of
genetic variation, such inferences will require methods that make use of the detailed
information contained in genomic data. Another important source of information, which
has been exploited by Corbett-Detig et al. [13] but is currently unavailable for most
taxa are direct estimates of the recombination map. Given the detailed knowledge of
their taxonomy, ecology, geographic range and their relatively compact genomes,
10/25bioRxiv preprint first posted online Jan. 29, 2019; doi: http://dx.doi.org/10.1101/534123. The copyright holder for this preprint
(which was not peer-reviewed) is the author/funder, who has granted bioRxiv a license to display the preprint in perpetuity.
It is made available under a CC-BY-NC-ND 4.0 International license.
butterflies are perhaps the best test case for attempting a reconstruction of the
evolutionary process that would resolve Lewontin’s paradox.
Methods and Materials
Sampling and sequencing
Butterflies were hand-netted at various locations across four regions in Iberia (Southern Portugal,
Northern Portugal, Catalonia and Asturias, Supplementary Data 1), frozen alive in a liquid nitrogen
dry shipper and stored at -80 °C. Two individuals per species were selected for RNA extraction and
sequencing. Each species was represented by one female and one male individual when possible. Species
identities were confirmed by amplifying and sequencing the standard mitochondrial barcode (a 658-bp
fragment of COI, primers LepF and LepR [31]) and comparison against a reference database for Iberian
butterflies [31] in the following species: Carcharodus alcae, Coenonympha arcania, Euphydryas aurinia,
Melitaea deione Thymelicus acteon and T. sylvestris.
RNA was extracted using a TRIzol (Ambion) protocol according to the manufacturer’s instructions.
TruSeq stranded polyA-selected RNA libraries were prepared by Edinburgh Genomics and strand
specific 75b paired-end reads were generated on a HiSeq4000 Illumina instrument. RNA-seq datasets
for Melitaea athalia, M. cinxia, M. didyma, M. parthenoides, and Thymelicus lineola — previously
analysed in [4] — were retrieved from the European Nucleotide Archive (ENA).
Data QC and de novo transcriptome assembly
Raw read quality was evaluated using FastQC v0.11.7 [49] and visualised with MultiQC v1.5a [50].
Illumina adapters were removed and reads trimmed using Trimmomatic [51] (under default parameters)
and only reads of length ≥25b were retained. Transcriptomes were assembled de novo from both
individuals of each species with Trinity [52] and are deposited at the XXX database. Assembly
completeness was assessed using BUSCO v3.0.2 [53] together with the Insecta database insectodb9
(1658 single copy orthologues from 42 insect species) as a reference (Fig. S1, Supplementary Data 3).
Variant calling
Protein coding transcripts were identified using Transdecoder [54], BLAST [55] and HMMER [56].
Transdecoder was used to find open reading frames (ORFs) within transcripts, while homology searches
were done using BLAST and HMMER to identify transcripts containing known sequences and domains.
Finally, the predict function in Transdecoder was used to score likely protein coding transcripts based
on ORF presence and homology. For each species, reads of both individuals were separately mapped to
the longest isoforms of complete proteins using BWA MEM [57]. Loci which were suitable for variant
calling were selected using the callable loci function in GATK [58]. We selected sites with a read depth
≥ 10 and MQ ≥ 1. Callable loci were intersected between individuals using BEDTools [59], removing
sites that were not expressed by both individuals in each species. Variants were called using Freebayes
[60], and only retained if supported by more than three reads, with the variant being found in both the
3’ and 5’ end of reads, as well as in both forward and reverse reads. Excluded variants were masked for
downstream analysis, and so did not contribute to the total length or variant count.
Estimating genetic diversity
Protein clustering using Orthofinder [61] revealed 1314 single copy orthologue clusters in the 33
transcriptomes with high completeness BUSCO scores 96.3 – 98.4%). Only the transcripts corresponding
to these proteins were used to estimate π in each species transcriptome. To minimize the confounding
effect of population structure (and inbreeding) we calculated πb , i.e. the genetic diversity between the
two individuals sampled for each species (analogous to dXY ):
(nA + nB + nAB )/2 + nf ix
πb =
ntot
where nA , nB are the numbers heterozygous sites unique to individual A and B, and nAB is the
count of shared heterozygous sites and nf ix is the number of fixed differences. Calculations were
carried out separately for four-fold degenerate (π4D ) and zero-fold degenerate (π0D ) sites using the
script bob.py deposited at www.github.com/DRL/mackintosh2019.
Mitochondrial π was calculated for the COI barcode locus using sequences retrieved from the
BOLD systems database [62]. Alignments of 658bp for each species were produced in Bioedit [63]
using CLUSTAL-W [64] and manual inspection. Mean pairwise π of each alignment was calculated in
MEGA7 [65].
11/25bioRxiv preprint first posted online Jan. 29, 2019; doi: http://dx.doi.org/10.1101/534123. The copyright holder for this preprint
(which was not peer-reviewed) is the author/funder, who has granted bioRxiv a license to display the preprint in perpetuity.
It is made available under a CC-BY-NC-ND 4.0 International license.
Phylogeny reconstruction
Single-copy orthologous proteins present in all transcriptome assemblies — as well as the genome of the
silkmoth Bombyx mori — were identified with Orthofinder. The resulting 218 protein sequences were
concatenated for each species, aligned using MAFFT [66], and trimmed using trimAl [67]. The final
alignment contained 59747 amino acid sites, 22429 of which were informative for phylogenetic inference.
We conducted 20 maximum likelihood (ML) tree searches, using the substitution model
PROTGTR+GAMMA, with RAxML [68]. To assess confidence in the ML tree, non-parametric bootstrap
values were obtained from 100 replicates.
Statistical analysis
Phylogenetic mixed models were constructed using the R package MCMCglmm [69]. Models were bivariate,
that is, included two responses, ln(π4D ) and ln(π0D ), which were assumed to covary and follow a
Gaussian distribution. Only the 32 species with data for all seven predictors were included.
Fixed effects were z-transformed when continuous so that estimated effect sizes were comparable for
a given response. Phylogeny was included in the model as a random effect based on the inverse matrix
of branch lengths in the maximum likelihood species phylogeny (Fig. 1). We assumed the following
parameter expanded priors for the random effect (G) and the residual variance (R):
prior 1bioRxiv preprint first posted online Jan. 29, 2019; doi: http://dx.doi.org/10.1101/534123. The copyright holder for this preprint
(which was not peer-reviewed) is the author/funder, who has granted bioRxiv a license to display the preprint in perpetuity.
It is made available under a CC-BY-NC-ND 4.0 International license.
when LHPs represented multiple families. Mean forewing length (across at least ten individuals per sex)
reported in [77] was used as a proxy for adult body size. The mean between sexes was used for
statistical analysis. Estimates of egg volume were retrieved from [78], haploid chromosome number from
[77] and information on voltinism from [75]. Since the number of generations can vary within species,
we only classified species as monovoltine if they had strictly one generation per year throughout their
European range and polyvoltine if otherwise. In species with variable chromosome numbers, the mean
was used for statistical analyses. All data can be found in Supplementary Data 2.
Acknowledgments
We thank Jarrod Hadfield for help with MCMCglmm and discussions throughout, Lisa
Cooper for excellent work in the wetlab and Carla and Oskar Lohse for their
enthusiastic support in the field. We are indebted to Cecilia Corbella, Michael Jowers,
Luis Valledor, Miguel Carneiro, Martim Melo, Jose Campos and Megan Wallace for help
with field and lab logistics and Richard Lewington from Collins Butterfly Guide for
permission to reproduce illustrations. Permissions for field sampling were obtained from
the Generalitat de Catatunya (SF/639) and the Gobierno del Principado de Asturias
(014252). This project was supported by an ERC starting grant (ModelGenomLand)
and an Independent Research fellowship from the Natural Environmental Research
Council (NERC) UK (NE/L011522/1) to KL. AM was supported by a summer
studentship from the Institute of Evolutionary Biology at Edinburgh University, AH is
supported by a Biotechnology and Biological Sciences Research Council David Phillips
fellowship (BB/N020146/1) and RV is supported by project CGL2016-76322-P
(AEI/FEDER, UE).
References
1. Kimura M. The number of heterozygous nucleotide sites maintained in a finite
population due to the steady flux of mutations. Genetics. 1969;61:893–903.
2. Watterson G. On the number of segregating sites in genetical models without
recombination. TPB. 1975;7(2):256–276.
3. Leffler EM, Bullaughey K, Matute DR, Meyer WK, Ségurel L, Venkat A, et al.
Revisiting an old riddle: what determines genetic diversity levels within species?
PLOS Biology. 2012 09;10(9):1–9. Available from:
https://doi.org/10.1371/journal.pbio.1001388.
4. Romiguier J, Gayral P, Ballenghien M, Bernard A, Cahais V, Chenuil A, et al.
Comparative population genomics in animals uncovers the determinants of
genetic diversity. Nature. 2014;515:261–263.
5. Lewontin RC, Krakauer J. Distribution of gene frequency as a test of the theory
of selective neutrality of polymorphisms. Genetics. 1973;74(1):175–195. Available
from: http://www.genetics.org/content/74/1/175.
6. Nevo E. Genetic variation in natural populations: Patterns and theory.
Theoretical Population Biology. 1978;13(1):121 – 177. Available from:
http://www.sciencedirect.com/science/article/pii/0040580978900394.
7. Charlesworth B, Jain K. Purifying Selection, Drift, and Reversible Mutation with
Arbitrarily High Mutation Rates. Genetics. 2014;198(4):1587–1602. Available
from: http://www.genetics.org/content/198/4/1587.
8. Lynch M. Evolution of the mutation rate. Trends in Genetics. 2010;(6):345–352.
Available from: https://doi.org/10.1016/j.tig.2010.05.003.
13/25bioRxiv preprint first posted online Jan. 29, 2019; doi: http://dx.doi.org/10.1101/534123. The copyright holder for this preprint
(which was not peer-reviewed) is the author/funder, who has granted bioRxiv a license to display the preprint in perpetuity.
It is made available under a CC-BY-NC-ND 4.0 International license.
9. Maynard-Smith J, Haigh J. The hitch-hiking effect of a favourable gene. Genetics
Research. 1974;23(5-6):23–35.
10. Ellegren H, Galtier N. Determinants of genetic diversity. Nature Reviews
Genetics. 2016;17(6):422–. Available from:
http://dx.doi.org/10.1038/nrg.2016.58.
11. Chen J, Glémin S, Lascoux M. Genetic Diversity and the Efficacy of Purifying
Selection across Plant and Animal Species. Molecular Biology and Evolution.
2017;34(6):1417–1428. Available from:
http://dx.doi.org/10.1093/molbev/msx088.
12. Hudson RR, Kaplan NL. Deleterious background selection with recombination.
Genetics. 1995;141(4):1605–1617. Available from:
http://www.genetics.org/content/141/4/1605.
13. Corbett-Detig RB, Hartl DL, Sackton TB. Natural Selection Constrains Neutral
Diversity across A Wide Range of Species. PLOS Biology. 2015 04;13(4):1–25.
Available from: https://doi.org/10.1371/journal.pbio.1002112.
14. Coop G. Does linked selection explain the narrow range of genetic diversity
across species? bioRxiv. 2016;Available from:
https://www.biorxiv.org/content/early/2016/03/07/042598.
15. Espeland M, Breinholt J, Willmott KR, Warren AD, Vila R, Toussaint EFA,
et al. A Comprehensive and Dated Phylogenomic Analysis of Butterflies. Current
Biology. 2018;28(5):770–778. Available from:
https://doi.org/10.1016/j.cub.2018.01.061.
16. Ehrlich AH, Ehrlich PR. Reproductive strategies in the butterflies: I. Mating
frequency, plugging, and egg number. Journal of the Kansas Entomological
Society. 1978;p. 666–697.
17. Davey JW, Chouteau M, Barker SL, Maroja L, Baxter SW, Simpson F, et al.
Major Improvements to the Heliconius melpomene Genome Assembly Used to
Confirm 10 Chromosome Fusion Events in 6 Million Years of Butterfly Evolution.
G3: Genes, Genomes, Genetics. 2016;6(3):695–708. Available from:
http://www.g3journal.org/content/6/3/695.
18. Nei M. Genetic distance between populations. The American Naturalist.
1972;106(949):283–292. Available from: https://doi.org/10.1086/282771.
19. Welch JJ, Eyre-Walker A, Waxman D. Divergence and Polymorphism Under the
Nearly Neutral Theory of Molecular Evolution. Journal of Molecular Evolution.
2008;67(4):418–426. Available from:
https://doi.org/10.1007/s00239-008-9146-9.
20. Keightley PD, Pinharanda A, Ness RW, Simpson F, Dasmahapatra KK, Mallet J,
et al. Estimation of the Spontaneous Mutation Rate in Heliconius melpomene.
Molecular Biology and Evolution. 2015;32(1):239–243. Available from:
http://dx.doi.org/10.1093/molbev/msu302.
21. Charlesworth B, Morgan MT, Charlesworth D. The effect of deleterious
mutations on neutral molecular variation. Genetics. 1993;134(4):1289–1303.
Available from: http://www.genetics.org/content/134/4/1289.
22. Ohta T. Slightly Deleterious Mutant Substitutions in Evolution. Nature.
1973;246(1):96–98. Available from: https://doi.org/10.1038/246096a0.
14/25bioRxiv preprint first posted online Jan. 29, 2019; doi: http://dx.doi.org/10.1101/534123. The copyright holder for this preprint
(which was not peer-reviewed) is the author/funder, who has granted bioRxiv a license to display the preprint in perpetuity.
It is made available under a CC-BY-NC-ND 4.0 International license.
23. Loewe L, Charlesworth B. Inferring the distribution of mutational effects on
fitness in Drosophila. Biology Letters. 2006;2(3):426–430.
24. Hewitt G. The genetic legacy of the Quaternary ice ages. Nature.
2000;405:907–913.
25. Schmitt T. Molecular biogeography of Europe: Pleistocene cycles and postglacial
trends. Frontiers in Zoology. 2007 Apr;4(1):11. Available from:
https://doi.org/10.1186/1742-9994-4-11.
26. Jiggins FM. Male-Killing Wolbachia and Mitochondrial DNA: Selective Sweeps,
Hybrid Introgression and Parasite Population Dynamics. Genetics.
2003;164(1):5–12. Available from:
http://www.genetics.org/content/164/1/5.
27. Nabholz B, Glémin S, Galtier N. The erratic mitochondrial clock: variations of
mutation rate, not population size, affect mtDNA diversity across birds and
mammals. BMC Evolutionary Biology. 2009 Mar;9(1):54. Available from:
https://doi.org/10.1186/1471-2148-9-54.
28. Allio R, Donega S, Galtier N, Nabholz B. Large Variation in the Ratio of
Mitochondrial to Nuclear Mutation Rate across Animals: Implications for
Genetic Diversity and the Use of Mitochondrial DNA as a Molecular Marker.
Molecular Biology and Evolution. 2017;34(11):2762–2772. Available from:
http://dx.doi.org/10.1093/molbev/msx197.
29. Bazin E, Glémin S, Galtier N. Population Size Does Not Influence Mitochondrial
Genetic Diversity in Animals. Science. 2006;312(5773):570–572. Available from:
http://science.sciencemag.org/content/312/5773/570.
30. Barton NH. Genetic hitchhiking. Philosophical Transactions of the Royal Society
of London B: Biological Sciences. 2000;355(1403):1553–1562. Available from:
http://rstb.royalsocietypublishing.org/content/355/1403/1553.
31. Dincă V, Montagud S, Talavera G, Hernández-Roldán J, Munguira ML,
Garcı́a-Barros E, et al. DNA barcode reference library for Iberian butterflies
enables a continental-scale preview of potential cryptic diversit. Scientific Reports.
2015;5:12395. Available from: https://www.nature.com/articles/srep12395.
32. Bunnefeld L, Hearn J, Stone GN, Lohse K. Whole-genome data reveal the
complex history of a diverse ecological community. Proceedings of the National
Academy of Sciences. 2018;115(28):E6507–E6515. Available from:
http://www.pnas.org/content/115/28/E6507.
33. Talavera G, Lukhtanov VA, Rieppel L, Pierce NE, Vila R. In the shadow of
phylogenetic uncertainty: the recent diversification of the Lysandra butterflies
through chromosomal changes. Molecular Phylogenetics and Evolution.
2013;69:469–478.
34. Sjödin P, Kaj I, Krone S, Lascoux M, Nordborg M. On the Meaning and
Existence of an Effective Population Size. Genetics. 2005;169(2):1061–1070.
Available from: http://www.genetics.org/content/169/2/1061.
35. Bunnefeld L, Frantz LAF, Lohse K. Inferring bottlenecks from genome-wide
samples of short sequence blocks. Genetics. 2015;201(3):1157–1169. Available
from: http://www.genetics.org/content/201/3/1157.
15/25bioRxiv preprint first posted online Jan. 29, 2019; doi: http://dx.doi.org/10.1101/534123. The copyright holder for this preprint
(which was not peer-reviewed) is the author/funder, who has granted bioRxiv a license to display the preprint in perpetuity.
It is made available under a CC-BY-NC-ND 4.0 International license.
36. Brüniche-Olsen A, Kellner KF, Anderson CJ, DeWoody JA. Runs of
homozygosity have utility in mammalian conservation and evolutionary studies.
Conservation Genetics. 2018 Dec;19(6):1295–1307. Available from:
https://doi.org/10.1007/s10592-018-1099-y.
37. Begun DJ, Aquadro CF. Levels of naturally occurring DNA polymorphism
correlate with recombination rates in D. melanogaster. Nature.
1992;356(1):519–520. Available from: https://doi.org/10.1038.
38. Martin SH, Möst M, Palmer WJ, Salazar C, McMillan WO, Jiggins FM, et al.
Natural Selection and Genetic Diversity in the Butterfly Heliconius melpomene.
Genetics. 2016;203(1):525–541. Available from:
http://www.genetics.org/content/203/1/525.
39. Ryan S, Lombaert E, Espeset A, Vila R, Talavera G, Dinca VE, et al. Global
invasion history of the world’s most abundant pest butterfly: a citizen science
population genomics study. 2018 12;.
40. Hill JA, Neethiraj R, Rastas P, Clark N, Morehouse N, de la Paz
Celorio-Mancera M, et al. Cryptic, extensive and non-random chromosome
reorganization revealed by a butterfly chromonome. bioRxiv. 2018;Available from:
https://www.biorxiv.org/content/early/2018/03/02/233700.
41. Šı́chová J, Ohno M, Dincă V, Watanabe M, Sahara K, Marec F. Fissions, fusions,
and translocations shaped the karyotype and multiple sex chromosome
constitution of the northeast-Asian wood white butterfly, Leptidea amurensis.
Biological Journal of the Linnean Society. 2016;118(3):457–471. Available from:
http://dx.doi.org/10.1111/bij.12756.
42. Talla V, Suh A, Kalsoom F, Dincă V, Vila R, Friberg M, et al. Rapid Increase in
Genome Size as a Consequence of Transposable Element Hyperactivity in
Wood-White (Leptidea) Butterflies. Genome Biology and Evolution.
2017;9(10):2491–2505. Available from:
http://dx.doi.org/10.1093/gbe/evx163.
43. Lynch M, Conery JS. The Origins of Genome Complexity. Science.
2003;302(5649):1401–1404. Available from:
http://science.sciencemag.org/content/302/5649/1401.
44. Wiehe TH, Stephan W. Analysis of a genetic hitchhiking model, and its
application to DNA polymorphism data from Drosophila melanogaster. Molecular
Biology and Evolution. 1993;10(4):842–854. Available from:
http://dx.doi.org/10.1093/oxfordjournals.molbev.a040046.
45. Coop G, Ralph P. Patterns of Neutral Diversity Under General Models of
Selective Sweeps. Genetics. 2012;192(1):205–224. Available from:
http://www.genetics.org/content/192/1/205.
46. Berg JJ, Coop G. A Coalescent Model for a Sweep of a Unique Standing Variant.
Genetics. 2015;201(2):707–725. Available from:
http://www.genetics.org/content/201/2/707.
47. Barton NH. Linkage and the limits to natural selection. Genetics.
1995;140(2):821–841. Available from:
http://www.genetics.org/content/140/2/821.
16/25bioRxiv preprint first posted online Jan. 29, 2019; doi: http://dx.doi.org/10.1101/534123. The copyright holder for this preprint
(which was not peer-reviewed) is the author/funder, who has granted bioRxiv a license to display the preprint in perpetuity.
It is made available under a CC-BY-NC-ND 4.0 International license.
48. LI J, LI H, JAKOBSSON M, LI S, SJÖDIN P, LASCOUX M. Joint analysis of
demography and selection in population genetics: where do we stand and where
could we go? Molecular Ecology. 2012;21(1):28–44. Available from: https:
//onlinelibrary.wiley.com/doi/abs/10.1111/j.1365-294X.2011.05308.x.
49. Andrews S. FastQC a quality-control tool for high-throughput sequence data;
2015. Available from:
http://www.bioinformatics.babraham.ac.uk/projects/fastqc/.
50. Ewels P, Magnusson M, Lundin S, Käller M. MultiQC: summarize analysis
results for multiple tools and samples in a single report. Bioinformatics.
2016;32(19):3047–3048. Available from:
http://dx.doi.org/10.1093/bioinformatics/btw354.
51. Bolger AM, Lohse M, Usadel B. Trimmomatic: a flexible trimmer for Illumina
sequence data. Bioinformatics. 2014;30(15):2114–2120. Available from:
http://dx.doi.org/10.1093/bioinformatics/btu170.
52. Haas BJ, Papanicolaou A, Yassour M, Grabherr M, Blood PD, Bowden J, et al.
De novo transcript sequence reconstruction from RNA-seq using the Trinity
platform for reference generation and analysis. Nature Protocols. 2013 Jul;8:1494
EP –. Available from: https://doi.org/10.1038/nprot.2013.084.
53. Simão FA, Waterhouse RM, Ioannidis P, Kriventseva EV, Zdobnov EM. BUSCO:
assessing genome assembly and annotation completeness with single-copy
orthologs. Bioinformatics. 2015;31(19):3210–3212. Available from:
http://dx.doi.org/10.1093/bioinformatics/btv351.
54. Haas B, Papanicolaou A. Transdecoder (Find Coding Regions Within
Transcripts);. Available from:
https://github.com/TransDecoder/TransDecoder/wiki.
55. Altschul SF, Gish W, Miller W, Myers EW, Lipman DJ. Basic local alignment
search tool. Journal of Molecular Biology. 1990;215(3):403 – 410. Available from:
http://www.sciencedirect.com/science/article/pii/S0022283605803602.
56. Eddy SR, the HMMER development team. HMMER: biosequence analysis using
profile hidden Markov models; 2018. Available from: http://hmmer.org/.
57. Li H. Aligning sequence reads, clone sequences and assembly contigs with
BWA-MEM; 2013. .
58. McKenna A, Hanna M, Banks E, Sivachenko A, Cibulskis K, Kernytsky A, et al.
The Genome Analysis Toolkit: A MapReduce framework for analyzing
next-generation DNA sequencing data. Genome Research. 2010;20(9):1297–1303.
Available from: http://genome.cshlp.org/content/20/9/1297.abstract.
59. Quinlan AR, Hall IM. BEDTools: a flexible suite of utilities for comparing
genomic features. Bioinformatics. 2010;26(6):841–842. Available from:
http://dx.doi.org/10.1093/bioinformatics/btq033.
60. Garrison E, Marth G. Haplotype-based variant detection from short-read
sequencing. ArXiv e-prints. 2012 Jul;.
61. Emms DM, Kelly S. OrthoFinder: solving fundamental biases in whole genome
comparisons dramatically improves orthogroup inference accuracy. Genome
Biology. 2015 Aug;16(1):157. Available from:
https://doi.org/10.1186/s13059-015-0721-2.
17/25You can also read