The Development of Chinese Gas Pricing: Drivers, Challenges and Implications for Demand - Oxford Institute for ...
←
→
Page content transcription
If your browser does not render page correctly, please read the page content below

July 2014

                      The Development of
                     Chinese Gas Pricing:
                    Drivers, Challenges and Implications for Demand

                                                          Michael Chen

OIES PAPER: NG 89                           OIES Visiting Research Fellow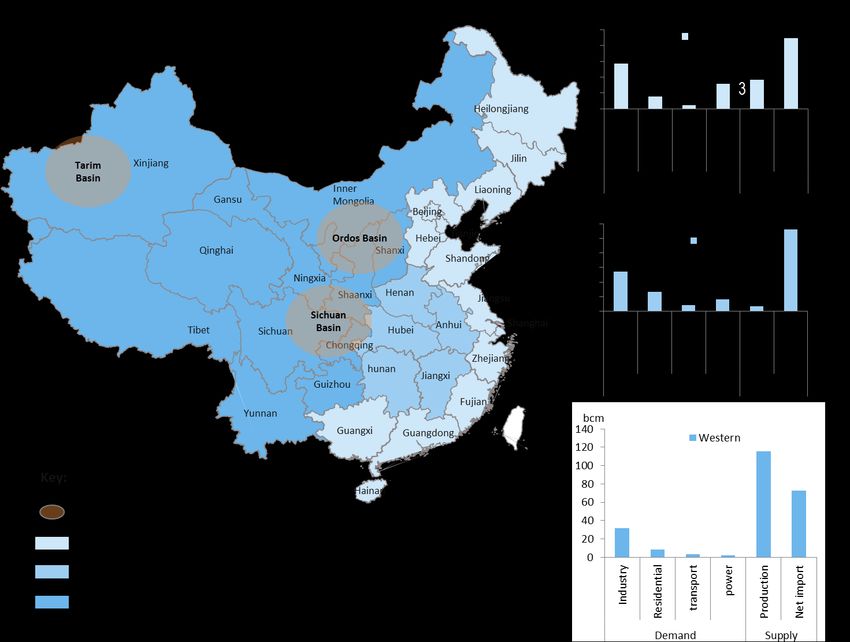
The contents of this paper are the author’s sole responsibility. They do not
          necessarily represent the views of the Oxford Institute for Energy Studies or any of
                                              its members.

                                           Copyright © 2014

                                 Oxford Institute for Energy Studies

                                   (Registered Charity, No. 286084)

This publication may be reproduced in part for educational or non-profit purposes without special
permission from the copyright holder, provided acknowledgment of the source is made. No use of this
publication may be made for resale or for any other commercial purpose whatsoever without prior
permission in writing from the Oxford Institute for Energy Studies.

                                                    ISBN

                                          978-1-78467-007-8

July 2014: The Development of Chinese Gas Pricing
                                                                                                 1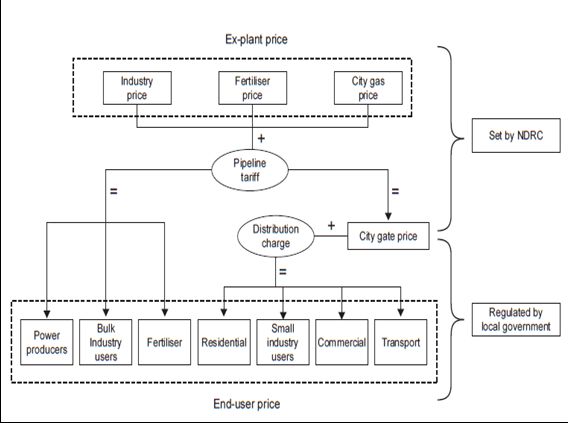
Preface
The spectacular growth of the Chinese economy since the early 2000s is a phenomenon familiar to all
with an interest in the global economy. Clearly its impact on commodity markets in general has been
both significant and observable. While China’s consumption of natural gas grew dramatically in the
2000s it was only in the second half of that decade that demand began to significantly outstrip
domestic production, requiring pipeline and LNG import infrastructure and supply lines to be put in
place. With pipeline imports secured from Myanmar, Turkmenistan and Central Asia and more
recently East Siberia, as well as a range of LNG suppliers, China is rapidly becoming ‘connected’ to a
portfolio of international supplies. As its demand growth increases, the scale of its import
requirements will influence both regional and global trade flow dynamics.

The vast geographic extent of China, the dispersion of its several gas producing regions and the
location of import pipeline and LNG facilities, relative to centres of consumption, raise the related
challenges of providing sufficient connecting pipeline infrastructure and a rational framework for city
gate gas prices which reflect border prices and transportation costs.

This paper by Michael Chen describes, within the context of China’s continued rapid gas sector
development, the evolution and current status of Chinese gas price reform, which establishes city
gate benchmark prices, most notably at Shanghai. These provide the basis on which sectoral prices
are determined for consumption and well head prices at the various producing regions. The paper
also discusses the likely future path of pricing evolution and identifies the likely response of different
demand sectors in various regions within China, both to price levels and supply availability.

On the OIES Natural Gas Research Programme we frequently acknowledge the increasing
importance of understanding the key high growth Asian importing gas markets, and especially their
impact on other world regions through competition for supply and price arbitrage. I am therefore most
thankful to Michael for this very comprehensive paper which significantly progresses our
understanding of this highly important market in its continuing period of growth and transition.

Howard Rogers

Oxford, July 2014

July 2014: The Development of Chinese Gas Pricing                                                       2
Contents
Preface .................................................................................................................................................... 2
Introduction.............................................................................................................................................. 4
1. Chinese gas prices in the international context .................................................................................. 6
1.1 Chinese gas imports prices in comparison with international prices ................................................ 6
1.2 Major imports and pricing development ............................................................................................ 6
2. The structure and evolution of natural gas price regulation ................................................................ 9
2.1 Chinese pricing structure and key determinants ............................................................................... 9
2.2 The evolution of Chinese domestic pricing reform .......................................................................... 12
2.3 Regional variations in market fundamentals and pricing reform ..................................................... 16
2.4 Chinese gas price along value chains – A case study of Shanghai ............................................... 21
3. The drivers for change and the gas-pricing challenges .................................................................... 23
3.1 Key drivers ...................................................................................................................................... 23
3.2 Major pricing-reform challenges ...................................................................................................... 33
4. Implications of pricing developments for gas demand ...................................................................... 36
5. Summary and Conclusions ............................................................................................................... 42
Glossary ................................................................................................................................................ 45
Bibliography .......................................................................................................................................... 46

Figures and tables
Figure 1: Chinese import prices vs international prices, H2/2006 – 2013 .............................................. 6
Figure 2: Chinese pipeline imports and LNG prices, 2013 ..................................................................... 7
Figure 3: Chinese gas pricing structure ................................................................................................ 12
Figure 4: Evolution of Chinese gas pricing regulation ......................................................................... 13
Figure 5: Sectoral gas demand across the regions, 2011 .................................................................... 17
Figure 6: Provincial city-gate prices across the three main regions, July 2013 .................................... 18
Figure 7: End-user prices for the three main regions, 2013 ................................................................. 19
Figure 8: Gas prices and tariffs along value chains to Shanghai, 2013 ............................................... 22
Figure 9: Growth of gas share of total provincial energy consumption, 2006-2011 ............................ 23
Figure 10: Residential fuel prices across four major provinces/municipalities, 2013 ........................... 24
Figure 11: Fuel prices for industrial users across four major provinces/municipalities, 2013 .............. 25
Figure 12: Ratio of NGV gas price to gasoline price across major provinces/municipalities, 2013 ...... 26
Figure 13: Coal- and gas-fired power plants: tariffs, generation costs and utilization hours, 2013 ...... 27
Figure 14: Output and wellhead prices at the major gas basins ........................................................... 28
Figure 15: Growth of gas pipeline network across regions and share of national gas supply to cities 29
Figure 16: Dynamics of the relationship between regional reliance on gas, supply diversification and
willingness to pay .................................................................................................................................. 30
Figure 17: Seasonal demand and import prices, 2012 – 2013 ............................................................. 31
Figure 18: Growth of industrial gas price, gas consumption and urban income per capita, 2000 – 2013
.............................................................................................................................................................. 36
Figure 19: Sectoral gas demand and prices, 2000 – 2012 ................................................................... 37
Figure 20: End-user price by sector and new city-gate price ceilings, 2013 ........................................ 38
Figure 21: Regional city-gate price ceilings and delivered cost at coastal city gates, 2013 ................. 39
Figure 22: Elasticity of gas demand growth to GDP growth by region, 2000 – 2011 ........................... 39
Figure 23: Gas import cost curve, 2013 ................................................................................................ 41

Table 1: Regional pricing developments since July 2013 ..................................................................... 20

July 2014: The Development of Chinese Gas Pricing                                                                                                             3
Introduction

The evolution of global gas pricing has been shaped by far-reaching changes in regional market
fundamentals and project economics as well as higher competing fuel prices. In North America the
easing of difficulties in the inter-state gas trade at a time of supply abundance and a fragmented and
competitive production base gave rise to a liberalised market and the adoption of Henry Hub gas
trading hub in the late 1980s (Rogers and Stern, 2014). In 1996 the UK established the National
Balancing Point (NBP) as a reference price (or virtual trading hub) for gas-to-gas competition.
Similarly, competing gas trading hubs have been established in Continental Europe, resulting in the
negotiated reduction of the oil-indexed long-term contract price of gas and an increase in the number
of long-term contracts based on a hub-priced formula. In Asia, which accounts for 60% of global
short-term LNG consumption, the LNG trade has been based on the Japan Crude Cocktail (JCC) oil-
indexed price mechanism.

In North America and Europe, the evolution of gas prices from cost-plus to oil-related and finally to
spot and futures prices (formed at hubs and exchanges) suggests that liberalisation and the
introduction of competition can be considered a natural market development. As market structure and
organisation in gas-importing countries changes over time, domestic gas pricing becomes
increasingly subject to market forces – in other words, reflecting gas supply and demand as well as
opportunity cost at the margin. But at the same time it becomes a key determinant of international gas
pricing (Stern, 2012).

The evolution of international gas prices is of particular relevance for China as it enters a ‘golden age’
of natural gas. Rising incomes, rapid urbanisation, concerns about air pollution and increasing oil
prices have favoured the switch from oil and coal to natural gas. Gas consumption in China rose by
nearly seven times between 2000 and 2013 – from 25 Bcm/y to 168 Bcm/y. In 2012 China overtook
Iran to become the world’s third-largest gas consumer after the US and Russia; but despite double-
digit annual growth in gas consumption, only 16% of China’s population had access to piped gas,
while gas accounted for just 5.9% 1 of total primary energy supply. The many uncertainties
notwithstanding, the absolute growth potential is enormous: the China National Petroleum
Corporation (CNPC) predicts that Chinese gas demand will reach – and possibly exceed – 230 Bcm
by 2015 and soar to 400 Bcm in 20202.

The import dependency has been rising and reached 32% in 2013. Meanwhile, the enormous
potential for gas demand growth in China will be tempered, above all, by i) supply availability and
delivery infrastructure; ii) pricing mechanism and price level relative to other fuels and other Asian
LNG importers; and iii) government policy and funding to replace coal with gas.

Policymakers often have to strike a balance between providing affordable gas supplies to encourage
gas penetration and setting a price that will serve as an incentive for more domestic production and
higher import levels amid ever-growing demand. To accommodate increasingly diverse and costly
imports, the government introduced a pricing reform trial at the end of 2011; the aim was to replace
the fragmented, cost-plus onshore gas pricing regime with one that features China’s regional prices
based on netback market values of competitive fuels at Shanghai city gate, and indexation to oil
products. In July 2013 this approach was taken one step further in a nationwide reform that aims to

1
    It is expected to reach 6.5% in 2014 by National Energy Administration (NEA, 2014).

2
 On April 24, 2014, the State Council issued a statement approving the proposal by the National Development and Reform
Commission to establish a mechanism that would ensure the stability of long-term gas supply. That statement noted China’s
goal of achieving a gas supply capability of 400 Bcm – with an upside of 420 Bcm – by 2020 (State Council, 2014).

July 2014: The Development of Chinese Gas Pricing                                                                      4
index the price of incremental gas (the volume that exceeds gas supply in 2012 for non-residential sectors) at the city gate to LPG and fuel oil prices and the price of existing gas (2012 gas supply) will converge with the incremental price by the end of 2015. By moving the pricing point downstream from the wellhead to the city gate, the government is attempting to allow market forces to play a bigger role in determining the level of domestic upstream investment and the volume of imports. Put another way, it expects more liquidity to be created and the nascent gas market to be developed in a sustainable and affordable manner. The Chinese gas sector and energy mix is undergoing a profound transformation. On the supply side, the gradual emergence of domestic unconventional gas, the ramping up of China’s conventional gas output as a result of higher domestic prices and pipeline imports from Central Asia (and Russia towards the end of 2010s) all coincide with additional Australian LNG supplies, US LNG exports to Asian markets in the medium term and the major expansion of East African and other frontier gas exports that is expected towards the end of this decade. On the demand side, the uncertainty of timing and pace of nuclear restarts in Japan and newly emerging Asian LNG importers pose significant competition particularly for Chinese LNG imports, which are being encouraged by ambitious government plans to combat pollution. Oil price volatility, the growing internationalisation of pricing due to the expansion of the LNG trade and liberalisation and competition among emerging Asian importers suggest Asian pricing dynamics are set to change. Given this complex picture, understanding the evolution of Chinese gas price formation is as important as comprehending the price level. This paper addresses both the level and formation mechanism of the Chinese gas pricing. At the same time, it critically assesses the drivers of the development of Chinese gas pricing, as well as the challenges and implications for demand. Chapter 1 puts Chinese domestic and import prices into the context of major regional prices. Chapter 2 reviews the evolution and structure of China’s pricing mechanisms with reference across the various regions. Chapter 3 looks in detail at the drivers for change in, and the challenges faced by, Chinese gas pricing. Chapter 4 examines the impact of Chinese gas pricing on demand. Chapter 5 provides a summary and conclusions. July 2014: The Development of Chinese Gas Pricing 5
1. Chinese gas prices in the international context

1.1 Chinese gas imports prices in comparison with international prices
Figure 1 shows Chinese gas import prices and key regional gas reference prices for the period June
2006 (when China started to import LNG) to 2013. China’s gas import dependence reached 32% in
2013, compared with just 2% in 2006. Over the same period, LNG import sources increased from just
one (Australia) to include another 15 countries. The average Chinese LNG import price exceeded the
NBP in 2012 and was around two-thirds of the average Japanese LNG import price. At the same time,
the price of imports from Turkmenistan via the West-East Pipeline (WEP) II overtook that of LNG
imports in 2012 – reaching a level of around 85% of oil-linked contract prices at the German border.

Figure 1: Chinese import prices vs international prices, H2/2006 – 2013

    Sources: China Customs Statistics, IMF, Rogers and Stern (2014).

1.2 Major imports and pricing development
While the Chinese gas import price has risen significantly in recent years, the range of prices is wide,
and a substantial gap remains between the domestic wellhead and import price. Figure 2 below
compares the domestic wellhead price of gas from the Ordos Basin (which supplies 20% of Chinese
demand) with the prices of pipe and LNG imports (24%). In 2013 the wellhead gas price at Ordos
Basin was slightly more than half the weighted average import price and 50% higher than that of
Australian and Indonesian LNG imports, which started in the mid-2000s and now constitute 33% of

July 2014: The Development of Chinese Gas Pricing                                                     6
total LNG imports3. In 2013, pipeline gas imports surpassed LNG imports, accounting for 53% of the
aggregate imports.
Figure 2: Chinese pipeline imports and LNG prices, 2013
Source: China Custom Statistics, NDRC, author’s estimate
China received around 28 Bcm of Central Asian pipeline 4 gas imports in 2013 (or 17% of total gas
demand) with 25 Bcm coming from Turkmenistan (46% of total Chinese gas imports). Supplies from
Turkmenistan are to reach 65 Bcm by 2020 under a gas contract agreed and signed in early
September 2013. Uzbekistan signed a framework agreement in June 2010 under which it will feed 10
Bcm/y into the Central Asian Pipeline. It has supplied more than 3 Bcm to China since August 2012
and might increase the total volume to 7 Bcm by 2015. Kazakhstan has also agreed to supply 10
Bcm/y to China. By 2020, total Central Asian pipeline import capacity could reach 90 Bcm/y and could
account for 23% of Chinese gas supply, assuming the 400 Bcm/y supply target set by the government
is met.
Oil-indexed Turkmen gas at the Chinese border costs more (around $9.6/MMBtu in 2013) than other
Central Asian contracted gas, owing partly to transit fees that are paid to Uzbekistan and Kazakhstan.
In 2013 the Myanmar Gas Pipeline (12 Bcm/y capacity) started to supply various regions in Myanmar
as well as Guangxi and Yunnan regions of China and is expected to deliver 2.5 Bcm by the end of
2014. The price of gas supplied via this pipeline is higher than that of Turkmen gas as it is sourced
from the offshore Shwe field and because of the harsh terrain that the pipeline has to cross en route
to China. It provides a critical supplementary gas supply for China’s southwestern gas market.
3
Those early contracts were agreed at prices far below subsequent market levels (see below).
4
Line C (which has a design capacity of 25 Bcm/y by the end of 2015) of the Central Asian Pipeline network has started to
supply gas to China in early June 2014 on top of line A and B (30 Bcm/y) which have been transporting to West East Pipeline 2
(30bcm/y) within China. Construction of Line D (25 Bcm) is expected to start in 2015. West East Pipeline 3 (30bcm/y) is
scheduled to be completed in 2014 to transport gas from line C.
July 2014: The Development of Chinese Gas Pricing 7China and Russia finally signed the 30 year agreement for importing 38 Bcm/y gas deal from Eastern Siberia pipeline (with design capacity of 61 Bcm/y) to the border of North-East China on 21 May 2014 with a widely reported value of the deal at around $400 billion. This could imply a price of around $10/MMBtu though this depends also on the reported $25 billion upfront payment that China will pay and calorific value of gas transported among other factors (Interfax, 2014). However, this deal could potentially enhance the chances of agreeing on a western route (30 Bcm/y) which together with the Eastern route, LNG options and potential non-Gazprom exports could imply Russian capacity to supply gas to China in the 2020s to reach more than 100 Bcm/y or around a quarter of Chinese gas supply, provided field development is on track and a favourable industry policy is implemented. In the 2020s, Russian gas imports could provide a firm Northeast gas corridor for China and its price could potentially become an important benchmark for the gas market in Northeastern China. However, Central Asian supply which provides a firm Northwestern gas corridor for China will continue to be the main driver of pipeline import growth and a significant benchmark in determining the Chinese gas import price before 2020. In 2013, China imported 23 Bcm of LNG (14% of total Chinese gas demand). Cheaper LNG supplies from Australia and Indonesia under contracts from the mid-2000s still accounted for 33% of total gas imports. Long-term oil-indexed Qatari LNG with a ‘slope’ of more than 17% accounted for 38% of LNG imports in 2013, while Malaysian LNG with a slope of 7-10% constituted 15%5 .The majority of current LNG imports are based on long-term JCC-indexed contracts, while medium and spot cargos account for less than 15% of total LNG imports, despite increasing in recent years. By 2020, China’s total regas capacity is expected to be over 100 Bcm/y6, accounting for a quarter of China’s total supply capacity with contracted volumes increasingly from emerging LNG plays of Australia, North America and East Africa. The weighted average price of pipeline imports (including VAT) was around $10.4/MMBtu, close to that of LNG ($10.5/MMBtu) in 2013. With the arrival of more expensive Australian LNG, which could account for almost 40% of aggregate LNG imports in 2015-16, the weighted average price of LNG imports is expected to remain higher than that of pipeline imports at the border. However, some LNG could remain competitive at the city gate vis-à-vis pipeline imports as it does not need to be transported long distance to reach end-users and it is used for peak-shaving in power generation and transport to replace oil products. 5 The ‘slope’ of a Pacific LNG contract refers to the degree of indexation and is a measure of how much the gas price changes relative to a change in the oil price (Stern, 2012). 6 However, there is great uncertainty over both the future sanctioned terminals and the potential volume to be contracted as they depend on each other and the price expectation. July 2014: The Development of Chinese Gas Pricing 8
2. The structure and evolution of natural gas price regulation

2.1 Chinese pricing structure and key determinants
Domestic gas prices in China had traditionally been regulated at each point along the value chain.
From well-head to city gate terminals, gas prices (well-head prices, processing fees and
transportation tariffs) are regulated by central government and administered by National Development
and Reform Commission (NDRC). Local distribution charges (including connection fees) and end-user
prices are regulated by provincial and local governments (Figure 3).

The degree of regulation usually varies according to the source of the gas, the means and routes of
transportation and the type of end-use of the specific region in question. More recently, in order to
limit surging incremental demand, which is increasingly being met by imports that cost more than
domestic gas, the government has been attempting to link the price of incremental gas volume (in
excess of 2012 volumes for non-residential sectors) to the import prices of alternatives (LPG and fuel
oil). This reform applies only to pipeline imports and onshore domestic gas production (accounting for
73% of demand). Domestic conventional onshore gas is the predominant source of gas (more than
85% of domestic gas output).

Ex-plant prices, which include wellhead prices and processing fees, have been traditionally set by
the NDRC for each well and each region in the case of onshore conventional gas. They are based on
the type of end-user – for example, industrial, residential and the fertilizer and power sectors, which
are supplied (via different pipelines) (Ni, 2009).

Consumer affordability has been the key driver of ex-plant price regulation; but the main determinant
is the production cost, which depends on the source of local gas. Well-head prices are calculated
from a base price (which takes into account project cost, taxes and loan repayments) as well as
processing fees and an appropriate margin for producers. Processing fees are determined by the
quality of the gas and subject to negotiations between the NDRC and producers. The ex-factory price
serves as ‘price guidance’ against which producers and buyers can negotiate a final price within a +/-
10% band. It applies only to conventional gas since the price of unconventional gas price is based on
market rates (see below).

Transmission tariffs (long distance and inter-regional) were set by the NDRC and vary according
to pipeline and city terminal. Besides taking into account consumer affordability in the various regions,
the tariff is determined mainly by the date of construction of the pipeline and the distance of the gas
source to each city gate; it is based on the cost of and payback period for project construction and
operation plus a margin for the operator (‘cost plus reasonable profit’) – namely, PetroChina, Sinopec
or the China National Offshore Oil Corporation (CNOOC). The most recent tariff increase was in April
2010, when the NDRC increased some tariffs by $0.32/MMBtu. The tariff for pipelines built before
1995 is based on distance; however, for long-distance pipelines built from the mid-1990s onwards,
both ex-plant prices and transmission tariffs have been set according to both distance and end-user.
Current city gate pricing regulation means that the transmission tariff would be the difference between
city gate and well-head prices.

City-gate prices for each sector in each city or region are normally calculated as the ex-plant price
plus the pipeline tariff. (Previously, a matrix of ex-plant prices for each gas field and each sector and
transportation tariffs for each pipeline for each city was used to determine those prices.) It is on the
basis of the city-gate prices that each provincial government sets retail prices or the sales prices of
local distribution companies, which, again, vary from sector to sector. At the end of 2011 the NDRC
attempted to introduce net-back pricing in Guangdong and Guangxi provinces to gradually replace
cost-plus wellhead price controls with a single regulated price ceiling for all piped gas supply to the
provinces, thereby moving the pricing point downstream from the wellhead to the city gate. In July
2013 the NDRC announced city-gate price ceilings for 29 provinces and municipalities with the price

July 2014: The Development of Chinese Gas Pricing                                                      9
of incremental gas volumes (in excess of 2012 volumes for non-residential sectors) linked to LPG and
fuel-oil import prices while the price of existing gas volumes (2012 gas sales for non-residential
sectors) will also follow prices of LPG and fuel oil imports by 2015. This implies a gradual replacement
of cost plus pricing for city gate by net back pricing.

End-user prices for bulk users are essentially city-gate prices for direct customers (that is, those
who do not buy from local gas distributors), including bulk industrial users, fertilizer producers and
power plants. Gas used as an industrial fuel and in chemicals production (including small industrial
users that buy gas from local gas distributors) accounts for the largest share of gas consumption –
around 47% in 2011. The price of such gas is increasingly subject to negotiations between industry
users and producers. Traditionally, fertilizer producers have paid the lowest price – 30% less than
small industrial users – to facilitate the development of the agricultural sector. Gas use in the power
sector amounted to 30.2 Bcm or 18% of total gas consumption in 2013. The price of such gas is
determined by the provincial government and varies from region to region, depending on the source
of the gas and the on-grid electricity tariff, which has yet to favour gas relative to other fuels.

Local distribution fees are usually paid to provincial grid or local distribution (e.g. city gas)
companies that deliver gas to end-users through infrastructure that they own and operate, including
medium- and low-pressure pipelines and processing plants. Different pricing methods are used for
residential and commercial/industrial customers and various additional local charges apply. For
residential customers, there is a flat connection fee based on the types of gas appliance in the
property, such as stoves, water heaters and boilers. Many local governments have stakes in joint
ventures with gas distributors in city gas distribution projects. It is in their interest to facilitate the
eventual pass-through of gas costs to end-users.

 End-user prices beyond the city gate are regulated by provincial and local governments. They are
based on the cost of supply (the city-gate price set by the NDRC) plus a local distribution fee
(including a cost-plus margin). They also take into account the following factors: the type of end-user,
the user’s ability to pay, the competitiveness of gas against other fuels, gas demand structure and
efficiency, and a cost estimate for converting coal gas distribution networks to natural gas. In theory,
when the NDRC adjusts ex-plant prices, provincial and local pricing bureaux pass costs downstream
by raising retail prices; if the wellhead price of a source crosses a threshold set by the province, the
project developer submits a proposal for a price change to the local pricing bureau for review,
adjustment and approval. In practice, making price adjustments downstream following increases in
upstream tariffs is a slow process: for example, it normally takes longer to review a price change for
the residential sector than for other end-user groups since a public hearing is usually required. This
has squeezed the distribution margin of city gas distributors, which tend to be private companies.
End-user prices vary significantly from location to location and from sector to sector (according to
local development priorities). The wealthier coastal regions, which are located a long way from key
inland sources of gas, pay higher prices.

Offshore gas prices at the wellhead are not strictly regulated by the NDRC as offshore gas accounts
for only 10% of domestic gas output and offshore acreage has been open to foreign cooperation since
the 1980s – hence the need for a more market-driven pricing system. CNOOC holds sole marketing
rights and buys gas from its production-sharing contract partners at the wellhead. It negotiates the
sale price on a project-by-project basis and revises it (for some companies) annually. At the same
time, CNOOC’s listed E&P subsidiary (CNOOC Ltd) negotiates with the group’s wholly owned
downstream subsidiary, CNOOC Gas and Power Group (which is in charge of the group’s gas
distribution and gas-fired power plants), as well as local and national regulators.

July 2014: The Development of Chinese Gas Pricing                                                        10
Unconventional gas7 prices are not included in the NDRC’s netback pricing regime. Prices for coal-
bed methane (CBM), coal-to-gas and shale gas remain unregulated and are determined in
negotiations between the seller and the buyer – unless, that is, the gas is pumped into a long-distance
pipeline and then transported and sold together with conventional onshore or imported pipeline gas.
Such gas is subject to the regulated city-gate price ceilings announced in July 2013. Most CBM
projects supply small local markets directly but are increasingly seeking richer markets in the coastal
region. The government provides a subsidy of $0.8/MMBtu for CBM production as well as other
incentives.

Pipeline import prices for Turkmen gas are indexed to oil prices paid by PetroChina at the Chinese
border while the recent Sino-Russian pipeline gas deal is also believed to be indexed to crude and
also oil products prices. The mechanism of netback to the wellhead was introduced in July 2013 for
incremental gas to reflect growing pipeline imports and the increasing role of alternative fuel
substitutes for gas.

LNG imports prices are determined at bilateral negotiations between suppliers and importers. The
importers, primarily NOCs, are obliged to negotiate terms for the resale of LNG on a wholesale basis
(i.e., to distribution companies) or directly to large industrial or power companies (Higashi, 2009). The
pricing terms for these negotiations have generally not been bound 8 by regulated city-gate prices as it
mainly applies to onshore conventional gas and pipeline imports. However, the sale of LNG (after
regasification) via long distance pipeline would need to follow the uniform city gate price regulation in
the case where LNG seller and pipeline transmission company are the same market entity. The
regasified price9 to the distributors normally requires the local pricing bureau’s approval.

7
 Tight gas is regarded as conventional gas in China. Total output amounted to 30 Bcm in 2012 and accounted for more than a
quarter of domestic gas production.

8
 The city gas operator would find it increasingly difficult to differentiate gas source from LNG (after regasification) and pipeline
imports as pipeline connectivity accelerates,

9
    It normally includes storage cost and local transmission tariff (from LNG terminal to city gate in order to feed into local grids)

July 2014: The Development of Chinese Gas Pricing                                                                                        11
Figure 3: Chinese gas pricing structure Source: Stern (2012) – Figure 10.1, p. 311. 2.2 The evolution of Chinese domestic pricing reform Figure 4 below shows that to date, Chinese gas price regulation has evolved in five stages that are closely related to China’s economic development. July 2014: The Development of Chinese Gas Pricing 12
Figure 4: Evolution of Chinese gas pricing regulation

                                                                                                               Exchange and
                                                                                                                   hubs
                                                                                        Net –back trial and
                                                                                           nationwide
                                                                                         implementation
                                                                  Dual pricing
                                                                  replaced by
                                                                  tiered price

                                            Government set
                                            & guided pricing

                      Dual pricing

     Government set
         price

         1957-                       1992                  2005                  2011    2013           2015        2020+
         1982

Note: The government-set price is a fixed price set by the pricing authority, while the government-guided price is
the benchmark price set by the pricing authority but open to negotiation by producers and wholesalers.

Sources: Wang, 2007; author’s own analysis.

Stages of pricing regulation in China:

1)       Until 1982 the government set gas production quotas and prices.

2)      To reverse the decline in gas production and to encourage investment in gas E&P, the
government raised the ex-plant price and adopted a ‘dual pricing’ system (1982 – 1992); under that
system, companies were allowed to produce gas beyond the quota set by the government, although
the price of such gas was higher than that within the quota. Onshore well-head prices were set
according to end use from 1992 onwards.

3)       From 1993 to 2005 the gas pricing system comprised both a government-set price and a
government-guided price as the Chinese economy moved towards marketization. A benchmark
wellhead price was set by the government, and E&P companies were allowed to raise or lower
benchmark prices for marketed gas by up to 10%. At the same time, the wellhead price and
processing fees were combined to form the ex-plant price. Nevertheless, ex-plant prices were
relatively low until the late 1990s because associated gas dominated production and natural gas use
was limited. Sichuan province was a forerunner of the nationwide pricing reform as dual pricing
(except for fertilizers) was abolished there in 1997.

4)      In December 2005 the NDRC implemented a guided-pricing system to replace the dual
pricing system. This simplified regime introduced two tiers for ex-plant prices for gas fields and

July 2014: The Development of Chinese Gas Pricing                                                                             13
combined residential, commercial and small industrial users in cities into ‘city gas consumption’. In principle, it allowed for an annual adjustment of the wellhead price for Tier 2 gas fields 10 (the plan was to allow the price of gas from Tier 1 gas fields to catch up with the price of gas from Tier 2 gas fields within three years), according to a five-year moving weighted-average price of crude oil, LPG and coal prices weighted 40%, 20% and 40%, respectively, and with the price adjustment not exceeding 8% annually. However, from 2005 onwards there was no price annual adjustment. The pricing reform of June 2010 abolished the ‘two-tiered pricing’ system for natural gas whose production began between 2006 and June 2010. Besides an increase of $0.93/MMBtu in the onshore wellhead price, the price range for onshore gas was expanded to allow producers and buyers to fix various natural gas prices based on ex-plant benchmark prices and to raise or lower benchmark prices by up to 10%. 5) The 2011 reform The fifth stage of the evolution of gas pricing regulation was towards netback pricing. Fragmented and uneven pricing regulation had created tensions among producers and distributors and posed challenges to encouraging more investment in production and infrastructure to meet demand as well as improve market access and connectivity between regions. Price adjustment had not caught up with rampant demand, which was growing at 20% annually, or the diversification of supplies. There was increasing need to reduce financial losses as a result of the difference between the domestic city-gate price and the Turkmen pipeline import price as well as to accommodate future imports. In December 2011, gas price reform introduced a netback pricing system, establishing one city gate price ceiling for each province, applying to all onshore piped gas supplies (LNG and unconventional gas are excluded), regardless of source or end use. Trials were launched in Guangdong and Guangxi provinces with the aim of eventually introducing such a system nationwide. The new pricing system is in stark contrast to the cost-plus system as it moves the pricing point downstream from the wellhead to city gate. While under the cost-plus system prices are based on production costs, city-gate prices are linked to market-determined oil-product prices (substitutable for gas). Taking into account the direction of major gas resource flows and transmission tariffs, the Shanghai city-gate price was selected to serve as the national city-gate benchmark price. This national city-gate benchmark price is linked to the prices of fuel and LPG weighted 60% and 40%, respectively. A price setting formula is: 10 Tier 1 comprises gas produced at the Chuanyu gas field, the Changqing and Qinghai oil fields and associated gas from the Xinjiang, Dagang, Liaohe and Zhongyuan oil fieldsIt accounts for 85% of total domestic gas production. Gas produced at all other fields is categorized as Tier 2. July 2014: The Development of Chinese Gas Pricing 14
H gas H gas
Pgas K ( Pfuel oil PLPG ) (1 R)
H fuel oil H LPG
Pgas — Natural gas city-gate price (inclusive of taxes) in Rmb/cm
K— Discount rate (0.9)
α, β— Weighted percentage of fuel oil and LPG (60% and 40%, respectively)
Pfuel oil, PLPG — Import price during the period in Rmb/kg
Hfuel oil,HLPG、Hgas — Heat content of fuel oil, LPG and natural gas (10,000 Mcal/kg, 12,000 Mcal/kg,
and 8,000 Mcal/kg, respectively)
R— Natural gas VAT rate (13%)
City-gate prices in Guangdong and Guangxi are based on the ‘Shanghai-hub price’, which takes into
account gas flows and transmission tariffs as well as social affordability in the two provinces with a
10% discount against a weighted-average of imported fuel oil (60%) and LPG (40%).
The 2013 reform and beyond
The move towards establishing a dynamic pricing adjustment mechanism that reflects gas-market
fundamentals and resource scarcity through linkage to the prices of alternative fuels was further
modified in June 2013 by the NDRC in acknowledgement of the huge annual growth of incremental
demand and its adverse fiscal impact. It announced the extension of the 2011 trial reform to 29
provinces and municipalities out of a total of 33. More important, tiered pricing for existing (2012) gas
(91% of the total volume in 2012) and incremental gas (in excess of the 2012 volume) was introduced
(excluding residential use).
Under the new pricing regime, each province will have two city-gate price ceilings: one that applies to
new (incremental) gas for non-residential users and the other to existing gas. For existing gas for non-
residential use, the increase will be no more than Rmb 0.4/m³ ($1.6/MMBtu) and for gas used to
produce fertilizers it will not exceed Rmb 0.25/m³ ($1/MMBtu). For incremental gas, the price will be
set at 85% of the import cost of alternative fuels (60% for fuel oil and 40% for LPG). The goal is to
increase gradually the price of existing gas so that it eventually equals that of incremental gas. The
NDRC has stressed that these prices will converge by the end of 2015. Currently, the price ceiling for
incremental gas is on average 40% higher than that of existing gas though there is great variation
across and within regions.
Provincial city-gate price ceilings are higher under this latest reform than under the 2011 reform. The
new tiered measures are recognized as transitory and the intention is to introduce netback pricing
nationwide for both existing and incremental gas use and target sectors that are more able to pay. At
the same time, it should be noted that tiered pricing for the residential sector has been implemented in
various cities since 2012 with considerable success and a deadline for nationwide implementation has
been set by NDRC (on 21 March, 2014) for the end of 2015 11 . Residential tiered gas pricing
implementation plans are gaining momentum in several munitipalities and provinces such as
Shanghai, Zhejiang and Shandong in 2014. If used on a larger scale, tiered pricing would enhance
efficiency, reduce cross-subsidies and improve distribution margins, thereby promoting a more
sustainable downstream market.
11
Climate and temperature vary significantly from region to region in China, which means diverse gas use in the residential
sector. For example, residents in northern China use far larger volumes of gas for heating than do residents in the south of
country.
July 2014: The Development of Chinese Gas Pricing 15However, a successful pricing reform would need to include policies aimed at encouraging investment
along the entire value chain and regulatory changes to allow increased participation of suppliers and
traders in the upstream and mid-stream, thereby better reflecting market signals and creating more
supply liquidity. As the implementation of the current net-back pricing model gathers momentum and
gas pipeline connectivity accelerates, prices for each province could start to be developed on a
'differential cost of supply' basis, provided third party access, storage and their charges are developed
and regulated effectively. This would be the point where China might gradually move to hub-based
pricing (at least for a portion of its supplies and facilitated by regional exchanges) in order to allow gas
to go to regions that have the highest demand and are most able to pay. In this way, the pricing
system could also reflect price of alternatives other than oil products. This, however, would depend on
the price and industry reforms of other fuels such as coal and electricity.
2.3 Regional variations in market fundamentals and pricing reform
There are huge variations in price levels and reform experience across regions 12 in China as it
consists of a set of regional markets, with different abilities to pay netback gas prices and different
fundamentals. The coastal and central regions combined account for 60% of national gas demand,
while the western region produces 60% of national gas supply. A diverse range of factors – including
production costs, accessibility and transport route, sectoral needs, local-government priorities and
economic affordability – all have a potential impact on pricing reform. Besides taking into account the
enormous regional differences in resource endowment and development needs, policymakers need to
strike a balance between providing affordable gas to encourage penetration and setting attractive
prices that will serve as an incentive for more domestic production and higher import levels.
Figure 5 below shows the variations in sectoral gas demand and net gas imports position across three
regions in 2011. Industry and power combined account for more than 70% of the coastal region’s gas
consumption (46% and 25%, respectively), while residential users make up 12% in the coastal region
compared with 22% in the central region. In the coastal provinces that are located above the Yangtse
River13, which are classified as ‘cold’ and ‘severely cold’ heating zones (where heating is required by
law), heating accounts for around 7% of aggregate gas demand compared with a national average of
2%. In the central region (where mostly hot summer, cold winter weather), industry (45%), residential
(22%) and power-sector (13%) usage accounts for more than 80% of gas consumption. On the other
hand, industry (61%), residential (16%) and transport (6%) uses of gas account for the majority of gas
consumption in western region (cold and severe cold weather).
The western region is a net exporter of gas to the central and coastal provinces: on average, it
exports more than 60% of indigenous supplies, although some provinces in the region import from
Central Asia, Myanmar or neighbouring provinces. It has China’s three top-producing basins – Ordos,
Sichuan and Tarim – which accounted for almost 60% of national gas production in 2012. The central
region imports almost 100% of its gas supplies from the western region and is a transit corridor for
Central Asian and western-region gas to the coast. The coastal region imports more than 70% of the
gas it consumes.
12
Regions can be classified in various ways – for example, based on similarities in sectoral demand and economic development status. Such
an approach is aimed at helping identify major regional differences; however, it could overlook some variations.
13
Namely, Shandong, Hebei, Beijing, Tianjin, Liaoning, Jilin and Heilongjiang.
July 2014: The Development of Chinese Gas Pricing 16Figure 5: Sectoral gas demand across the regions, 2011 Source: CEIC These enormous variations in demand and complex dynamics of gas flows imply that gas pricing is determined primarily by regional dynamics, which depend to a large extent on indigenous characteristics, market structure, type of industry and sustainability plans, among other factors. Sectoral emphases will differ across regions when gas policy and pricing reform and energy supply options (e.g., fuel mix and transit routes) are being considered. Coastal regions – especially those in the upper Yangtze River area – will continue to see growing demand for power and heating as the government is determined to replace all coal boilers with cleaner fuel such as gas by 2017 (which will mean an increase in demand of close to 50 Bcm). The central region will continue to experience urbanization and industry relocation from the coastal region as well as a boom in residential and industrial use. The arrival of Central Asian gas and enhanced regional pipeline connectivity will improve access to gas. The price of gas for industrial users will need to remain competitive in order to facilitate the development of industry. The western region will drive demand for gas used in transport owing to the relative abundance of indigenous gas – as will the coastal region, where the oil and gas price differential is more pronounced. Provincial or regional pricing development will have to take these sectoral growth differences into account. Figure 6 shows the variation across regions of the latest pricing ceilings set by NDRC for city gate prices which are highly dependent on distance from the gas source and the availability of gas besides price of fuel oil and LPG. In most western provinces, except Shanxi, the gas price is below the July 2014: The Development of Chinese Gas Pricing 17
national average as those provinces are, or are close to, major gas-producing areas (as well as being
closer to pipeline import sources). In the central region, which is a junction of various gas pipelines,
most city-gate prices are higher than the national average, while the price of incremental gas was
higher than the average price of imports in 2013. The same applies to the coastal region, whose
industrial development is more advanced and where the competition between gas and oil products is
stronger than in the other two regions.

Figure 6: Provincial city-gate prices across the three main regions, July 2013

Note: The original announced price ceilings were denoted in RMB per cubic metre. Annual exchange rate for
2013 from the People’s Bank of China and unit conversion factor for energy content (1 MMBtu=27 cubic metre) is
used for conversion of the prices into US dollar per MMBtu. It should be noted that there is considerable variation
in the value of energy content across gas fields in China and imports.

Source: NDRC (2013).

Similar trends are manifested in Figure 7 which shows the end use price across sector and three
regions in 2013. Many cities in richer coastal region are paying a higher gas price (above national
average) for industrial and residential users, while prices are higher in the central region than in the
western region which is closer to gas sources. The price of gas used for transport in Beijing is 50%
higher than in Xian (a western gas-producing region), while the residential gas price in coastal Fuzhou
is close to three times that in Urumqi. At the same time, there are large differences within regions –
the price of residential gas in Xian (in the western region) is 50% higher than in Urumqi. In general, it
is in regions that are resource-constrained and more affluent that gas prices are higher and more
closely linked to the prices of alternative fuels. Growing demand and affordability drive the average
gas price higher.

July 2014: The Development of Chinese Gas Pricing                                                                18
Figure 7: End-user prices for the three main regions, 2013

Source: CNPC (2014), CEIC, author’s calculation

The coastal region accounted for half of national consumption in 2011, while smaller demand centres
accounted for the remainder. This situation could change as pipeline infrastructure is being rapidly
developed. Table 1 below shows developments in gas pricing in the three main regions since the July
2013 nationwide pricing reform. There have been increases in non-residential city-gate prices –
especially for industry and transport – in some provinces, although the speed with which they have
been implemented and the extent to which they apply varies from province to province. Some
southern coastal provinces and central provinces have already experimented successfully with tiered
residential gas pricing while others are attempting to link wellhead to end-user prices. Moreover, on-
grid tariffs for gas-fired power generators were increased in September 2013 in several coastal and
central provinces to promote the use of gas in the fight against pollution. The recent rise in netback
city-gate prices nationwide for incremental gas will introduce a degree of uniformity in pricing, thereby
reducing regional price variations.

July 2014: The Development of Chinese Gas Pricing                                                      19
Table 1: Regional pricing developments since July 2013

Region     Province or municipality (% of           Developments          in     gas     Import
           national gas consumption)                pricing                              dependency

Coastal    Beijing (6%)                             July 2013 pricing reform             100%
                                                    adopted

           Shandong (4%)                            39% increase in price of             90%
                                                    incremental gas

                                                    Business tax replaced by VAT
                                                    on pipeline tariff

           Jiangsu (7%)                             Sichuan to Jiangsu pipeline          99%
                                                    tariff lowered

                                                    Several cities (Nanjing,
                                                    Xuzhou, Wuxi and Nantong)
                                                    took a progressive approach
                                                    to raising prices for the
                                                    residential sector; On-grid
                                                    tariff for gas-fired power plants
                                                    hiked by 5% in 2013

           Shanghai (4%)                            Non-residential gas price            95%
                                                    adjusted; residential price
                                                    hike by 21% in July 2014; to
                                                    introduce residential tiered
                                                    pricing

                                                    Differentiated pricing for bulk
                                                    industrial users and power
                                                    companies continued

                                                    On-grid tariff for gas-fired
                                                    power plants hiked by 5% in
                                                    2013

           Guangdong (9%)                           Launched first netback trial         100%
                                                    and on-grid tariff for gas-fired
                                                    power plants hikes by 5% in
                                                    2013

Central    Henan (4.2%)                             Most cities increased the non-       91%
                                                    residential price

                                                    Tiered residential pricing
                                                    implemented (with a view to
                                                    eventually linking the
                                                    residential price in effect to the
                                                    wellhead price )

           Hubei (2%)                               10 cities raised the non-            100%
                                                    residential price

                                                    On-grid tariff for gas-fired
                                                    power plants hiked by 5% in
                                                    2013

July 2014: The Development of Chinese Gas Pricing                                                     20
Anhui (1.5%) Link established between 100%
wellhead and end-user price
Western Sichuan (12%) Unified provincial city-gate 36% of production
price of $8.5/MMBtu exported to other
introduced (excluding provinces
residential gas, compressed
natural gas [CNG] and gas for
fertilizer industry)
Chongqing (4%) Non-residential prices 54% (from other
adjusted – the biggest provinces)
increase was for CNG
(11.28%), while the CNG
surcharge was abolished
Shaanxi (5%) One-step price increase 77% of production
introduced for incremental gas exported to other
provinces
Pipeline and grid tariffs
rationalized
Sources: Websites of various local pricing bureaus, CEIC.
2.4 Chinese gas price along value chains – A case study of Shanghai
Figure 8 below shows the gas price along value chains to end-users in Shanghai, which was
considered a national city-gate reference as it receives gas from diverse sources. The net-back city
gate price ceiling for incremental gas set by NDRC in 2013 has substantially reduced the financial
losses resulting from the sale of Turkmen gas (via West East Pipeline II, following transit across 11
provinces in China), which was previously sold at the city gate at the same price as more cheaply
produced domestic gas (in this case, Puguang gas from Sichuan province) that is closer to Shanghai.
Industrial and transport users, which accounted for 65% 14 of Shanghai’s total final gas consumption in
2011, pay more than the new city gate price for incremental gas. On the other hand, the city gate
price ceiling for existing gas after the price hike is close to that of residential end use price. On 2 July,
2014, the Shanghai government announced a 21% hike of residential gas price (subject to public
hearing) as well as plans to introduce tiered pricing for residential gas use. This will reduce the risk 15
of losses on natural gas imports. Turkmen deliveries to Shanghai which are set to increase to 2
Bcm/year by 2015 are faced with stiff competition from diversified gas supplies, among others, long-
term LNG supplies and domestic offshore gas (Pinghu gas) that will account for 43% of Shanghai’s
total gas supply in 2015 (Shanghai NDRC, 2011). Potential Russian gas arrival at Shanghai city gate
towards 2020s could also compete with Central Asian supplies as the distance (henceforth
transmission cost) between Chinese-Russian border to Shanghai is considerably shorter than that
from Chinese border with Central Asian countries to Shanghai.
The latest increase in city-gate prices is expected to result in higher domestic wellhead prices and to
increase somewhat the incentive for domestic upstream investment. This, in turn, will lead to a closer
15
The risk is also lowered by the increase in proportion of industrial users of gas in Shanghai who have been paying higher
prices in recent years.
July 2014: The Development of Chinese Gas Pricing 21linkage between the upstream and the market (although the local distribution margin will be squeezed). Figure 8: Gas prices and tariffs along value chains to Shanghai, 2013 Note: The NDRC set the price ceilings for non-residential existing (2012 volume) and incremental gas (in excess of 2012 supply) for Shanghai on June 28, 2013. Sources: China Customs Statistics, CEIC, NDRC. July 2014: The Development of Chinese Gas Pricing 22
3. The drivers for change and the gas-pricing challenges

3.1 Key drivers
    1) The growing importance of gas in the regions’ energy mix

From 2006 to 2011 the share of gas in overall energy consumption rose in most provinces. Of the
three main regions of China, the coastal region recorded the largest average annual increase – 2%
(or 44 Bcm over the period). Within the region itself, the growing importance of gas varied significantly
from province to province: Beijing took the lead with the share of gas in the city’s total energy
consumption more than doubling. The Western region recorded the second-largest increase in the
share of gas in overall energy demand; its proximity to production centres and imports from Central
Asia contributed to gas playing a larger role there. The Central region witnessed a more modest
increase. However, with the arrival of pipeline gas via WEP II and WEP III, gas is set to play a bigger
role in this region too as several provinces of the central region (e.g., Hubei and Jiangxi) are key
transit points.

Figure 9 below shows that of the three main regions of China, the coastal region also saw the biggest
increase in the share of national gas demand during the period 2006 – 2011. Combined with the
central region, which recorded a marginal increase only, it accounted for 60% of national gas
consumption in 2011, while the share of the western region declined from 53% to 40%. The top 10
gas-consuming provinces accounted for two-thirds of national gas demand; no less than half of these
are located in the coastal region. However, despite the more than a 70 Bcm increase in overall gas
consumption during this period, gas accounted for just 5.9% of China’s total energy consumption in
2013. This means there is still huge potential for further increases in the share of gas in the local
energy mix.

Figure 9: Growth of gas share of total provincial energy consumption, 2006-2011

Source: CEIC

July 2014: The Development of Chinese Gas Pricing                                                      23
You can also read