The Early Labor Market Impacts of COVID-19 in Developing Countries
←
→
Page content transcription
If your browser does not render page correctly, please read the page content below
Public Disclosure Authorized

                               Policy Research Working Paper                           9510
Public Disclosure Authorized

                                         The Early Labor Market Impacts
                                     of COVID-19 in Developing Countries
                                         Evidence from High-Frequency Phone Surveys
Public Disclosure Authorized

                                                                 Melanie Khamis
                                                                  Daniel Prinz
                                                                 David Newhouse
                                                               Amparo Palacios-Lopez
                                                                    Utz Pape
                                                                  Michael Weber
Public Disclosure Authorized

                               Social Protection and Jobs Global Practice
                                 &
                               Poverty and Equity Global Practice
                               January 2021
Policy Research Working Paper 9510
Abstract
The economic crisis caused by the COVID-19 pandemic has of payment for work performed, 9 percent reported job
sharply reduced mobility and economic activity, disrupting changes due to the pandemic, and 62 percent reported
the lives of people around the globe. This paper presents income loss in their household. Stopping work was more
estimates on the early impact of the crisis on labor markets prevalent in the industrial and service sectors than in agri-
in 39 countries based on high-frequency phone survey data culture. Measures of work stoppage and income loss in the
collected between April and July 2020. Workers in these high-frequency phone survey are generally consistent with
countries experienced severe labor market disruptions fol- gross domestic product growth projections in Latin Amer-
lowing the COVID-19 outbreak. Based on simple averages ica and the Caribbean but not in Sub-Saharan Africa. This
across countries, 34 percent of the respondents reported suggests that the survey data contribute new and important
stopping work, 20 percent of wage workers reported lack information on economic impacts in low-income countries.
This paper is a joint product of the Social Protection and Jobs Global Practice and the Poverty and Equity Global Practice.
It is part of a larger effort by the World Bank to provide open access to its research and make a contribution to development
policy discussions around the world. Policy Research Working Papers are also posted on the Web at http://www.worldbank.
org/prwp. The authors may be contacted at dnewhouse@worldbank.org.
The Policy Research Working Paper Series disseminates the findings of work in progress to encourage the exchange of ideas about development
issues. An objective of the series is to get the findings out quickly, even if the presentations are less than fully polished. The papers carry the
names of the authors and should be cited accordingly. The findings, interpretations, and conclusions expressed in this paper are entirely those
of the authors. They do not necessarily represent the views of the International Bank for Reconstruction and Development/World Bank and
its affiliated organizations, or those of the Executive Directors of the World Bank or the governments they represent.
Produced by the Research Support TeamThe Early Labor Market Impacts of COVID-19 in
Developing Countries: Evidence from High-Frequency
Phone Surveys∗
Melanie Khamis
Daniel Prinz
David Newhouse
Amparo Palacios-Lopez
Utz Pape
Michael Weber
Keywords: COVID-19, Employment, High-frequency phone survey, Developing countries
JEL Codes: J21, O12, E01
∗
Khamis: World Bank, Wesleyan University and IZA; Prinz: World Bank and Harvard University; New-
house: World Bank and IZA; Palacios-Lopez: World Bank; Pape: World Bank; Weber: World Bank. The
corresponding author is David Newhouse: dnewhouse@worldbank.org. This work was prepared as part
of the World Bank’s JobsWatch Covid-19 initiative. The authors are grateful to Sukti Dasgupta (ILO),
Sangheon Lee (ILO), Truman Packard, and Nobuo Yoshida for helpful comments, and to Benu Bidani,
Ambar Narayan, Michal Rutkowski, Carolina Sanchez-Paramo, and Ian Walker for their guidance. This
work was made possible through a grant from the World Bank’s Jobs Umbrella Trust Fund, which is
supported by the the UK’s Foreign, Commonwealth Development Office/UK AID, and the Governments
of Norway, Germany, Italy, and Austria; the Austrian Development Agency; and the Swedish Interna-
tional Development Cooperation Agency. The authors further gratefully acknowledge financial support
from the Korean Trust Fund (KTF). The team is also grateful to the Poverty and Equity Global Prac-
tice and the Data for Goals group for collecting, harmonizing, and sharing the phone survey data, and
to Denis Medvedev and Leonardo Iacovone for providing aggregate indicators from firm surveys. Aggre-
gate indicators from the high frequency phone surveys are available at the High Frequency Phone Sur-
vey dashboard at: https://www.worldbank.org/en/data/interactive/2020/11/11/covid-19-high-frequency-
monitoring-dashboard1 Introduction
The global coronavirus pandemic (COVID-19) dramatically slowed economic activity as gov-
ernments implemented lockdown measures, individuals reacted by reducing both their mo-
bility and economic activity, and firms’ production processes were disrupted. These broader
shifts in the economy affected both firms’ demand for labor and workers’ ability and willing-
ness to work. In developed countries where data are readily available, labor market impacts
varied considerably across countries, depending on initial economic and labor market condi-
tions and variations in policy responses. Unfortunately, however, most of the countries with
post-crisis data are high-income countries, and there is little systematic knowledge about the
labor market impacts of the crisis in developing countries. Understanding how the pandemic
affected labor markets in the developing world is crucial as governments and other actors
continue to develop responses.
This paper has three main objectives. The first is to provide evidence from high-frequency
phone surveys (HFPS) on the magnitude of the initial labor market consequences of the crisis.
The second is to provide a detailed description of the nature of the HFPS data. Finally, the
paper aims to evaluate the consistency of the HFPS data with other sources of data. Our
analysis complements other methods and estimates, and regular revisions will be important
to track labor market developments over time. The measures derived from the HFPS data
differ from macroeconomic projections, particularly in Sub-Saharan Africa, and therefore
provide important additional insights into the initial impacts of COVID-19 in developing
countries.
Our paper is the first to report cross-country results on labor market outcomes from the
HFPS data. We use data on 39 of the 52 countries contained in the December 1st vintage
of the harmonized data. The data contain 6 countries in Europe & Central Asia, 7 in East
Asia & Pacific, 12 in Latin America & the Caribbean, 2 in Middle East & North Africa, and
12 in Sub-Saharan Africa. Surveys were started in April 2020 and have been carried out in
several waves since then. Survey timelines and methodologies including questionnaires were
2not identical across all regions and countries, but the World Bank’s Data for Goals group
undertook considerable effort to develop a harmonized data set to facilitate cross-regional
and cross-country comparisons.
In addition to harmonization, a further methodological challenge is the limited represen-
tativeness of the surveys overall and within countries, as they were conducted via phone and
used different sampling methodologies. In particular, most countries in Sub-Saharan Africa
used a sampling frame based on a previous survey and explicitly sought to interview house-
hold heads, while surveys in Latin America and the Caribbean used random digit dialing
to collect data (Table 3). This complicates comparisons of individual-level characteristics
such as employment across regions. Because of the challenges regarding non-representative
sampling of individuals, we report results under two different weighting methods. We rely
on the household weights in the HFPS data for our main results and complement them
with another weighting method as a robustness check. As a robustness check, we add an
additional individual-level adjustment to the weights based on the World Bank’s Global
Monitoring Database (GMD).1 Using this method, we assign an inverse probability weight
to each individual observed in the data to make the distribution of individual characteristics
(age, gender, education, and urban status) more aligned with the GMD.2 In the robustness
check, we examine how outcomes compare when we rely only on the household weights in
the HFPS data and our second weighting method and generally find similar results.
We first report results on high-level measures of work stoppage based on questions that
ask respondents whether they were working pre-pandemic and whether they were working at
the time of the survey. We find that work stoppage was common. Taking a simple average
across countries, 34% of respondents reported stopping work. The average across countries
in our data is 21% in the EAP region, 29% in the ECA region, 48% in the LAC region,
45% in the MENA region, and 26% in the SSA region. The cross-country average is 19% for
1
Part of the World Bank’s harmonized survey repository, the GMD is a collection of globally harmonized
household surveys that allow for cross-country and over-time analyses of representative samples.
2
A further complication is that we cannot observe each of these variables for all countries in the HFPS
data. We therefore use the widest available set of characteristics for adjustment.
3low-income countries, 37% for lower-middle-income countries, 41% for upper-middle-income
countries, and 26% for high-income countries. (We note that the set of countries in our data
is not representative of regions or country income groups.)
In addition to work stoppage, we examine other measures of the labor market effects of
COVID-19 available from the HFPS data. We find that a substantial share, 20% of wage
workers, report partial or no payments for work performed in the LAC region where this
information was collected. In some countries, up to 21% of respondents report changing jobs
during the pandemic (on average 9% report changing jobs), another sign of disruptions and a
possible coping mechanism. Taking the simple average across countries, 22% of agricultural
workers reported stopping work as opposed to 40% for industry and 38% for services. Ex-
amining broader measures of income loss, we find that a high share of respondents reported
total income loss (62%), as well as loss from farming (62%) and non-farming (75%) family
businesses, and wage incomes (49%), conditional on having a specific source of income.
To better understand what the HFPS data are saying about the initial impacts of the
crisis on labor market outcomes, we examine the relationship between HFPS measures of
economic impact and external measures of crisis impact. We find that work stoppage in the
HFPS data exhibits the expected negative relationship with GDP growth projections in the
LAC region. In contrast, we find that work stoppage is weakly and positively correlated
with GDP growth projections in the SSA region. Furthermore, we see the same pattern
when it comes to household farm income reductions: The expected negative correlation
in LAC and a positive correlation in SSA. We hypothesize that GDP growth projections
may not be accurately capturing income changes in the agriculture sector and the informal
economy, with informal labor market arrangements and self-employment, which are prevalent
in many countries in the SSA region. This also highlights that the HFPS data, despite their
limitations, are an important complement to macroeconomic projections. In particular, they
can help identify household impacts “on the ground” that may not be picked up by GDP
growth projections in low-income contexts. Looking at labor market statistics, we compare
4our labor market measure from the HFPS with official ILO employment data and also find
that differences between the HFPS and ILO data for the countries for which both data were
available exist when measuring some features of the labor market.
The findings highlight the value of the substantial effort to collect, harmonize, and com-
pare phone survey data across countries, both to better understand the nature of the COVID-
19 shock, as well as its effects on different sectors and countries. Our findings that the phone
surveys contribute additional information are consistent with Heath et al. (2021), who find
that in urban Ghana interviews conducted on the phone and in-person led to differences in
measures of employment, hours and days worked for the self-employed. The phone survey
data, while far from perfect, contribute valuable new information on how households in a
broad cross-section of developing countries were affected by this severe shock.3
The remainder of this paper proceeds as follows. Section 2 provides a review of the
related literature and the background on the COVID-19 pandemic and the pre-pandemic
labor market situation of the countries studied. Section 3 introduces the high-frequency
phone survey data, the process of selecting the sample, and the weighting method. Section 4
reports results on the labor market impact of the pandemic, compares our estimates to other
projections of economic and labor market activity and also provides a robustness check for
the weighting method employed. Section 5 concludes.
2 Literature and Background
2.1 Related Literature
Our work contributes to the recent and growing literature examining the labor market im-
pacts of the COVID-19 pandemic around the world. Most analysis of early labor market
3
Even in developed countries, the Economist (2020) highlighted that data from other sources and official
data sources do not always map perfectly with each other. However, these data provide valuable information
to find turning points and one could pick up different patterns in the economy earlier than is possible with
official data sources.
5impacts has focused on high-income countries, including Australia (Guven, Sotirakopou-
los and Ulker, 2020), Austria (Bamieh and Ziegler, 2020; Gulyas and Pytka, 2020), Italy
(Casarico and Lattanzio, 2020), Canada (Jones, Lange, Riddell and Warman, 2020), Den-
mark (Mattana, Smeets and Warzynski, 2020), the European Union (Pouliakas and Branka,
2020), Germany (Alipour, Falck and Schüller, 2020), Greece (Betcherman et al., 2020), Is-
rael (Miaari, Sabbah-Karkabi and Loewenthal, 2020), Japan (Kikuchi, Kitao and Mikoshiba,
2020; Morikawa, 2020), the Netherlands (Hassink, Kalb and Meekes, 2020; von Gaudecker
et al., 2020a,b), the Republic of Korea (Aum, Lee and Shin, 2020), Singapore (Kim, Koh
and Zhang, 2020), Sweden (Hensvik, Barbanchon and Rathelot, 2020a; Juranek, Paetzold,
Winner and Zoutman, 2020), the United Kingdom (Costa Dias et al., 2020; Crossley, Fisher
and Low, 2021; Etheridge, Tang and Wang, 2020; Wadsworth, 2020), and the United States
(Adams-Prassl, Boneva, Golin and Rauh, 2020; Angelucci et al., 2020; Avdiu and Nayyar,
2020; Baek, McCrory, Messer and Mui, 2021; Bartik et al., 2020a,b; Beland, Brodeur and
Wright, 2020; Cheng et al., 2020; Chetty et al., 2020; Coibion, Gorodnichenko and Weber,
2020; Cowan, 2020; Dalton, Handwerker and Loewenstein, 2020; Dingel and Neiman, 2020;
Forsythe, Kahn, Lange and Wiczer, 2020; Gallant, Kroft, Lange and Notowidigdo, 2020;
Hall and Kudlyak, 2020; Hensvik, Barbanchon and Rathelot, 2020b; Kong and Prinz, 2020;
Marinescu, Skandalis and Zhao, 2020; Mongey, Philossoph and Winberg, 2020; Murray and
Olivares, 2020; Petroulakis, 2020; Yasenov, 2020). Overall, the findings of these individ-
ual country studies provide evidence of major initial labor market impacts along a number
of dimensions in developed countries. For instance, for the United States the crisis led to
widespread job losses, in particular for low-wage workers (Chetty et al., 2020), a collapse in
job vacancies with some sectoral differences (Forsythe, Kahn, Lange and Wiczer, 2020) and
increases in unemployment insurance (UI) claims (Kong and Prinz, 2020). In the European
context, for the Netherlands, von Gaudecker et al. (2020b) find differences across sectors
and occupations, similar to the disproportionate effect on low-wage workers noted by Chetty
et al. (2020) for the United States, but they also find that the impact of government support
6on unemployment was far less than in the US and UK context.
Compared to the voluminous literature from high-income countries, there is scant evi-
dence from the developing world on the labor market impacts of COVID-19, largely due to
lack of data. Studies in high-income countries use a variety of data sources, ranging from
surveys to government administrative data sets, from private sector transactions to data
from social media and search engine companies. With some exceptions, work in developing
countries needs to rely on survey evidence that would have to be collected for the specific
purpose of studying the crisis and addresses specific questions. Recent work has found
substantial impacts on employment and energy consumption in India (Beyer, Bedoya and
Galdo, 2020; Deshpande, 2020; Dhingra and Machin, 2020; Lee, Sahai, Baylis and Green-
stone, 2020), on family businesses in Nigeria (Avenyo and Ndubuisi, 2020), and simulated
aggregate consumption in Uganda (von Carnap et al., 2020). While these papers consider
individual countries and various specific situations in these countries, our data allow us to
consider a much wider set of countries and to compare countries to each other.
Several sets of papers offer regional or even global assessments of the impacts of the
crisis on different dimensions, often based on firm surveys, simulations, or Google search or
mobility data. For example, Adian et al. (2020) find that small and medium enterprises in
13 countries were more affected by the crisis than larger firms. Apedo-Amah et al. (2020)
confirm this using data from a wider set of countries, and also find that most adjustments
occurred on the intensive margin of hours reductions or temporarily work stoppage. Bachas,
Brockmeyer and Semelet (2020) simulate the shock on firms using administrative data from
10 countries and predict an annual payroll reduction of 5%-10%.
A smaller set of global studies explicitly considers distributional effects. Bargain and
Aminjonov (2020) document that poorer regions across nine countries in Latin America and
Africa were less likely to comply with stay-at-home orders, and therefore more likely to
spread the disease. Dang, Huynh and Nguyen (2020) use surveys from China, Italy, Japan,
Korea, and the United Kingdom to analyze the unequal effects of the pandemic by income
7level. They find that the poor are most likely to reduce savings and least likely to engage in
behavioral change. Decerf, Ferreira, Mahler and Sterck (2020) provide global mortality and
poverty estimates and estimate that the average number of additional years spent in poverty
due to COVID-19 will be about 15 times greater than the number of lives lost. Busso,
Camacho, Messina and Montenegro (2020) focus on social assistance to households in Latin
America and find a substantial coverage gap in the 2nd and 3rd quintiles. Similarly, Lustig,
Pabon, Sanz and Younger (2020) report evidence on the impact of lockdowns and expanded
social assistance in Argentina, Brazil, Colombia, and Mexico. They conclude that impacts
were worst for households in the middle of the ex-ante per capita income distribution.
At least two studies examine real-time private sector data to document impacts. Abay,
Tafere and Woldemichael (2020) use Google Search data to estimate the demand for various
services in 182 countries and find substantial contraction in demand for services such as retail
trade, restaurants, and hotels. Meanwhile, Sampi and Jooste (2020) use Google Mobility
data for nowcasting economic activity in the Latin America & the Caribbean region and find
that it predicts falls in industrial production.
Several related papers consider the ability of different workers to work from home in a
wide set of countries. Garrote Sanchez et al. (2020) examine the EU and find that jobs
most at risk account for 30 percent of all EU employment and tend to be filled by less-
skilled workers. Gottlieb, Grobovšek, Poschke and Saltiel (2020) find that only about 20
percent of urban workers can work from home in poorer countries, versus 37 percent in rich
countries. Hatayama, Viollaz and Winkler (2020), using a different sample of 53 surveys,
confirm that more developed countries have a greater share of jobs amenable to working
from home. Delaporte and Peña (2020) study working from home in Latin American and
Caribbean countries and estimate that the share of workers that can work from home varies
from 7 percent in Guatemala to 16 percent in the Bahamas. Another set of global studies
considers policy responses to the pandemic and their consequences. Alon, Kim, Lagakos and
VanVuren (2020) develop a macroeconomic model and conclude that blanket lockdowns are
8less effective in developing countries. Maloney and Taskin (2020) analyze the determinants
of social distancing and economic activity across countries. They conclude that much of
the social distancing behavior was voluntary rather than a result of repressive restrictions.
Azevedo et al. (2020) and Psacharopoulos, Collis, Patrinos and Vegas (2020) focus on school
closures. They estimate significant negative effects on years of schooling adjusted for quality,
which will significantly depress future earnings of affected cohorts. Demirgüç-Kunt, Lokshin
and Torre (2020) estimate the effects of non-pharmaceutical interventions across countries
in Europe & Central Asia and find that countries that implemented restrictions sooner had
better short-term economic outcomes. Similarly, the International Monetary Fund (2020)
concludes that mitigation measures have been successful in bringing down infections and set
the stage for an eventual recovery from the downturn.
The analysis most closely related to this paper is International Labour Organization
(2020), which specifically monitors labor market impacts, in particular the effect of workplace
closures, working hours losses and labor income losses derived from labor force surveys.
These reports find that a large share of the world’s workers live in countries with workplace
closures (with a peak of 97 percent in April 2020). In their analysis, working-hour losses
are high and translate into substantial losses in labor income. This work complements that
analysis in two ways. First, it looks at a wide variety of labor market outcomes, including
work stoppage, income loss, income and job changes. Second, this study considers a larger
set of developing countries, particularly in Sub-Saharan Africa, that are not reporting labor
statistics during the pandemic. Considering the literature as a whole, this paper makes three
main contributions. First, it considers developing countries instead of developed countries,
which have been the focus of most existing studies. Second, it compares the labor market
impacts across a variety of developing countries spanning multiple regions. This paints a
richer and more accurate picture of how the crisis affected workers than existing global
or regional studies based on firm data, in large part because the phone survey data include
informal sector workers who make up a large share of workers in low-income contexts. Finally,
9the paper compares measures derived from the HFPS data to measures published by the
International Monetary Fund (2020) and the International Labour Organization (2020) to
understand the early labor market effects of the crisis in the context of official macroeconomic
and labor market data. The comparison reveals that labor market outcomes based on the
high frequency phone survey data differ markedly from standard macroeconomic measures
of growth, especially in Sub-Saharan Africa.
2.2 Background: The COVID-19 Pandemic
Coronavirus disease 2019 (COVID-19) is an infectious disease caused by severe acute respira-
tory syndrome coronavirus 2 (SARS-CoV-2). During the first half of 2020, COVID-19 spread
globally: by November 2020, 216 countries and territories have reported cases. COVID-19 is
highly infectious. Its symptoms include fever, cough, shortness of breath, difficulty breath-
ing, chills, muscle pain, headache, sore throat, and reduced sense of taste or smell. It can
cause a wide spectrum of diseases ranging from mild illness to moderate and severe pneu-
monia, respiratory failure, and death. By mid-January 2021, there have been 93 million
confirmed cases and 2 million deaths worldwide.
Columns 5-8 of Table 1 show the number of confirmed cases, the number of confirmed
cases per million, the number of deaths, and the number of deaths per million on May 31
(the midpoint of our surveys) in the countries included in our data. The table suggests
that measured by the number of deaths, the pandemic was not very severe in the East Asia
& Pacific and the Sub-Saharan Africa countries included in our data. It was most severe
in some of the Latin America & the Caribbean countries, particularly in Ecuador, Peru,
and Mexico, while the Europe & Central Asia countries in our data experienced moderate
outbreaks, apart from Romania which was hit particularly hard.
102.3 Background: Government Responses and Economic Impacts
Governments around the world have responded to COVID-19 by implementing lockdowns
and mobility restrictions to slow the spread of the virus. The pandemic itself and government
restriction policies have disrupted normal economic activity in a multitude of ways, impacting
virtually all major parts of the economy. Consumption was reduced, investment activities
have in some cases been slowed down, import and export relationships have become strained.
Both the demand and supply sides of labor markets have been heavily impacted in many
countries. Table 2 shows measures of government responses to the pandemic, including the
economic support index, the stringency index, and the workplace closing index published by
the Oxford COVID-19 Government Response Tracker (OxCGRT).4 On average, countries in
the ECA and LAC regions provided the most economic support, though at the same time the
stringency of lockdowns and workplace closings ordered by the government were also quite
severe in the LAC region. SSA countries provided the least economic support, but they also
had the least stringent lockdowns and workplace closing measures on average.
The overall economic impact of the pandemic has been severe: Columns 9-11 of Table 1
show the International Monetary Fund’s estimate of the economic impact of the pandemic
in the countries included in our data. Column 9 shows the October 2019 World Economic
Outlook (WEO) projection for 2020 GDP change, Column 10 shows the same projection
from the October 2020 WEO, and Column 11 shows the difference. For every country in
our data, the projection has worsened by at least 4 percentage points, and in many cases by
much more. The Latin America & the Caribbean region saw the biggest negative economic
impact according to the IMF, with decreases in projections ranging from 5.5 percentage
points in Guatemala to 17.6 percentage points in Peru.
4
The OxCGRT data for the three indices were averaged for the period January 1 to May 31, 2020. The
OxCGRT measures aim to analyze the government responses to the pandemic. These indicators are compiled
to measure the various policies, such as school closures and restrictions, across more than 180 indicators,
resulting in several indices and sub-indices. The economic support index records measures of income support
and debt relief from 0 to 100. The stringency index records the strictness of ‘lockdown style’ policies that
primarily restrict people’s behavior from 0 to 100. The workplace closing index, a subindex, records the
closing of workplaces from 0 to 3. In each of these indices, a higher number implies more restrictions.
11It is useful to understand what labor markets and in particular employment trends looked
like in the set of countries that we study pre-pandemic. Columns 12 –14 of Table 1 show the
International Labour Organization’s pre-pandemic 1st quarter of 2020 and 2nd quarter 2020
data for the countries that have both quarters available and the change between the two
quarters. For the subset of countries of the HFPS that have ILO employment data available
for the two quarters, the range shows very small increases in employment (0.73) to large
declines (-23.98).
3 Data and Methods
3.1 High-Frequency Phone Survey Data
We use harmonized data from the World Bank’s High Frequency Phone Surveys (HFPS).
The surveys have been harmonized both ex ante and ex post in the data production stage,
but differences across countries remain in terms of questionnaire and sampling design. The
data used from the surveys cover 12 countries in the Sub-Saharan Africa (SSA) region, 12
countries in the Latin America & the Caribbean (LAC) region, 7 countries in the East Asia
& Pacific (EAP) region, 6 countries in the Europe & Central Asia (ECA) region, and 2
countries in the Middle East & North Africa (MENA) region. Currently no countries in the
South Asia (SA) region are included. Eight countries are low income, 17 are lower middle
income, 10 are upper middle income and 4 are high income. Going forward, more countries
will be added to the HFPS data, including several in South Asia. We analyze the first wave
of data for each country, for waves collected between April and July 2020. Table 3 shows
information on the set of countries included, the month data were collected, the number of
survey respondents, the survey sampling, and the availability of some key variables. The
final sample size for countries ranges from 692 (Paraguay) to 5,346 (Vietnam). The mean
number of respondents is 1,666, while the median is 1,288.
123.2 Variable Definitions
We begin by examining whether workers stopped working after the pandemic set in. Work-
ers are classified as having stopped work if they answered yes to the question “Was the
respondent working before the pandemic?” (working pre-pandemic) and no to the question
“Did the respondent work in the last week?” (currently working). However, surveys in most
countries did not ask respondents if they were working before the pandemic if they reported
that they are currently working. Hence, it is not possible to estimate the number of workers
prior to the crisis. This in turn means that it is not possible to construct the share of workers
who were working prior to the pandemic that stopped working, because the denominator is
unknown. We therefore approximate the share of workers who stopped working by dividing
the number of people who stopped working by the sum of the number of people who stopped
working and those that were currently employed at the time of the survey. In the LAC coun-
tries, however, the questionnaires asked respondents about their past work and whether they
were currently working or not. Across the 12 LAC countries where both measures can be
constructed, the two measures have a correlation of 0.99, suggesting that this approximation
is highly accurate.
In addition to stopping work, we consider several other variables from the HFPS sur-
veys to measure economic impacts. These include partial or no payment for work performed
among wage workers (“For the work that you did in the last week, will you be paid/were
you paid?”), changing jobs (“Has the respondent changed jobs since the beginning of the
pandemic?”), as well as income change (“Has your household income changed since the pan-
demic started?”). For income change, we consider four income sources: (i) total; (ii) family
farming, livestock, or fishing; (iii) non-farm family business; and (iv) wage employment.
Table 4 summarizes the questions used and our variable definitions.
133.3 Representativeness and Weighting
The HFPS surveys are not nationally representative at either the household or individual
level. Only households where a member owned a phone, had access to electricity and mobile
network coverage as well as was willing to participate were interviewed. To partially address
this, most surveys adjusted the household sample weights to account for the non-random
selection of households.5
Questions of representativeness at the individual level are more serious, because many
surveys drew their sample from an existing pre-pandemic survey, and these explicitly sought
to interview heads of households or their spouses. For these surveys, we therefore mainly
observe the labor market outcomes of household heads. We observe data on relation to head
in 20 countries, which unfortunately excludes the surveys from LAC, which did not collect
this information. In these 20 countries, 67 percent of the sample are heads (vs 23 percent in
the GMD), 18 percent are spouses (vs 17 percent in the GMD), and 11 percent (vs 44 percent
in the GMD) are children. To the extent that heads have different labor market outcomes
than others in the households, the phone surveys that explicitly sought to interview heads
will present a biased picture of labor market outcomes.
Selection bias in labor market outcomes is a particular concern when comparing labor
market outcomes in Sub-Saharan Africa to those in Latin America & the Caribbean, for
two reasons.6 First, the surveys in LAC were conducted through random digit dialing rather
than recontacting households interviewed in an existing survey. The latter sampling strategy
usually sought to re-interview household heads while the former did not. As mentioned above,
this means that the surveys outside LAC are highly skewed towards heads. Second, the
5
The only surveys that did not use household weights were those from Poland and South Sudan.
6
Within-household decisions, such as between the head and non-head of the household, on labor market
participation and labor supply may also be important. There may also be differences in the labor supply
elasticities between the household heads and non-household heads. As McKenzie (2004) in his study of a
sharp economic contraction points out, labor supply is generally considered to be more elastic for women
and young adults than prime-age males. One would expect a larger supply response from these groups,
especially if they are non-household heads. This in turn could have an effect on potentially underestimating
the employment effects in SSA, with data based mainly on household heads, presumably prime-age males.
14surveys in the LAC region use an additional reweighting procedure to construct individual
weights. These weights essentially adjust for survey non-response and calibrate the sum
of weights to match those from pre-crisis survey or census data. For surveys outside LAC,
household weights are used with no comparable adjustment for individual weights. Therefore,
comparisons of individual outcomes like labor market impacts between the RDD surveys in
LAC and the recontact surveys in SSA should be interpreted with care.
As a robustness check, we attempt to make individual-level outcomes observed in the
HFPS data more representative of the broader population by applying inverse probability
weights estimated using the Global Monitoring Database (GMD). The GMD is a harmonized
database of household surveys used for official poverty measurement. For each country, we
use the most recent available year from the GMD to estimate inverse probability weights
based on age, gender, living in an urban area, and level of education where available. Using
this type of inverse probability weighting is well-established in the statistics and economics
literature.7 In some countries, the urban and/or education indicators are not available. In
these cases, we rely on the set of available variables for weighting. (Table 3 shows the
available weighting variables for each country.) We pool the HFPS and GMD data, and run
a probit regression of an indicator to estimate the probability for being in the HFPS data
on the available set of weighting variables from the GMD, weighted by the survey-based
household weights. The inverse of the estimated probability is the weight. This gives greater
weight to observations that appeared in the HFPS sample despite having a low predicted
probability of being included in it. This procedure only corrects for selection bias due to
the few observed variables used to estimate the probability. In Section 4.5, we examine
robustness and find that this correction generally makes little difference between our main
results based on HFPS household weights and our weighting system based on GMD data.
7
See, for example, Horvitz and Thompson (1952), Woolridge (2002, 2007), Busso, DiNardo and McCrary
(2014), and Li, Morgan and Zaslavsky (2018).
153.4 Sample Definition
In order to arrive at the analytical sample summarized in Table 3, we implement several
filters. First, we drop several countries for various reasons. We exclude the Central African
Republic and the Democratic Republic of Congo, because the surveys were carried out
exclusively in the capital cities. We exclude Argentina, Cambodia, the Arab Republic of
Egypt, Iraq, Mozambique, Sierra Leone, Somalia and the Republic of Yemen because the
survey data for these countries have not been approved for public disclosure. Second, we
limit our analysis to the first survey wave in each country and the months of April to July.
We exclude the Philippines because the Wave 1 data are from August. Finally, we limit our
sample to respondents ages 15 to 64 and drop observations with missing age. We exclude
Chad and Senegal because age is not available in the data.
3.5 Other Data
In addition to the HFPS data, we use several data sets to describe pandemic severity, macroe-
conomic and labor market projections, and for weighting purposes.
Pandemic severity data. To describe pandemic severity, we use data from the University
of Oxford’s Our World in Data (OWID) COVID-19 data set. Specifically, we use May 31
(the midpoint of our surveys) data on the number of cases, the number of cases per million,
the number of deaths, and the number of deaths per million. The original source of the
OWID COVID-19 case and death data is the European Centre for Disease Prevention and
Control (ECDC) which collects data on countries around the world.
Macroeconomic projections. To relate our findings to macroeconomic projections on
the economic impact of COVID-19, we use data from the IMF’s World Economic Outlook
(WEO). To measure the pandemic’s impact on the macroeconomic outlook of countries,
we compare October 2019 projections with October 2020 projections. This allows us to
16describe changes in outlook due to the pandemic. The specific GDP measure that we use is
the annual percent changes of constant price gross domestic product, where the base year is
country-specific, according to WEO.
Labor market projections. To relate our findings to other labor market projections on
the economic impact of COVID-19, we use data from the International Labour Organization’s
(ILO’s) ILOSTAT, the employment-to-population ratio in percent, the number of persons
who are employed as a percent of the total working age population, based on country labor
force surveys, restricted to the group ages 15 years or older. The quarterly data for quarter
1 and quarter 2 of 2020 allow us to describe the change in employment at similar time points
to the HFPS measure of the labor market.
4 Results
4.1 Disruptions to Work in the High-Frequency Phone Surveys
We start by examining the impact of the pandemic on work stoppages in different countries.
As discussed in Section 3.2, we count a respondent as having stopped work if she was working
pre-pandemic but no longer working the week preceding the interview. Figure 1 shows the
share of respondents who report stopping work during the pandemic by country.
Panel (a) of Figure 1 groups countries by region, highlighting EAP countries in blue, ECA
countries in red, LAC countries in green, MENA countries in yellow, and SSA countries in
purple. Taking a simple average across countries, 34% of respondents reported stopping
work. The average across countries in our data is 21% in the EAP region, 29% in the ECA
region, 48% in the LAC region, 45% in the MENA region and 26% in the SSA region. (We
note that the set of countries in our data is not representative of regions.) There is significant
variation, even within regions. For example, within the LAC region, at the lower end 30%
stopped working in Chile and 36% in Costa Rica, while at the higher end 59% stopped
17working in Peru and 69% in Bolivia. In the SSA region estimated shares are as low as 8%
in Madagascar and 11% in Burkina Faso and shares as high as 50% in Nigeria and 62% in
Kenya.
Upper-middle-income countries (41% on average) and lower-middle-income countries
(37%) had the most work stoppage. High-income countries had 26% of respondents on
average stop work, followed by low-income countries at 19%. (We note that the set of
countries in our data is not representative of country income groups.)
In the LAC countries, respondents were also asked about whether they were planning
to return to work if they stopped working. For these countries, we break down the overall
share of workers who stopped working by whether they were planning to return to work in
Panel (c) of Figure 1. It suggests that the majority of workers who stopped working were
planning to return to work, though there is some variation across countries.
In addition to stopping work altogether, we examine measures of reduced payment. Fig-
ure 2 shows the share of respondents reporting partial or no payments for work performed
among wage employees. This question on partial or no payments for work performed is
available mostly in countries in the LAC region. The share reporting partial or no payments
in this region ranges from 17% in Chile to 30% in Peru. This indicates that in addition
to stopping work, reductions in pay due to reduced economic activity was an important
challenge to workers. The workers nominally kept their jobs but were not receiving the full
payment for the work performed, either possibly due to some furlough type of arrangements
or employers delaying or reducing the pay in response to the crisis. Workers may also have
adjusted working hours, but with the HFPS data we cannot measure reduced working hours
directly.
The large disruption in the labor market is also apparent from the high share of workers
changing jobs during the pandemic (Figure 3). Where data are available, job changing
ranged from 2% to 21% in the SSA region and 4% to 14% in the LAC region. This could be
an indication that some of the jobs that workers changed from were affected by the pandemic
18while the jobs that workers changed to were either new jobs or some type of self-employment
or in sectors that were differentially affected by the crisis.
4.2 Heterogeneity by Sector and Employment Type
To examine the heterogeneity of labor market disruptions by sector, we divide workers into
three broad sectors: Agriculture, Industry, and Services. Agriculture includes the “Agricul-
ture, Hunting, Fishing, etc.” sector, Industry includes the “Mining”, “Manufacturing”, and
“Construction” sectors, and Services includes the “Public Utility Services”, “Commerce”,
“Transport and Communication”, “Financial and Business Services”, “Public Services”, and
“Other Services, Unspecified” sectors. We do not have data on both pre-pandemic and cur-
rent sector of employment in every country. In some countries, respondents were only asked
about pre-pandemic sector if they stopped working. Therefore, we start by assigning the
observed pre-pandemic sector to respondents if they stopped working.8 Then for workers
for whom we could not assign a pre-pandemic sector, we assign their current sector if it is
available. For this analysis, we drop 12 countries for which we do not have pre-pandemic
sector or any current sector information, leaving information on 27 countries.
Figure 4 shows the share of workers who stopped working in each of the broad sectors:
Agriculture in Panel (a), Industry in Panel (b), and Services in Panel (c). We can observe
that workers were more likely to stop working in services (taking a simple average across
countries, 38% stopped working) and industry (40%) than in agriculture (22%). This is likely
because these sectors require more face-to-face interactions. But nevertheless, disruptions
are also significant in agriculture. We have sector information for more LAC countries than
other regions but like for overall work stoppage (Figure 1), it is apparent that LAC countries
experienced the most disruption according to the HPFS measure, while the EAP region
experienced the least disruption, even in the services sector. To the extent that data are
available, SSA countries experienced significant disruptions for industry and services, but
8
For workers who were not asked to report their pre-pandemic sector and did change jobs, we code
pre-pandemic sector as missing.
19less so for agriculture.
Figure 5 shows an additional dimension of heterogeneity, considering the self-employed vs
employees. This variable is mostly recorded in the LAC and ECA regions only. It appears
that stopping work is somewhat more common among the self-employed (46%, taking a
simple average across countries) than among employees (39%).
4.3 Measures of Income Loss
In addition to stopping wage work and payments for wage work, the HFPS data allow us to
examine broader measures of household income. Because these indicators are measured at
the household level, they are less influenced by the non-representative nature of the sample of
respondents in some countries. We examine four income categories: total household income,
farm income, non-farm income, and wage income. Results are reported in Figure 6.
Panel (a) suggests that total income loss was most prevalent in some SSA countries
(Ghana, Nigeria, and Malawi), as well as some countries in the LAC region (Peru and
Ecuador were the most affected). It appears that labor market disruptions have translated
into widespread income loss in all countries, including high-income countries with stronger
social security systems and public assistance programs. It is notable that in many countries,
particularly in the EAP region, many more respondents report income loss than stopping
work.
Panel (b) suggests significant drops in farm income across a broad set of LAC and SSA
countries, as well as some countries in the EAP region. Drops in income from family farming
suggest that the economic impacts of COVID-19 go beyond formal labor markets and the
formal economy, including in many countries where these less formalized sectors are a signif-
icant share of economic activity. Based on Panel (c), other types of family businesses were
hit even harder, especially in the LAC and SSA regions. This is consistent with the sectoral
heterogeneity in stopping work observed in Section 4.2 where we found that agriculture, in-
dustry, and services were all hit significantly, though the latter two sectors fared even worse
20than agriculture. Finally, Panel (d) suggests, consistent with Figures 1 and 2 that wage
income losses were severe, especially in the LAC region, followed by some SSA countries. To
understand the information content and internal validity of our different measures of labor
market disruption, in Figure 7 we plot the relationship between four measures of income
loss (total, farming, non-farming, and wage income) and stopping work. It appears that
there is a broad positive relationship between each of the income measures and stopping
work, although in general a higher share of respondents report household income loss than
work stoppage. Furthermore, the relationship between work stoppage and wage income is
much stronger than work stoppage and total income. This is consistent with income loss
applying to all members of the household, and also with the finding that beyond stopping
work, workers experience other disruptions, including reduced or no pay for work performed
and changing jobs. Overall, however, the results suggest internal consistency between the
prevalence of declines in household wage income and work stoppage, despite the latter being
measured using a non-representative sample.
4.4 Relationship with Macroeconomic Projections and ILO Em-
ployment Data
The labor market measure “stopped working” from HFPS differs in many cases from macroe-
conomic projections. Figure 8 shows the relationship between the HFPS-based measure of
the loss of work and the change in the International Monetary Fund’s (IMF) World Economic
Outlook (WEO) GDP projection for each country. The change in the WEO projection is
the difference between the October 2019 and the October 2020 projections of 2020 GDP
growth. Panel (a) suggests that the relationship goes in the expected direction in the LAC
region: countries where the WEO projection has worsened more show higher shares of stop-
ping work, with some notable outliers. At the same time, Panel (b) suggests that there is
no relationship between the WEO’s projection change for countries in the SSA region. An
important caveat when comparing the stopping work measures in the LAC and SSA regions
21is that sampling frames were different in different regions (Table 3 shows information on
the sampling frames in each country). In particular, surveys in SSA countries focused on
household heads. We do a number of things to deal with this concern. First our weights are
to some extent able to make our sample more representative at the individual level. Second,
and more importantly, in Section 4.3 we showed that stopping work measures are consistent
with household-level income loss measures. The subsequent panels of Figure 8 also demon-
strate that these broader measures of income are related to the WEO change in the same
way as stopping work in the LAC region, but also do not show a strong relationship with
the WEO change in the SSA region.
Panels (c)-(h) show the same relationship between different income components (farming,
non-farming, and wage income) and suggest a similar pattern of consistent relationships in
the LAC region but weak and inconsistently signed relationships in the SSA region. This
suggests that HFPS-data may be picking up economic impacts that are not typically in-
corporated into macroeconomic projections. However, the non-representative nature of the
sample in SSA may also influence the comparison between the rate of work stoppage and
the WEO GDP growth projections, meaning that further investigation is needed.
One piece of additional evidence comes from firm surveys that were fielded by the World
Bank, which show that firm survey measures of labor demand also do not line up well with
macroeconomic projections of GDP growth. To assess labor demand from the firm side,
we draw on aggregate country estimates of the share of firms that laid off workers and the
share of firms that reduced wages, hours, or granted leave to employees from a recent policy
research working paper (Apedo-Amah et al 2020). Figure 9 shows that these measures of
labor demand are not associated with changes in the WEO’s GDP projections for 2020.
This suggests that labor market impacts and ultimately other measures of household welfare
during the pandemic are not fully captured by GDP projections in the developing world.
This could be because of the differences in time horizons, as the macroeconomic projections
pertain to the entire year while the household and firm surveys measure initial impacts in the
22spring of 2020. Other potential reasons for discrepancies include the significant informality
in the labor market in developing countries, and the difficulty that GDP projections face in
incorporating the role of labor market institutions and labor market policy responses to the
pandemic.
Interestingly, both household and firm survey measures of business revenues are more
aligned with projected GDP growth. Using recent firm survey data and the HFPS question
“Has the revenue from that business decreased since the pandemic started?”, the two panels
of Figure 10 show that when available, business sales and revenue data are more correlated
with the downward adjustment of the WEO GDP projections. This suggests that GDP
projections are better at capturing the impact of the pandemic on business operations,
which are more likely to be at least somewhat formalized or interact more closely with the
formal economy.
Another important external source of information comes from the labor market indicators
reported by the ILO. These indicators are based on national labor force surveys which
ascertain labor market outcomes for all adults in the household and are based on larger
samples than the phone surveys, which we employ for our analysis. We therefore compare
the phone survey measure, the share of stopped working, with the ILO employment-to-
population ratio data available for the same time frame, quarter 1 and quarter 2 of 2020.9
Comparing the phone survey measure, the share of stopped working, with the ILO
employment-to-population ratio data available for the same time frame, unfortunately only
12 of the HFPS countries that have the share of stopped working variable for this period
overlap with the quarterly ILO data, which also are limited in terms of current availability.
Figure 11 shows that most of the countries seem to have higher values for the labor market
change measured by the HFPS data than for the labor market changes measured by the ILO
data, although the two measures are strongly correlated (0.74).10
9
The data come from the ILO collection STLFS Short-term labor force indicators, updated December 3,
2020.
10
Looking at measure of stop work for specific broad sectors, industry and services, a very similar picture
emerges as for the general stop work measure; however, the country subset is even smaller.
23The phone survey data seem to pick up some of the changes faster and more immediately
than official employment statistics. In particular, the ILO definition of employment classifies
those who are not working but expect to go back to work, for example because of vacation,
as employed. Under normal circumstances this is a small share of workers, but the phone
survey data from LAC mentioned above suggests a large share of workers fell into this
category immediately following the onset of the pandemic. This suggests that the measure
of stopping work in the phone surveys may better capture the full extent of labor market
disruption than the official ILO concept of employment in the immediate aftermath of the
crisis, despite legitimate concerns about the representativeness of the phone survey samples.
This provides additional evidence that the HFPS phone survey is useful in measuring initial
impacts and captures dimensions missed by other sources of data.
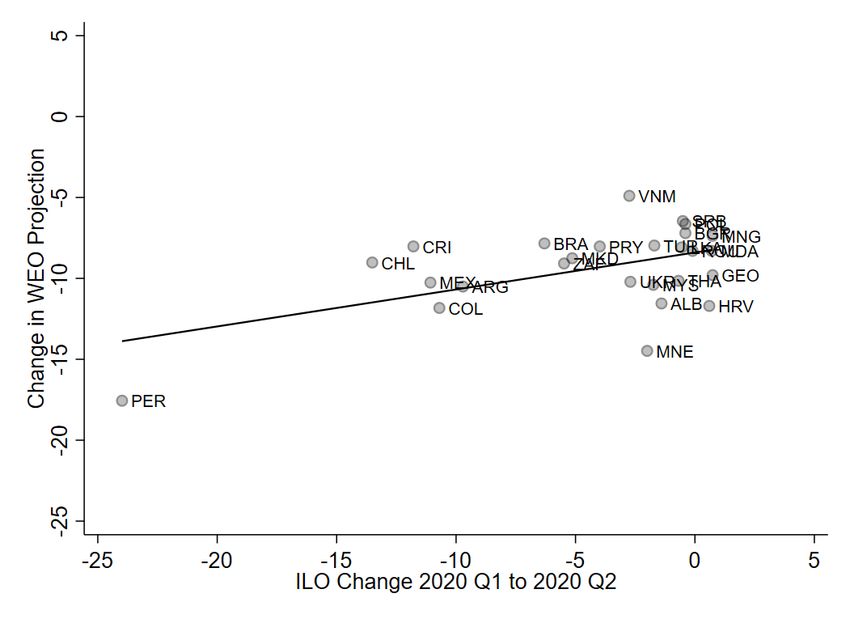
Finally, we compare the WEO macroeconomic growth projections with the ILO’s reported
information on employment changes in Figure 12. The ILO measure and the WEO measure
of change for this comparison include 26 countries, 12 overlapping with the HFPS phone
survey and 14 that are not, which are all developing countries. Here, again it seems that
the WEO GDP projections show a different pattern than the ILO employment change. For
example, Georgia and Chile have similar changes in GDP growth projections despite the
latter having much greater employment loss in the ILO data. This is a further indication
that WEO GDP projections are not necessarily picking up employment outcomes on the
ground. The HFPS phone survey data in particular appear to be reflecting short-term
employment changes that might take more time to appear in the official firm and labor force
surveys, national statistics and therefore in macroeconomics and employment projections.
4.5 Robustness: Alternative Weighting
In our main estimates, we use the HFPS survey weights. Figure 13 shows scatterplots for six
key measures (share stopped working, share with partial or no payments, share changed job
during the pandemic, shared with reduced consumption, share with hungry adults, and share
24selling assets) when we use additional inverse probability weights to adjust for individual-
level representativeness relative to the GMD vs using only the HFPS survey weights.
With the exception of job changes, the panels of this figure suggest that the results are
quite robust to using either of the weighting methods. The correlation is generally very high,
over 0.95 for all the outcomes studied. This suggests either that the labor market outcomes
of heads were generally consistent with the outcomes of children, or that the limited set of
demographic characteristics used to reweight the estimates is unable to adjust effectively for
these differences. Distinguishing between these two potential explanations is an important
topic for further research.
5 Conclusion
COVID-19 had a severe negative impact on labor markets in all regions. The estimates
based on high-frequency phone survey data suggest that in all countries, work was severely
reduced. Work stoppage, reduced working hours, and the overall economic impacts of the
pandemic led to substantial income loss. Further disruption was apparent through partial
or no payment of wage workers and job changes.
To better understand the HFPS measures of work stoppage and income loss, we compare
them with changes in GDP growth projections and ILO quarterly employment estimates.
Macroeconomic projections do not capture the full impact on households, particularly in
Sub-Saharan Africa. HFPS and firm survey data on reduction in business revenues, while
only available for a limited set of countries, show a more positive correlation with economic
prospects captured by the WEO’s GDP projection. This suggests that the impact of the
pandemic on labor markets and households may not be fully captured by the GDP projec-
tions, particularly in low-income and lower-middle-income countries and in SSA. This may
result from a high level of informality that is not fully reflected in GDP projections.
HFPS data are a valuable source of information to monitor the impacts of COVID-19
25You can also read