The Economic and Employment Contributions of a Conceptual Pebble Mine to the Alaska and United States Economies - THE PEBBLE LIMITED PARTNERSHIP
←
→
Page content transcription
If your browser does not render page correctly, please read the page content below
The Economic and Employment
Contributions of a Conceptual Pebble Mine
to the Alaska and United States Economies

                                         Prepared for:

                  THE PEBBLE LIMITED PARTNERSHIP

                                        Submitted by:

                                                   IHS
                                 15 Inverness Way East
                                 Englewood, CO 80112

                                           May 2013
The Economic and Employment Contributions of a Conceptual Pebble Mine
                              to the Alaska and United States Economies

About IHS (www.ihs.com)
 IHS Inc. (NYSE: IHS) is a leading source of information and insight in critical areas that shape today's business
 landscape, including energy and power; design and supply chain; defense, risk, and security; environmental, health
 and safety, and sustainability; country and industry forecasting; and commodities, pricing, and cost. IHS has been in
 business since 1959 and became a publicly traded company on the New York Stock Exchange in 2005. Headquartered
 in Englewood, Colorado, USA, IHS employs more than 5,100 people in more than 30 countries around the world.

About IHS Global Insight
 IHS Global Insight is one of the leading economic analysis and forecasting firms in the world. With over 600
 economists, statisticians, and industry specialists in 25 offices worldwide, IHS Global Insight has an established track
 record for providing rigorous, objective forecast analysis and data to governments and businesses around the world.
 Among our areas of expertise are the economic impact, tax implications, and job-creation dynamics within multiple
 sectors core to national, state, and local economies. It helps governments and companies at all levels interpret the
 impact of proposed investments, policies, programs, and projects.
 IHS Global Insight was formed by the merger of DRI and WEFA. Still active in an advisory capacity to the firm is the
 original founder of WEFA, Lawrence R. Klein, the 1980 winner of the Nobel Prize in Economics.

                                                  For more information, contact:
                                                      Brendan O’Neil
                                             Managing Director, Public Sector, IHS
                                                 Brendan.ONeil@ihs.com

                                                     Mohsen Bonakdarpour
                                         Director, Economic Analysis and Planning, IHS
                                               Mohsen.Bonakdarpour@ihs.com

                                                  For press information, contact:
                                                       Jim Dorsey
                                     Senior Manager, Media Relations, IHS Global Insight
                                             Jim.Dorsey@ihsglobalinsight.com

                                                             IHS
                                                     15 Inverness Way East
                                                     Englewood, CO 80112

© 2013 IHS. All information contained herein is obtained by IHS Inc. from sources believed by it to be accurate and reliable. All
forecasts and predictions contained herein are believed by IHS, Inc. to be as accurate as the data and methodologies will allow.
However, because of the possibilities of human and mechanical error, as well as other factors such as unforeseen and unforeseeable
changes in political and economic circumstances beyond IHS's control, the information herein is provided "as is" without warranty of
any kind and IHS Inc., AND ALL THIRD PARTY PROVIDERS MAKE NO REPRESENTATIONS OR WARRANTIES EXPRESS OR IMPLIED TO ANY
SUBSCRIBER OR ANY OTHER PERSON OR ENTITY AS TO THE ACCURACY, TIMELINESS, COMPLETENESS, MERCHANTABILITY OR FITNESS
FOR ANY PARTICULAR PURPOSE OF ANY OF THE INFORMATION OR FORECASTS CONTAINED HEREIN.

May 2013                                                                                                                 Page i
The Economic and Employment Contributions of a Conceptual Pebble Mine
                             to the Alaska and United States Economies

Project team

Authors
  Mohsen Bonakdarpour, Director, Economic Analysis and Planning, IHS
  Bob Flanagan, Director, Economic Analysis and Planning, IHS
  John Larson, Vice President, Public Sector, IHS
  John Mothersole, Senior Principal Economist, Pricing and Purchasing Service, IHS
  Brendan O’Neil, Managing Director, Public Sector, IHS
  Elizabeth Redman, Senior Consultant, Economic Strategy Solutions, IHS

Contributors
  Tabitha M. Bailey, Project Manager; Senior Associate, Public Sector, IHS

Acknowledgments
We would like to acknowledge the McDowell Group, with which we have collaborated on this report, for their
knowledge, expertise, and analysis on the state of Alaska. McDowell Group is an Alaska-based research and
consulting firm with extensive mining industry experience. In particular, we are grateful to Donna Logan and Jim
Calvin for their assistance with analysis of in-state spending related to mine development and operations. We
would also like to acknowledge and thank the subject matter experts, technical experts, industry experts, and
analysts that have contributed to this study. They are Shane Norton, Yanni He, Scott Fleming, and Tasmina
Ahmed.

     IHS Global Insight offers an independent assessment of the potential contribution of a “conceptual”
     Pebble Mine to Alaska and the Lower 48 economies. This study, which was commissioned by the
     Pebble Limited Partnership, was conducted between June and December 2012. The analysis and
     metrics developed during the course of this research are intended to contribute to a dialogue on the
     potential contribution of the Pebble Mine in terms of production, employment, and economic
     growth. IHS Global Insight is exclusively responsible for all of the analysis and content contained
     herein.

     All of the value added, labor income, and tax contributions throughout this report are expressed in
     terms of constant 2011 dollars.

     Sustaining capital expenditures are defined as alterations, additions, and maintenance of capital
     goods during the Production Phases.

May 2013                                                                                              Page ii
The Economic and Employment Contributions of a Conceptual Pebble Mine
                                 to the Alaska and United States Economies

Executive summary
The Pebble Limited Partnership (also referred to as “PLP” or “Pebble” in this report) has the potential to develop
one of the most significant discoveries of copper, gold, molybdenum, and silver in the world. The poly-metallic
prospect, located 200 miles southwest of Anchorage, Alaska, and over 120 miles from Bristol Bay, is principally
a copper deposit. The Pebble deposit’s 5.9 billion tonnes of measured and indicated mineral resources contain
an estimated 55 billion pounds of copper, 3.3 billion pounds of molybdenum, and 67 million ounces of gold. Its
4.84 billion tonnes of inferred resources contain an estimated 26 billion pounds of copper, 2.3 billion pounds of
molybdenum, and 40 million ounces of gold. The Pebble deposit also contains significant amounts of silver,
                        1
rhenium and palladium . IHS was commissioned to conduct a benchmark assessment of the potential economic
contributions to Alaska and the Lower 48 states of a “conceptual” Pebble Mine (also referred to as “the mine” in
this report), comparable in size and scale to the plans PLP will ultimately submit for approval. Although IHS
Global Insight utilized preliminary planning information provided by PLP as key inputs for the models used to
assess the potential long term economic contributions of the “conceptual” Pebble Mine, IHS Global Insight is
exclusively responsible for all of the analysis and content within this report. Additional comprehensive economic
studies will be needed as the development plan is further refined and finalized.

               Potential average annual economic contribution of the Pebble Mine2

                                                                Alaska                     Lower 48                 Total
                     Jobs supported                               4,725                       11,450                16,175
Construction
                     Contribution to GSP/GDP                     $400m                       $1,175m               $1,575m
Phase
(years 1-5)          Government revenues                     Federal: $54m               Federal: $128m
                                                                                                                    $ 323m
                     (federal and state & local)              S&L: $27m                   S&L: $114m

                     Jobs supported                               2,890                       11,825                14,715
Initial
Production                                                                                                        $2,430m to
                     Contribution to GSP/GDP              $1,140m to $1,435m                 $1,290m
Phase                                                                                                              $2,725m
(years 5-29)
                     Government revenues               Federal: $164m to $218m           Federal: $176m            $670m to
                     (federal and state & local)        S&L: $165m to $213m               S&L: $165m                $772m
Potential            Jobs supported                               2,750                       13,900                16,650
Subsequent
                                                                                                                  $3,660m to
Development          Contribution to GSP/GDP              $2,140m to $2,360m                 $1,520m
                                                                                                                   $3,880m
Phase
(20-year period)     Government revenues               Federal: $410m to $460m           Federal: $200m           $1,156m to
                     (federal and state & local)        S&L: $351m to $396m               S&L: $195m               $1,251m

1         th
 ‘Mar. 18 , 2010 SEDAR filing of NI 43-101 Technical Report by Northern Dynasty Minerals,’
http://www.sedar.com/DisplayCompanyDocuments.do?lang=EN&issuerNo=00003151
2
  The direct contributions to GDP and government revenues will be affected by the value of production of the Pebble Mine. For this
study two refined-metal price forecasts, one from IHS and one from mining, metal, and fertilizer industry analysis firm CRU, were used
to establish a range for the value of production of the Pebble Mine. To approximate the value of the ore concentrates, the price
forecasts were discounted 12% to remove estimated refining and transportation costs. As such, the contribution to GDP and
government revenues attributable to the direct operations of the Pebble Mine are presented as ranges in the above table and
elsewhere in this study.

May 2013                                                                                                                  Page iii
The Economic and Employment Contributions of a Conceptual Pebble Mine
to the Alaska and United States Economies
While more detailed results are presented throughout this report, the table above captures the salient top-line
3
average annual impacts of the Pebble Mine . For each year of the Construction Phase (CP), the mine will, on
average, support over 16,000 jobs across Alaska and the Lower 48, contribute $400 million to Alaska’s gross
state product (GSP) and $1.6 billion to US gross domestic product (GDP), and generate total government
revenues of $323 million. The average annual contributions over the 25-year Initial Production Phase (IPP) will
include supporting nearly 15,000 workers. Additional annual contributions of the IPP include: increasing Alaska’s
GSP by more than $1.1 billion, contributing more than $2.4 billion to US GDP, and generating over $670 million
in government revenues. IHS also estimates that approximately 17% of the measured, indicated, and inferred
resources in the Pebble Mine will be extracted by the end of the Initial Production Phase; therefore, IHS
developed a high-level assessment of the potentially significant economic contributions the Pebble Mine could
make during Potential Subsequent Development Phases (PSDPs). Any potential subsequent development of
that resource will be dependent on the technology developments and economics at that time, as well as the
issuance of new project permits and National Environmental Policy Act (NEPA) review.
Presently, PLP does not have a definitive, approved, and permitted development plan in place. Therefore, IHS
selected a snapshot of PLP’s ongoing engineering plans to serve as a proxy for the construction, operating, and
production schedules necessary to develop the economic contribution assessment. Then, IHS segmented the
Pebble engineering plans into three distinct phases with the following characteristics and modeled the potential
economic impacts of each phase.
Construction Phase (years 1–5): The first phase is characterized by significant capital expenditures for
equipment, structures, and other capital inputs required to develop the infrastructure that supports resource
mining activities. During this phase, Alaska, in particular, and the Lower 48 states will experience an increase in
economic and employment activity from the capital-intensive outlays driven by the infrastructure build-out and
the preparation of the mine for resource extraction. PLP will spend approximately $1.2 billion per year on direct
capital investment and wages during the Construction Phase.
Initial Production Phase (years 5–29): This anticipated 25-year period is inclusive of the ramp-up and “steady-
state” production levels of the mining operations and is limited by the duration of the first mining permit.
Production is entirely dependent on the length of the initial permit as approved through the regulatory review
process. Direct spending will shift to expenditures associated with the day-to-day staffing, maintenance, and
operation of the Pebble Mine.
PLP’s annual operating expenses, sustaining capital expenditures, and direct labor costs will exceed $1
billion in the IPP.
The mine’s cumulative production of copper in concentrate during the IPP is expected to be almost 5.6
4
million metric tons, valued between $29.5 billion and $30.6 billion (2011 US dollars). Annual production,
which will range from about 148,000 to 314,000 metric tons, is valued between $726.7 million and $1.7
billion.
With an average annual copper ore production of 222.3 thousand metric tons, the Pebble Mine would
5
expand total US copper production by 20% above the 2011 production level of 1.1 million metric tons.
The cumulative value of mineral concentrates produced during the Initial Production Phase will reach
between $47.8 billion and $55.1 billion, with a peak annual production value between $2.9 billion and
$3.3 billion (in 2011 US dollars).
3
Appendix B contains an overview of methodologies used to model the economic contributions and tax implications of the Pebble
Mine. Appendix D provides detail on the metal price forecasts and the valuation of Pebble Mine output.
4
IHS Global Insight’s metal forecast produced a lower valuation; the CRU’s metal forecasts produced a higher valuation.
5
US Geological Survey, Mineral Commodities Summary, January 2012
May 2013 Page iv
The Economic and Employment Contributions of a Conceptual Pebble Mine
to the Alaska and United States Economies
Potential Subsequent Development Phases (years 30+): Under the production assumptions used in this
study, only 17% of the mine’s measured, indicated, and inferred mineral resources will be extracted by the end
of year 29 and, if the same mining rate is maintained in subsequent years, some 42% will be extracted by year
50. The volume and grade of the ore extracted from the Pebble Mine is expected to rise beyond year 29,
potentially driving the average annual valuation of the concentrates to over $3 billion (a 50% increase over the
valuations during the IPP). Based on these assumptions, IHS developed top-line estimates of the potential
ongoing annual economic contributions during a 20-year Potential Subsequent Development Phase (years 30
through 49): almost 2,800 jobs in Alaska and 14,000 jobs in the Lower 48, while contributing over $3.6 billion to
US GDP.
Barring any financial, permitting, or physical limitations that may curtail assumed production levels of the Pebble
Mine, IHS estimates three such 20-year PSDPs could be possible before exhaustion of the mineral resources.
Given the degree of uncertainty, this estimation is not a prediction by IHS; instead, it is intended to underscore
that the Pebble Mine could have a viable life that extends well beyond the IPP. Potential Subsequent
Development Phases are not certain and would be contingent on many factors, including undergoing an
extensive multi-agency regulatory review process and separate permit authorization.
Each phase will result in broad levels of economic contributions for Alaska and the Lower 48 states. To
accurately quantify the corresponding economic and employment effects associated with the Pebble Mine, IHS
developed methodological approaches to capture the unique economic contributions of the Construction, Initial
6
Production, and Potential Subsequent Development Phases . The dimensions of economic contribution
assessed for each phase included: employment; value added [contribution to Alaska’s GSP and US GDP]; and
labor income. These dimensions were quantified on three distinct sublevels:
Direct contribution, which is the effect of a core industrial sector (in this case mining);
Indirect contribution, which is the impact on the supplier industries; and
Induced contribution, which captures the effects triggered by workers employed in the direct and
indirect industries spending portions of their income in the general economy.
Finally, government revenues were modeled on the federal and state levels, including state mining licensing
taxes and royalty payments as well as severance tax payments to the Lake and Peninsula Borough (where the
Pebble Mine would be located).
IHS enhanced the economic contribution assessment with a qualitative perspective based on a review of
supplementary social research and interviews with stakeholders in the region. A limited number of interviews
were conducted to provide further context into the region’s demographics, industry composition, and expected
economic impacts. While the region’s residents cannot fully envision how the proposed mine’s operations will
affect their communities and businesses, many have already witnessed opportunities related to Pebble’s
exploratory work in the area. As the mine moves to the operating phase, stakeholders expect the region would
benefit from diversified job opportunities, increases in disposable income, improved transportation and shipping
infrastructure, and other capital improvements funded through local taxes paid by PLP. Stakeholders in the
immediate area acknowledge that the mine’s development is politically divisive, both in the state and in their
communities, but are generally optimistic that this project will lead to new economic opportunities in the nearby
villages.
6
More detail on the methodologies used to model the potential economic contributions and government revenues of the
proposed Pebble Mine are presented in Appendix B.
May 2013 Page v
The Economic and Employment Contributions of a Conceptual Pebble Mine
to the Alaska and United States Economies
Average economic contributions of the Pebble Mine to Alaska and the Lower 48
Construction Phase Direct Indirect Induced Total
Jobs Supported 2,525 925 1,275 4,725
Average Wage ($) $75,000 $65,000 $39,000 $63,500
Contribution to GSP/GDP $210m $90m $100m $400m
Value Added/worker ($) $83,000 $97,500 $78,500 $84,500
Government Revenues Average Annual 5-Year Cumulative
Federal $54m $270m
State $27m $135m
Initial Production Phase Direct Indirect Induced Total
Jobs Supported 915 1,175 800 2,890
Average Wage ($) $109,500 $68,000 $37,500 $72,500
Contribution to GSP/GDP* $970m to $1,265m $110m $60m $1,140m to $1,435m
Value Added/worker ($)* $1,060,000 to $1,382,500 $93,500 $75,000 $394,500 to $496,500
Government Revenues* Average Annual 25-Year Cumulative
Federal $164m to $218m $4,100m to $5,450m
State Taxes $115m to $151m $2,875m to $3,775m
Alaska State Royalty Payments
Severence Taxes Paid to L&P Borough
$21m to $29m
$29m to $33m
$525m to $725m
$725m to $825m
Potential Subsequent Dev. Phase Direct Indirect Induced Total
Jobs Supported 1,050 800 900 2,750
Average Wage ($) $114,500 $75,000 $44,500 $80,000
Contribution to GSP/GDP* $1,990m to $2,210m $80m $70m $2,140m to $2,360m
Value Added/worker ($)* $1,895,000 to $2,105,000 $100,000 $78,000 $778,000 to $858,000
Government Revenues* Average Annual 20-Year Cumulative
Federal $410m to $460m $8,200m to $9,200m
State Taxes $261m to $291m $5,220m to $5,820m
State Royalty Payments $45m to $55m $900m to $1,100m
Severence Taxes Paid to L&P Borough $45m to $50m $900m to $1,000m
* a). Ranges derived by merging model results of IHS and CRU metal price forecast scenarios.
b). The increase in GSP/GDP contribution and Taxes in the IPP and PSDP relative to the CP reflect the high value-added of the ore
concentrates produced by the Pebble Mine.
Construction Phase Direct Indirect Induced Total
Jobs Supported -- 6,250 5,200 11,450
Average Wage ($) $68,000 $48,000 $59,000
Contribution to GSP/GDP -- $725m $450m $1,175m
Value Added/worker ($) $116,000 $86,500 $102,500
Government Revenues Average Annual 5-Year Cumulative
Federal $128m $640m
State $114m $570m
Initial Production Phase Direct Indirect Induced Total
Jobs Supported 305 6,070 5,450 11,825
Average Wage ($) $109,500 $75,500 $47,500 $63,500
Contribution to GSP/GDP -- $820m $470m $1,290m
Value Added/worker ($) $135,000 $86,000 $109,000
Government Revenues Average Annual 25-Year Cumulative
Federal $176m $4,400m
Lower 48 State Taxes $165m $4,125m
Potential Subsequent Dev. Phase Direct Indirect Induced Total
Jobs Supported 350 7,150 6,400 13,900
Average Wage ($) $114,500 $79,500 $48,500 $66,000
Contribution to GSP/GDP -- $970m $550m $1,520m
Value Added/worker ($) $135,500 $86,000 $109,500
Government Revenues Average Annual 20-Year Cumulative
Federal $200m $4,000m
State Taxes $195m $3,900m
Source: IHS Global Insight
May 2013 Page viThe Economic and Employment Contributions of a Conceptual Pebble Mine
to the Alaska and United States Economies
TABLE OF CONTENTS
Executive summary .....................................................................................................................iii
1. Introduction ............................................................................................................................ 1
The structure of this report ........................................................................................................................ 3
How economic contributions are reported ................................................................................................ 3
2. Overview of the Pebble Mine .................................................................................................. 4
3. Economic contribution to the Alaska economy ........................................................................ 7
Employment contribution ........................................................................................................................... 8
Value-added contribution to GDP and labor income ................................................................................. 9
Government revenue and taxes ............................................................................................................... 10
4. Economic contribution to the Lower 48 state economies ........................................................11
Employment contribution ......................................................................................................................... 12
Value-added contribution to GDP and labor income ............................................................................... 13
Government revenue and taxes ............................................................................................................... 14
5. Potential Subsequent Development Phases ............................................................................15
6. Qualitative economic impact analysis .....................................................................................17
Conclusion .................................................................................................................................25
Appendix A: Economic contribution of the Pebble Mine: summary tables ...................................27
Appendix B: Modeling approach and methodology ....................................................................32
Modeling the economic contribution of the Construction Phase ............................................................ 35
Modeling the economic contribution of the Initial Production Phase ..................................................... 37
IMPLAN model .......................................................................................................................................... 42
Appendix C: Data requirements and assumptions.......................................................................47
Appendix D: Price assumptions and valuation of Pebble Mine output .........................................54
Pebble Mine production forecasts and valuation of output .................................................................... 57
May 2013 Page viiThe Economic and Employment Contributions of a Conceptual Pebble Mine
to the Alaska and United States Economies
1. Introduction
The Pebble Limited Partnership has the potential to develop one of the most significant discoveries of
copper, gold, molybdenum, and silver in the world. The poly-metallic prospect, located 200 miles southwest
of Anchorage, Alaska, and over 120 miles from Bristol Bay, is principally a copper deposit. The Pebble
deposit’s 5.9 billion tonnes of measured and indicated mineral resources contain an estimated 55 billion
pounds of copper, 3.3 billion pounds of molybdenum, and 67 million ounces of gold. Its 4.84 billion tonnes
of inferred resources contain an estimated 26 billion pounds of copper, 2.3 billion pounds of molybdenum,
and 40 million ounces of gold. The Pebble deposit also contains significant amounts of silver, rhenium and
palladium. IHS was commissioned to conduct a benchmark assessment of the potential economic
contributions to Alaska and the Lower 48 states of a “conceptual” Pebble Mine, comparable in size and scale
to the plans PLP will ultimately submit for approval. Although IHS Global Insight utilized preliminary planning
information provided by PLP as key inputs for the models used to assess the potential long term economic
contributions of the “conceptual” Pebble Mine, IHS Global Insight is exclusively responsible for all of the
analysis and content within this report. Any proposed mining plan will be subject to an exhaustive, multi-
year regulatory review process involving multiple state and federal agencies, and an extensive public
comment period. Thus, additional comprehensive economic studies will be needed as the development plan
becomes more refined and finalized.
Annual average contribution of the Pebble Mine to Alaska and the Lower 48
Jobs Supported (workers) Contribution to GSP/GDP* (2011 US dollars)
Lower 48
Lower 48 $1,290m
11,450 Lower 48
11,825
Lower 48
$1,175m
Alaska
$1,288m
Alaska Alaska, $400m
4,725 Alaska
2,890
Construction Initial Production
Construction Initial Production Phase Phase
Phase Phase
*Alaska’s GDP contribution during the Initial Production Phase shown
above is the average of the IHS and CRU metals pricing scenario results
Source: IHS Global Insight
The activities associated with building and operating the Pebble Mine have the potential to create significant
economic benefits in terms of employment, government revenues, and value-added contributions to GDP.
During the Construction Phase (CP), the project will require various mining-related machinery and
equipment, trucks, and other equipment and crews to develop the required infrastructure and commence
the mining activities. The Construction Phase is expected to start in year 1 and continue for five years. The
Initial Production Phase (IPP) is expected to extend from year 5 to year 29. Potential Subsequent
Development Phases (PSDPs) are assumed to continue beyond year 29, with extraction continuing until the
economic and technical exhaustion of the resource. The project will require billions of dollars in capital
investment and thousands of employees working directly in the mining industry, working for companies that
May 2013 Page 1The Economic and Employment Contributions of a Conceptual Pebble Mine
to the Alaska and United States Economies
supply services and materials to the mine, and working in ancillary industries throughout Alaska and the
Lower 48 economies. The contributions of these activities to Alaska and the Lower 48 economies include:
Employment: During the Construction Phase (years 1–5), activities as a result of the Pebble Mine are
expected to contribute on average over 4,700 jobs to the Alaskan economy and almost 11,500 to
the Lower 48. During the Initial Production Phase (years 5–29) the average number of jobs
contributed in Alaska is expected to approach 2,900 while the Lower 48 will gain almost 12,000.
GDP: Annual average value-added contribution in Alaska during the Construction Phase is expected
to approach $400 million per year and grow to between $1.1 and $1.4 billion during the IPP. Annual
average value-added (GDP) contribution to the Lower 48 during the Construction Phase is estimated
at $1.2 billion per year and is expected to modestly increase to $1.3 billion during the IPP.
Government Revenue: During the IPP, the Government revenue distribution
Pebble Mine will generate between $16.8 and (based on an averaging of IHS and CRU pricing scenarios)
$19.3 billion in federal, state, and local taxes. L&P
Alaska
Alaska will realize between $136 and $180 State
Borough
Severance
Taxes
million in annual state taxes and royalty 22%
Taxes
4%
payments. The cumulative 25-year total for
Alaska will range from $3.4 to $4.5 billion. Distribution of
Government Revenues Lower 48
The Lake and Peninsula Borough will collect Initial Production Phase State
Taxes
23%
from $29 million to $33 million each year in
Federal
severance taxes, adding up to $725–825 million Taxes
51%
over the Initial Production Phase.
The Lower 48 states will collect a total of $4.1
billion in state taxes (averaging $165 million
Source: IHS Global Insight
annually) during the IPP.
The federal government will reap a cumulative total of $8.5–9.9 billion, equivalent to about $340–
395 million for each year of the Initial Production Phase.
Pebble Mine development would also include various infrastructure investment options that may enhance
the local economy, including a multi-modal port, power plant, and a transportation corridor. It is anticipated
the development of this infrastructure would create additional value for the local communities, including
potentially lower power expenses, easier access to transportation, and lower shipping costs, as well as
opportunities for economic growth and diversification.
This study separately examines the economic contributions of: capital expenditure requirements during the
CP; and the operating expenditures and revenues associated with the Pebble Mine’s potential production
levels of copper, gold, silver, and molybdenum during the IPP. Also, a high-level assessment of a 20-year
Potential Subsequent Development Phase was developed. The economic contributions of these phases were
calculated using IHS Global Insight's economic impact assessment models, which generate estimates of the
resultant jobs, value-added contribution to GDP, labor income, and government revenues in the State of
Alaska and the Lower 48.
May 2013 Page 2The Economic and Employment Contributions of a Conceptual Pebble Mine
to the Alaska and United States Economies
The structure of this report
The main body of this report is divided into six sections and a conclusion. Four appendices provide detail on
the methodologies, research, and data relied upon for our analysis.
Section 1 serves as an introduction to the study and its key findings.
Section 2 provides an overview and background of the Pebble Mine.
Section 3 presents the anticipated contribution of the Pebble Mine to the Alaska economy.
Section 4 presents the anticipated contribution of the Pebble Mine to the Lower 48 economies.
Section 5 provides insight into the potential contribution to Alaska and the Lower 48 economies from
Potential Subsequent Development Phases.
Section 6 presents a qualitative impact analysis in the state of Alaska.
Conclusion summarizes the main findings and conclusion of the economic contribution assessment.
Appendix A includes summary tables of the economic contribution results presented in the main
body of this report.
Appendix B presents the modeling approach underlying the economic contribution analysis.
Appendix C provides an overview of the study’s data requirements.
Appendix D includes details on the potential Pebble Mine production schedules as well as the IHS
and CRU commodity price outlooks used to determine valuations of the Pebble Mine production.
How economic contributions are reported
Employment contribution
This study focused on the economic contribution during two distinct phases of the Pebble Mine. The first is
the Construction Phase (years 1–5) during which many construction and manufacturing jobs will be
supported. The Initial Production Phase (years 5–29) will see many of these jobs change in focus as
infrastructure build-out ends, leaving jobs mainly in the direct core industry (mining) and indirect supplier
industries. These phases were separately analyzed and results for each phase are presented in this report.
In addition, summary estimates of the potential impacts of a representative 20-year Potential Subsequent
Development Phase were developed.
Value-added contribution to GDP/GSP
Value added is the difference between the sales price and the production cost of products or services (i.e.,
total value added is revenue less external purchases of intermediate goods and services). The frequently
cited US GDP is simply the sum of value added across all products and services produced in the United
States. The corresponding measure for a state is gross state product, or GSP. Both GDP and GSP are
generally considered the broadest measure of the health of a national or state-level economy. Thus,
assessing the value-added contribution of the Pebble Mine demonstrates the vital role it could play to
Alaska, the Lower 48, and US economies.
Labor income contribution
A subcomponent of value added is labor income, which captures the compensation (wages and benefits)
paid to workers. A common measure of the relative contribution of an industry to the overall economy is
labor income per worker. The higher the ratio, the greater is each worker's quality and contribution to
growth.
Government revenues
Increased activity in the mining industry will increase the federal, state and local government taxes paid by
PLP, its employees, its extensive supply chain, companies in ancillary industries, and so on.
May 2013 Page 3The Economic and Employment Contributions of a Conceptual Pebble Mine
to the Alaska and United States Economies
2. Overview of the Pebble Mine
Fueled by globalization trends and growing industrialization in emerging markets, the world has witnessed a
commodities boom since 2004; despite recent sluggishness in the global economy, the consensus outlook
for commodities broadly suggests long-term buoyancy in the market. Although short-term market drivers
such as ultra-low interest rates will likely yield to tightening credit conditions, the underlying fundamentals
of commodities demand are encouraging. Favorable mega-trends include underlying global population
growth and the rise of a global middle class hungry for consumer goods. Additionally, as emerging
economies endowed with abundant natural resources seek to diversify their economic structures to include
downstream production of value-added goods, demand for raw material inputs will remain vigorous.
Long-term base metals consumption growth
(percent change from a year earlier)
20%
15%
10%
5%
0%
-5%
-10%
-15%
-20%
-25%
2006 2008 2010 2012 2014 2016 2018 2020
N America Europe Asia
Source: IHS Global Insight
As shown in the chart on the following page, for Alaska, construction, natural resources, and mining will
continue to be a dominant driver of the state economy. Although oil production has experienced a decline
from its peak of two million barrels per day to approximately 550,000 barrels per day today, the sector may
experience resurgence during the new age of unconventional fuels. Natural resource exploration and
development holds the greatest promise for above-trend employment and revenue growth. Against this
backdrop, development of the Pebble Mine in southwest Alaska is moving to the forefront of a dialogue that
spans jobs, regional economic development, environmental considerations, national resource strategy and,
fundamentally, a sustainable way of life—economically, environmentally, and culturally.
May 2013 Page 4The Economic and Employment Contributions of a Conceptual Pebble Mine
to the Alaska and United States Economies
Alaska employment by sector
(percent change from a year earlier, December 2012)
-4.5 Manufacturing
1.6 Construction, Natural Resources, and Mining
1.9 Trade, Transportation, and Utilities
-0.7 Professional and Business Services
3.5 Educational and Health Services
0.0 Financial Activities
-1.6 Leisure and Hospitality
0.0 Information
2.8 Other Services
-0.7 Government
Source: IHS Global Insight, BLS
The Pebble Mine, to be located southwest of Anchorage, Alaska, would have Iliamna/Newhalen and
Nondalton as its nearest communities. The Pebble deposit’s 5.9 billion tonnes of measured and indicated
mineral resources contain an estimated 55 billion pounds of copper, 3.3 billion pounds of molybdenum, and
67 million ounces of gold. Its 4.84 billion tonnes of inferred resources contain an estimated 26 billion pounds
of copper, 2.3 billion pounds of molybdenum, and 40 million ounces of gold. The Pebble deposit also
contains significant amounts of silver, rhenium and palladium. The measured, indicated, and inferred
mineral resources would place the Pebble Mine among the largest mineral deposits in the world.
Advocates for mining the deposit highlight the tremendous potential for job and revenue creation for the
Alaska economy. A 50:50 partnership between a subsidiary of Anglo American and a subsidiary of Northern
Dynasty Minerals, the Pebble Limited Partnership continues to conduct an exploration drilling program to
further ascertain the extent of mineral resources, as well as other technical, engineering, and environmental
studies to facilitate mine planning and prepare for federal and state permitting under the National
Environmental Policy Act (NEPA). Mineral extraction would require significant capital investment and would
initially utilize open-pit mining methods, with opportunities for both open-pit and underground mining
methods for deeper, higher-grade portions of the deposit after the IPP. PLP has not yet pursued the
requisite development permits because a development project plan is in the formative stages. The focus of
this study is to provide an objective understanding of the potential economic contributions to Alaska and
the Lower 48.
The region of southwest Alaska in which the Pebble Mine would be located has already experienced new
business and employment opportunities tied to PLP’s exploration of the area. Those interviewed noted that
local transportation businesses (helicopter, barge, and fixed-wing airplane) have already increased their
customer base, and that PLP has also created business opportunities for catering, lodging, construction, field
activities and consulting businesses. Stakeholders interviewed in the region anticipate significant economic
benefits would occur during the IPP. Although hard for them to quantify at this time, the anticipated positive
economic impacts include an increase in jobs, disposable income, new tax revenue for the nearby villages,
May 2013 Page 5The Economic and Employment Contributions of a Conceptual Pebble Mine
to the Alaska and United States Economies
state, and country, access to lower-cost and diversified food products and goods, more affordable energy,
improved education and health services, and overall increased choices for employment and spending.
To fully assess the broad-based economic impacts of the development of the Pebble Mine, PLP engaged IHS
Global Insight to model the economy-wide contributions at the Alaska, Lower 48, and US national levels. The
quantitative analysis is buttressed by a qualitative assessment that examines regional social impacts derived
from stakeholder interviews. IHS Global Insight has also drawn from our nonferrous metals and mining
experts to inform the modelling process and to provide important context with respect to the dynamics of
the global commodities markets. The IHS economic impact analysis also integrates insights and knowledge
from the McDowell Group, an Alaska-based economic consulting firm.
Project planning at the Pebble Limited Partnership is an ongoing process, such that a definitive mine plan
has yet to be completed. To facilitate this study, PLP shared with IHS a planning iteration from its ongoing
engineering work for a conceptual mine that is typical of the size and scale of operation that Pebble intends
to permit, build and operate. This conceptual mine plan is indicative only, rather than determinative. Data
from this planning iteration served as one of the input sources for IHS’s economic impact assessment
models.
PLP has requested that all of the physical and operating parameters associated with this conceptual mine
plan not be presented in this study to avoid any confusion about the specific project design that will
ultimately be proposed for permitting. Characteristics of the conceptual mine plan utilized in this study
include:
A conventional open pit mining operation for both the initial production period and possible
subsequent development phases;
Standard infrastructure required under any project design –including a port facility, self-generation
power facilities and a transportation corridor to connect the port to the mine site;
Capital costs, operating costs and production profiles as reported in subsequent sections of this
report;
Industry standard labor complements;
Industry standard environmental management, including reclamation, closure and monitoring.
IHS initiated a three-stage process to translate the schedules into a set of input data for the IMPLAN7 and
IHS-proprietary models utilized to assess the Pebble Mine’s potential economic contribution to the Alaska
and Lower 48 economies.
The first stage involved a series of working sessions between the Pebble Limited Partnership, the McDowell
Group, and IHS to map spending levels in the preliminary capital, operating, and sustaining capital schedules
to the primary industries that would provide the products and services specified in those schedules. North
American Industry Classification System (NAICS) codes were used during this mapping exercise. This step
was followed by a series of working meetings to determine the most likely sourcing region (Alaska, Lower
48, and Non-US) for each expenditure category. This stage was one of the most critical steps of the analysis
because it determined the regional sourcing of the inputs, which are key drivers of economic contribution.
Finally, IHS mapped separately the spending-by-NAICS code for Alaska and the Lower 48 to the IMPLAN
industry scheme.
7
www.implan.com
May 2013 Page 6The Economic and Employment Contributions of a Conceptual Pebble Mine
to the Alaska and United States Economies
3. Economic contribution to the Alaska economy
During the five-year Construction Phase, capital investment will be made to build the infrastructure required
to sustain mining operation. Alaska will enjoy opportunities for job creation, economic growth, and
increased government revenues. The Construction Phase of the Pebble Mine will be characterized by the
following economic contributions:
More than 4,700 jobs, on average, will be created across the direct, indirect, and induced categories
in Alaska—specifically, 2,525 direct jobs, 925 indirect jobs, and 1,275 induced jobs will be created.
Driven largely by the direct employment opportunities, Alaska will add high-value jobs that generate
an average annual labor income of $300 million or nearly $63,500 per employee—which is 25%
higher than the expected $51,000 average annual earnings for all workers in Alaska during 2012.
Average annual total value added—contributions to Alaska’s GSP—will be about $400 million.
The annual average of state personal and corporate tax revenues will be about $27 million, but they
will remain relatively small when compared with the Initial Production Phase ($115–151 million).
The reason is that the Construction Phase is characterized by capital expenditures rather than
income-earning activities.
Turning to the Initial Production Phase, large-scale capital expenditures shift to operating expenditures. As a
result, Alaska will experience a relative shift in the sources of opportunities for economic growth. The
employment opportunities will moderate as construction jobs from the CP shift to mine production jobs.
Average value added to Alaska’s gross state production and, more importantly, tax receipts become
significantly larger, driven by the ongoing production activity and profitability of the mine. The economic
contributions for this phase will include:
Nearly 2,900 jobs, on average, created across the direct, indirect, and induced labor categories—
915, 1,175, and 800, respectively. Under this phase, the composition of jobs shifts from direct
employees to indirect employees as the broader supply chain is tapped to support ongoing
operations.
Despite the compositional shift and decline in average labor income to $210 million, the jobs
generated represent a higher average annual income per employee: direct workers in the Pebble
Mine will average $109,500 in annual compensation (more than double the state average) while the
overall labor income (direct, indirect, and induced) will average $72,500 per year.
Average annual total value added—contributions to GSP—will reach between $1.1 billion and $1.4
billion or nearly 2.5–3.0% of Alaska’s 2011 state domestic product.
Most importantly, during the IPP, the Pebble Mine will generate $3.4–4.5 billion in additional tax
receipts from mining licenses and royalty payments as well as from personal and corporate taxes for
the state of Alaska (annual average of $136–180 million). In addition, severance taxes flowing to the
Lake and Peninsula Borough will average $29–33 million each year (or $725–825 million over the 25-
year period).
May 2013 Page 7The Economic and Employment Contributions of a Conceptual Pebble Mine
to the Alaska and United States Economies
Employment contribution
During the five-year Construction Phase, which Average annual Alaska employment
encompasses the capital expenditures necessary during the Construction Phase
to build the infrastructure required to sustain
operations, Alaska will enjoy additional job
creation opportunities, economic growth, and Induced
increased government revenues. Overall, the CP of 1,275
the Pebble Mine will be characterized by an annual
Average Annual
average of over 4,700 jobs (direct, indirect, and Jobs Supported in Direct
Alaska: 2,525
induced) supported across various industry 4,725
sectors.
Indirect
Turning to the Initial Production Phase, large-scale 925
capital expenditures will shift to operating
expenses. As a result, Alaska will experience a
relative shift in the sources of opportunities for Source: IHS Global Insight
economic growth. According to the Alaska
Department of Labor and Workforce Development8, approximately 70% of metal mining workers in Alaska
were Alaska residents in 2010. Based on primary research conducted by the McDowell Group and PLP’s
aggressive local hiring strategy, IHS assumed, on average, the mine will directly employ 1,220 workers, of
which 915 (or 75%) were assumed to be Alaskan residents. The ramp-up of jobs is shown in the following
chart. On average, approximately 2,900 total jobs per year will be created across the direct, indirect, and
induced labor categories during the IPP in Alaska; however, under this phase, relative to the CP, the
composition of jobs shifts from direct employees towards indirect employees as the broader supply chain is
tapped to support ongoing operations.
Average annual Alaska employment during the Initial Production Phase
5,000
Induced
Jobs Supported
4,000 Indirect 900
Direct
3,000
875 875 2,425 800
2,000 700
650
975 900 1,175
1,000 725 850
700 750 1,000 1,050 1,075 915
0
5- 9 10 - 14 15 - 19 20 - 24 25 - 29 Average
Year
Note: A ramp-up in sustaining capital expenditures between Years 25 and 29 will drive large increases in indirect jobs.
Source: IHS Global Insight
8
“Nonresidents Working in Alaska, 2010” Alaska Department of Labor and Workforce Development, January 2012
May 2013 Page 8The Economic and Employment Contributions of a Conceptual Pebble Mine
to the Alaska and United States Economies
Value-added contribution to GDP and labor income
During the Construction Phase, Alaska will enjoy an increase of $400 million in its average annual gross state
production. As mine production ramps up during the IPP, the annual contribution of the Pebble Mine to the
Alaskan economy will more than triple: rising to over $1.1 billion under the IHS metal price forecast
scenario; $1.4 billion under the CRU metal price forecast scenario. Most of that contribution will be derived
from the value of the mineral concentrates produced by the mine.
Economic contribution summary of the Pebble Mine: Alaska
Average annual value added
(2011 US dollars)
Initial Production Phase
Construction Phase
IHS Scenario CRU Scenario
Direct $210m $970m $1,265m
Indirect $90m $110m $110m
Induced $100m $60m $60m
Total $400m $1,140m $1,435m
Source: IHS Global Insight
The average direct employee in Alaska during the CP will earn $75,000. By comparison, the earnings of
workers in indirect and induced jobs will be more subdued. For the Alaska economy, the average labor
income per employee for 2012 is expected to be $51,000, compared with $63,500 for jobs associated with
the Pebble Mine—nearly 25% higher than the state average.
This expectation is equally true for the Average annual labor income
Initial Production Phase when the average per Alaska worker
labor income for all jobs attributable to the 120,000
Pebble Mine increases to $72,500. There 109,500
will be a dramatic increase in the average 100,000
Labor Income per Worker ($)
wages of direct employees as the
construction jobs of the Construction Phase 80,000
75,000
are replaced by higher-paying positions for
72,500
68,000
60,000
65,000
63,500
mine workers during the Initial Production
Phase. Average Labor Income per mine
40,000
worker is expected to be $109,500—more
39,000
37,500
than double the state average. The higher 20,000
average labor income for jobs attributable
to the Pebble Mine indicates this sector is a 0
Construction Phase Initial Production Phase
potential growth engine for Alaska’s (Years 1 - 5) (Years 5 - 29)
economy over the forecast period. Direct Indirect Induced Overall
Source: IHS Global Insight
May 2013 Page 9The Economic and Employment Contributions of a Conceptual Pebble Mine
to the Alaska and United States Economies
Government revenue and taxes
As shown in the table below, IHS Global Insight estimates the average annual federal and state government
revenues generated in Alaska will be $81 million in the Construction Phase. The five-year total will be $405
million.
Government revenue generated in Alaska during the Construction and Initial Production Phases
(2011 US dollars)
Initial Production Phase Initial Production Phase
Construction Phase IHS Scenario CRU Scenario
Annual Cumulative Annual Cumulative Annual Cumulative
Federal Taxes $54m $270m $164m $4,100m $218m $5,450m
Personal Taxes $49m $245m $19m $475m $19m $475m
Corporate Taxes $5m $25m $145m $3,625m $199m $4,975m
State and Local Taxes and
Royalty Payments $27m $135m $165m $4,125m $213m $5,325m
State Personal Taxes $4m $20m $2m $50m $2m $50m
State Corporate Taxes $23m $115m $69m $1,725m $90m $2,250m
State Mining License Tax $44m $1,100m $59m $1,475m
State Royalty Payments $21m $525m $29m $725m
Severance Taxes Paid to
$29m $725m $33m $825m
L&P Borough
Total Federal, State and
$81m $405m $329m $8,225m $431m $10,775m
Local Government Revenues
Source: IHS Global Insight
Production activity in the mine will increase the
federal, state, and local government taxes paid by Government revenue distribution during IPP
PLP, its employees, its extensive supply chain, (based on an averaging of IHS and CRU pricing scenarios)
companies in ancillary industries, and so on.
L&P
Quantifying government revenues during the IPP will Alaska Borough
State Severance
differ, depending on whether the IHS or the CRU Taxes Taxes
22% 4%
metal price forecast is used as the basis for valuation
of the ore concentrate. The IHS scenario results in an
estimate of $329 million annually and $8.2 billion Distribution of
Government Revenues Lower 48
State
cumulatively. Using the CRU scenario will result in an Initial Production Phase
Taxes
estimate that is 30% higher: $431 million per year and 23%
Federal
$10.8 billion over the entire IPP. The chart at right Taxes
51%
shows that, under either scenario, approximately
one-quarter of the government revenues will remain
within Alaska. The graphic at the bottom of Page 14
shows the distribution of government revenues
Source: IHS Global Insight
across Alaska, the Lower 48 and the federal
government for the CP and IPP.
May 2013 Page 10The Economic and Employment Contributions of a Conceptual Pebble Mine
to the Alaska and United States Economies
4. Economic contribution to the Lower 48 state economies
The Construction and Initial Production Phases of the Pebble Mine will require a broad supply chain and a
network of professional and business services. A significant portion of the supplies, equipment, and services
will necessarily be sourced from the Lower 48. In addition, approximately one-quarter of the mine workers
are expected to originate from the Lower 48.
PLP will spend approximately $1.2 billion per year on capital investment and wages during the Construction
Phase, generating economic opportunities in the Lower 48 states that include:
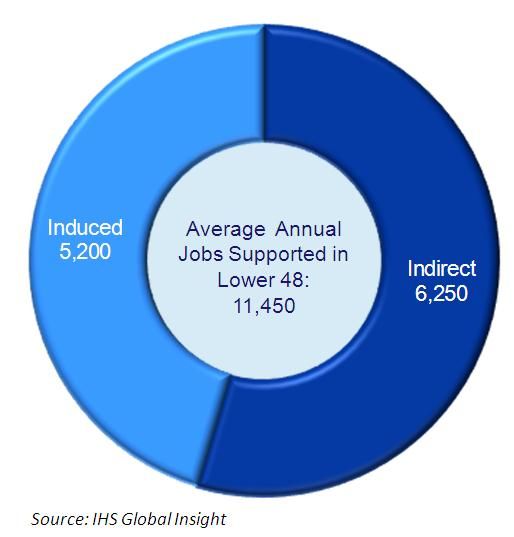
Over 11,000 jobs, on average, created across the indirect and induced labor categories: 6,250 and
5,200, respectively.
On balance, these jobs represent high-value opportunities that generate an average annual labor
income of nearly $675 million or nearly $59,000 per employee—which is 28% higher than the
national average annual earnings for workers of $46,000 in 2012.
Average annual total value added—contributions to the Lower 48 GSP and US GDP—would be
nearly $1.2 billion.
The Lower 48 states will collect a total of $570 million in taxes during the Construction Phase ($114
annually). Activities in the Lower 48 during this phase will also generate federal taxes averaging
$128 million annually ($640 million in total).
Across the Lower 48, the average annual economic contributions from the IPP will include:
Almost 12,000 jobs created across the direct, indirect, and induced labor categories. Of these:
o 305 non-Alaska residents are expected to work directly in the Pebble Mine. While they may
work in Alaska, most of their income will flow back to their home states in the Lower 48.
o 6,070 indirect jobs will be due to PLP’s spending with suppliers in the Lower 48.
o 5,450 induced jobs will be supported as direct and indirect workers spend portions of their
income in the Lower 48.
Bolstered by the income effect from the wages earned within the direct and indirect employment
categories, these jobs will generate an average annual labor income of nearly $750 million or
$63,500 per employee (about 38% higher than the average national wage in the United States).
Average annual total value added—contributions to the Lower 48 GSP—will near $1.3 billion.
Annual personal and corporate tax revenues accruing to Lower 48 state governments will average
$165 million during the IPP. The cumulative total will reach $4.1 billion. The corresponding federal
personal and corporate taxes will amount to $176 million annually and $4.4 billion in total.
May 2013 Page 11The Economic and Employment Contributions of a Conceptual Pebble Mine
to the Alaska and United States Economies
Employment contribution
Building and operating the Pebble Mine will require a Average annual Lower 48 employment
broad supply chain and a network of professional and during the Construction Phase
business services. Many of these resources will be
sourced from the Lower 48, creating economic
opportunities beyond the Alaskan borders. During the
Construction Phase, the employment opportunities in
the Lower 48 will approach 11,500 jobs per year. Driven
largely by the indirect employment opportunities, these
jobs represent high-value opportunities that generate
an average annual labor income of nearly $59,000 per
employee, which is significantly higher than the Lower
48 average annual earnings for workers of $46,000.
Across the Lower 48 states, as the project shifts from
the CP into the IPP, almost 12,000 jobs on average will be created across the direct, indirect, and induced
categories. The forecast ramp-up of jobs is shown in five-year increments in the following chart. The direct
jobs are Pebble Mine workers whose permanent residency is in the Lower 48. While they may be physically
working in Alaska, most of their income will flow back to the Lower 48. Therefore, IHS classified these as
direct jobs within the Lower 48.
Average annual Lower 48 employment during the Initial Production Phase
18,000
Induced
16,000 Indirect 7,725
14,000 Direct
Jobs Supported
12,000 6,050 6,025
10,000 5,450
8,000 8,825
3,975
6,000 3,475 6,825 6,700
6,070
4,000
4,275
3,725
2,000
225 250 325 350 375 305
0
5- 9 10 - 14 15 - 19 20 - 24 25 - 29 Average
Year
Note: A ramp-up in sustaining capital expenditures between Years 25 and 29 will drive large increases in indirect and induced jobs.
Source: IHS Global Insight
May 2013 Page 12You can also read