The Economic and Fiscal Consequences of Immigration - WATER SCIENCE AND TECHNOLOGY BOARD
←
→
Page content transcription
If your browser does not render page correctly, please read the page content below
Committee on National Statistics
           Division of Behavioral and Social Sciences and Education
WATER SCIENCE AND TECHNOLOGY BOARD

                                     The Economic and Fiscal Consequences
                                     of Immigration
                                     Francine D. Blau, Cornell University, Chair

                                      September 22, 2016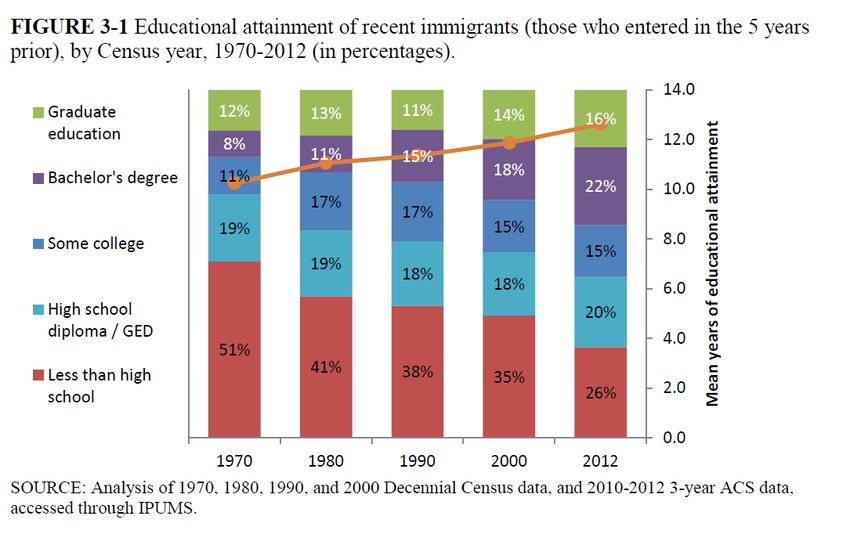
PANEL MEMBERS
FRANCINE D. BLAU (Chair), Department of Economics,               PIA M. ORRENIUS, Research Department, Federal Reserve Bank
Cornell University                                               of Dallas, TX
MICHAEL BEN-GAD, Department of Economics, City University        JEFFREY S. PASSEL, Senior Demographer, Pew Research Center,
London                                                           Washington, DC
GEORGE J. BORJAS, Malcolm Wiener Center for Social Policy,       KIM RUEBEN, Tax Policy Center, Urban Institute, Washington,
John F. Kennedy School of Government, Harvard University         DC
CHRISTIAN DUSTMANN, Department of Economics, University          MARTA TIENDA, Woodrow Wilson School, Princeton University
College London                                                   YU XIE, Princeton Institute of International and Regional
BARRY EDMONSTON, Department of Sociology, University of          Studies, Princeton University
Victoria, BC
ISAAC EHRLICH, Department of Economics, University at
Buffalo, State University of New York
CHARLES HIRSCHMAN, Department of Sociology, University of
Washington
JENNIFER HUNT, Department of Economics, Rutgers University
DOWELL MYERS, Sol Price School of Public Policy, University of
Southern California
CONSULTANTS AND STAFF
GRETCHEN DONEHOWER, University of California at Berkeley, Consultant to the Panel
RYAN EDWARDS, Queens College, City University of New York, Consultant to the Panel
SARAH GAULT, Urban Institute, Consultant to the Panel
JULIA GELATT, Urban Institute, Consultant to the Panel

CHRISTOPHER MACKIE, Study Director
CONSTANCE F. CITRO, CNSTAT Director
ESHA SINHA, Associate Program Officer
ANTHONY S. MANN, Program Coordinator
SPONSORS

• John D. and Catherine T. MacArthur Foundation

• National Academy of Sciences Independent Fund, National Academy of Engineering Independent
  Fund, and National Academy of Medicine Independent Fund
OVERVIEW
• How have immigration patterns changed recently?
• How does immigration affect the U.S. economy?
  – How does immigration impact the labor market?
  – What are the other ways that immigration impacts the economy?
• How does immigration affect public revenue and spending?
  – What are the fiscal effects on federal and state budgets at the aggregate
    (national) level?
  – How does immigration affect the fiscal picture in states?
How have immigration patterns changed recently? Today, nearly one in four Americans are Over the past twenty years, there was an immigrants or second generation (US-born increase in the immigrant share of the children of immigrants) population.
Trends in the unauthorized population

                                    …but if we look at more recent history,
                                    we see that the unauthorized population
                                    actually shrank between 2007 and 2009
                                    and has since leveled off.

                                    => unauthorized population has stopped
                                    growing

Unauthorized immigrant population
increased over the past 20 years…
Immigrant education has increased
• Recent immigrants are more educated than immigrants of the
past
– Native education has increased as well so recent immigrants still have
less education than natives, on average
– Among recent immigrants, younger immigrants are particularly
narrowing the education gap with natives
• Among full population, foreign born more concentrated at the
extremes, overrepresented:
– Among those with less than 4 years of HS AND
– Among those with more than 4 years of college, particularly in STEM
fields
• Foreign-born share of college grads about the same as nativesThe immigrant population has gotten more dispersed Immigrants have become more geographically dispersed – moving to states and communities that historically had few immigrants – though the majority continue to reside in traditional gateway cities and states.
Immigration contributes to labor force growth

– Foreign-born share of the labor force has increased
 from 11% to 16%
– US labor force growth has slowed with the aging of the
 baby boom cohort
– Immigration supplies prime-age workers who have
 helped counterbalance our aging population
– Immigrants and their children are accounting for the
 vast majority of current and future labor force growth
How does an influx of foreign-born workers affect native-
born workers’ employment and wages?

• Economic theory predicts:
   – Native-born workers whose skills are most similar to those immigrant
     workers (close substitutes) are most likely to be negatively affected
   – When immigrants’ skills complement those of native-born workers, the
     presence of immigrant labor may improve their prospects
   – Returns to capital may be increased
• Because of these mixed predictions, theory alone cannot predict the
  effect on native workers; empirical evidence is needed to determine
  the direction and magnitude of any effects
Conceptual issues in empirically estimating effects of
immigration on wages & employment
• Immigration is just one of many factors influencing native wages and
employment
• Immigration itself is influenced by the same factors that shape
overall wages and employment
– Example: immigrants may be drawn to labor markets that are expanding
• Impact of immigration may differ across time and space depending
on the characteristics of the immigrants and labor market conditionsWhat is the impact of immigration on wages? • When measured over a period of 10 years or more, the impact of immigration on the wages of the native-born overall is very small • Estimates for subgroups span a wider range • To the extent negative effects are found, groups that are the closest substitutes to low-skilled immigrants are most likely to experience negative wage effects – Prior immigrants – Native-born, high-school dropouts
What is the impact of immigration on
                     employment?
• Little evidence of effects on the overall employment levels of native
  workers
• Possible negative effects for subgroups
   – Immigrants may reduce hours worked (but not employment) of native teens
   – Some evidence of negative effects on employment rate of prior immigrants
How do high skilled immigrants affect
employment and wages?
• Several studies have found a positive impact of skilled immigration on
wages and employment of both college- and noncollege-educated natives
• This could be because
– high skilled immigrants are complementary with native-born workers
– high skilled immigrants increase innovation and productivity
– high skilled immigrants interact with native-born workers and their skills
“spill over”
• However, some other studies focused on narrowly defined fields find
that immigrants can have adverse effects on wages or productivity of
natives working in those specific fieldsImmigration has a positive effect on economic
growth
• High-skilled immigrants have boosted our capacity for innovation
and technological change
– Research suggests skilled immigrants raise patenting per capita, contributing
to productivity growth
– Immigrants contribute to entrepreneurship
• Immigration supplies prime-age workers who have helped
counterbalance our aging populations (see case of Japan for a
counterexample)Other economic effects of immigration • Reduction in prices of consumer goods in some markets benefits consumers—e.g., child care, food preparation, house cleaning and repair, construction • Immigrants and the second generation are a source of demand in housing markets • Immigrants may help to make labor markets more efficient by flowing where opportunities are best (both when they arrive in the US and in subsequent moves)
What are the fiscal impacts of immigration?

• Immigrants’ fiscal impact depends on the balance between:

   Immigrants’ contribution to revenues by paying taxes
                        versus
   Immigrants’ contribution to expenditures by consuming public
   services
What issues have to be considered when empirically
estimating the fiscal effects of immigration?
– How are the costs of public goods treated?
• Some expenditures increase with each additional person (education or
health care)
• Some expenditures are not affected when an additional person is added
to the population —these are public goods (e.g., national defense)
• We present results using both an average cost and a marginal cost
approach for public goods; makes a big difference to the findingsWhat issues have to be considered when empirically
estimating the fiscal effects of immigration?
• How should the costs of immigrant children/dependents be treated?
– One approach—bundle their costs in with their parents (may be immigrants
themselves or native born)
– Dependent children increase government expenditures on education
– Considering education as a “cost” does not take into account that education
could be considered an investment in future productivity; rewards reaped
when children grow to adulthood
– Most of our estimates include children as a cost—this is an important
assumptionWhat issues have to be considered when empirically
estimating the fiscal effects of immigration?
– What accounting method does the estimate use, and how does
the choice of method affect the results?
• Some studies use a static method that focuses on a particular time period
(like a tax year)
• Others use a dynamic method that can capture fiscal effects over time
(like a taxpayer’s lifecycle)
• We present both types of resultsWhat issues have to be considered when empirically estimating the fiscal effects of immigration? – Do the estimates take into account the impact of immigrant inflows on wages and employment of natives or on economic growth? – We follow the standard approach and do not take these effects into account
A word about generations:

• In our fiscal analyses we distinguish three immigrant generations:
• First generation—these are individuals who were born abroad—this
  is the immigrant group
• Second generation—these are native born persons with at least one
  immigrant parent—they are a subgroup of the native born
• Third-plus generation—these are native born persons with native
  born parents—these are all of the native born with the exception of
  the second generation
FISCAL IMPACTS: EMPIRICAL ESTIMATION

• We provide new empirical estimates:
  – National level (including federal and aggregate state)
      • Static or historical analysis (1994-2013 cross sectional data)
      • Dynamic (projections of net present value of an immigrant and
        descendants using a 75 year time horizon)
   – State level – disaggregated by state
      • Static (2011-2013 cross section)
What are the major determinants of a group’s fiscal
contribution and thus the immigrant-native difference?
– Age-considering expenditures at the individual level:
• Early years costly: educational expenses are high and people contribute little to revenues
• Working years generally positive fiscal balance: people are in the prime working ages and
thus make substantial contributions to tax revenues and less demands on government
expenditures
• Later years costly: individuals have retired or cut back on market work reducing contributions
to tax revenues and they are receiving government retirement and health benefits
– Children/Dependents: If expenses of dependents are included, the middle
years are not so favorable from a fiscal perspective (earnings high but
children likely to be present so costs of educating children also high)
– Education: Lower education associated with lower wages – and therefore
lower contributions through taxes based on earnings and possibly greater
use of transfer programsNet fiscal impact in 2012, per capita, including all levels of government,
by age and immigrant generation (2011-2013 March Current Population Surveys)FISCAL IMPACTS: FINDINGS, NATIONAL LEVEL
1994-2013 Cross Section
• Immigrants tend to have a lower fiscal contribution than the native-born, especially
at the state level
• Immigrants more concentrated in the prime working ages—raises their
contributions, BUT
• Immigrants less well educated—lowers their contributions, controlling for age
• Their concentration in the prime working ages also means they are more likely to
have dependent children present, and they also tend to have a larger number of
children—raises government expenditures on education (benefits received)
– Note: this does not take into account that expenditures on education could be
considered an investment in future productivity; rewards reaped when children
grow to adulthoodFISCAL IMPACTS: FINDINGS, NATIONAL LEVEL
1994-2013 Cross Section
• Second generation has better fiscal picture than 1st or 3rd + generation,
controlling for age (see chart)
• BUT in simple tabulations look less favorable—especially earlier in the
period; this is due primarily to their age distribution: higher shares of
elderly (especially) and also of younger adults
– Earlier in the period dominated by the children of earlier waves of
immigration, especially the large inflow around the turn of the 20th century
– Adult children of the later (more recent waves) are themselves relatively
young (not in the prime working years)FISCAL IMPACTS: FINDINGS, NATIONAL LEVEL
1994-2013 Cross Section
• All three groups (immigrants, second generation, and 3rd+
generation) had fiscal shortfalls—the deficit we are always talking
about!
• In 2013, taking into account dependents and
– using an average cost approach: immigrants accounted for 17.6% of the
population and 22.4% of the deficit; the second generation accounted a
slightly higher share of the deficit (8.7%) than their share of the population
(7.4%)
– using a marginal cost approach: immigrants accounted for 4% of the deficit
and 17.6% of the population
– Assumptions really matter!FISCAL IMPACTS: FINDINGS, NATIONAL LEVEL
Dynamic Analysis (75 year time horizon)
• Permits taking into account contribution of children of immigrants
when they mature and as their education converges to (or exceeds)
native levels
• Fiscal impacts of immigrants are generally positive at the federal
level
• But fiscal impacts still tend to be negative at the state and local levels
– Their methods of taxation recoup relatively little of the later contributions of
educated taxpayersFISCAL IMPACTS: FINDINGS, DISAGGREGATED
STATE LEVEL (2011-2013)
• Consistent with national level analysis, first generation adults
(plus dependents) more costly to state and local governments
than 2nd and 3rd+ generations
• Of the three groups, 2nd generation contributes the most to the
bottom line of state + local government fiscal balances
• The net burden of immigration to fiscal balance sheets varies
tremendously across statesFISCAL IMPACTS: FEDERAL VS STATE LEVEL • Taken together, findings of National and State level analyses raise questions of equity between the federal government and the states and across states in terms of shares of costs and benefits
We need to know more

• We have learned a lot but with better information available to
  researchers, we could learn more
• Data needs:
   – Improve data on second-generation immigrants
      • Addition of birthplace of parents to the American Community Survey (ACS) would make
        a large-sample data set available
   – Improve data on immigrants who enter without authorization
      • We discuss a number of ways to improve data collected on this group
Conclusion • Economic effects: There are many important benefits of immigration, including on economic growth, innovation, and entrepreneurship, with little to no negative effects on the overall wages or employment of native born workers in the longer term. Where negative wage impacts have been detected, native- born high-school dropouts and prior immigrants are most likely to be affected. • Fiscal effects: The fiscal picture suggests negative short-run effects, especially at the state level, when the costs of educating the children of immigrants are included; but the children of immigrants (the second generation) go on to be the most positive fiscal contributors in the population. In the longer term (75 year time horizon), fiscal impact of immigrants are positive at the federal level, though still negative at the state level.
Conclusion
• Recent changes in immigrant patterns: There have been several
  recent significant changes in immigration patterns. Growth in the
  unauthorized population has stopped, and immigrant education has
  risen. Moreover, as US labor force growth has slowed with the aging
  of the population, immigrants and their children will account for the
  vast majority of current and future labor force growth.
You can also read