The economic and social impacts of protecting the environmental values of the waters of the Capricorn and Curtis Coasts - Report prepared for the ...
←
→
Page content transcription
If your browser does not render page correctly, please read the page content below

OCTOBER 2014

The economic and social impacts of protecting the
environmental values of the waters of the
Capricorn and Curtis Coasts

Report prepared for the Department of
Environment and Heritage Protection
Marsden Jacob Associates
Financial & Economic Consultants

ABN 66 663 324 657
ACN 072 233 204

Internet: http://www.marsdenjacob.com.au
E‐mail: economists@marsdenjacob.com.au

Melbourne office:
Postal address: Level 3, 683 Burke Road, Camberwell
Victoria 3124 AUSTRALIA
Telephone: +61 3 9882 1600
Facsimile: +61 3 9882 1300

Brisbane office:
Level 14, 127 Creek Street, Brisbane
Queensland, 4000 AUSTRALIA
Telephone: +61 7 3229 7701
Facsimile: +61 7 3229 7944

Perth office:
Level 1, 220 St Georges Terrace, Perth
Western Australia, 6000 AUSTRALIA
Telephone: +61 8 9324 1785
Facsimile: +61 8 9322 7936

Sydney office:
119 Willoughby Road, Crows Nest
New South Wales, 2065 AUSTRALIA
Telephone: +61 418 765 393

Authors: Jim Binney, Gene Tunny (alphabetical order)

Contact: Gene Tunny, +61 7 3229 7701

This report has been prepared in accordance with the scope of services described in the contract or agreement between
Marsden Jacob Associates Pty Ltd ACN 072 233 204 (MJA) and the Client. Any findings, conclusions or recommendations only
apply to the aforementioned circumstances and no greater reliance should be assumed or drawn by the Client. Furthermore,
the report has been prepared solely for use by the Client and Marsden Jacob Associates accepts no responsibility for its use by
other parties.

Copyright © Marsden Jacob Associates Pty Ltd 2014
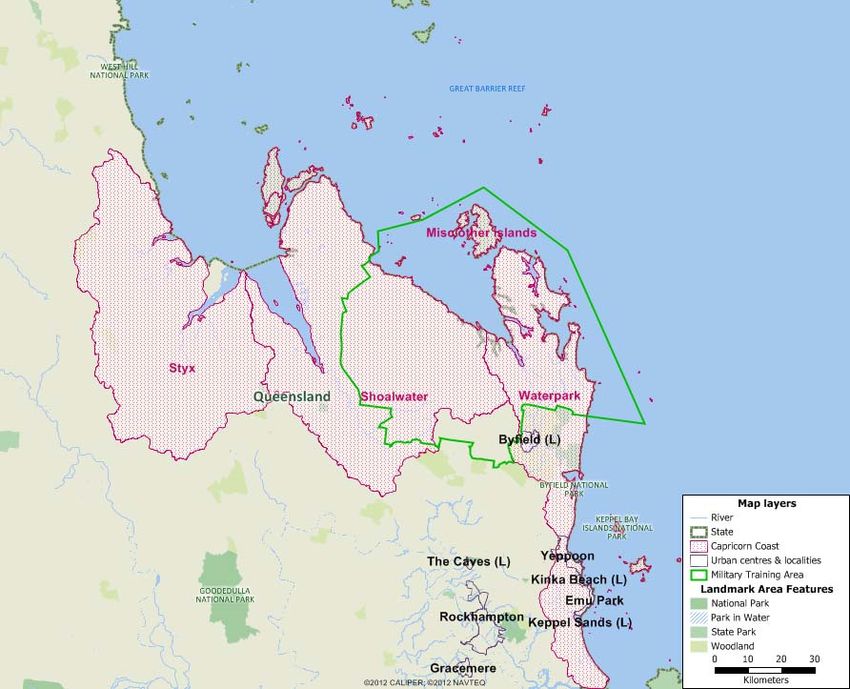
TABLE OF CONTENTS
Page
Key messages .................................................................................................................... 1
1. Introduction ............................................................................................................... 3
1.1 Terms of reference ...................................................................................................................... 3
1.2 Purpose of this study ................................................................................................................... 3
1.3 Context ....................................................................................................................................... 5
2. Capricorn Coast.......................................................................................................... 11
2.1 Introduction ............................................................................................................................... 11
2.2 Socio‐economic profile – Capricorn Coast .................................................................................. 12
2.3 Water quality in the Capricorn Coast .......................................................................................... 21
2.4 Benefits of maintaining Environmental Values ........................................................................... 26
2.5 Costs of improving or maintaining water quality objectives ........................................................ 30
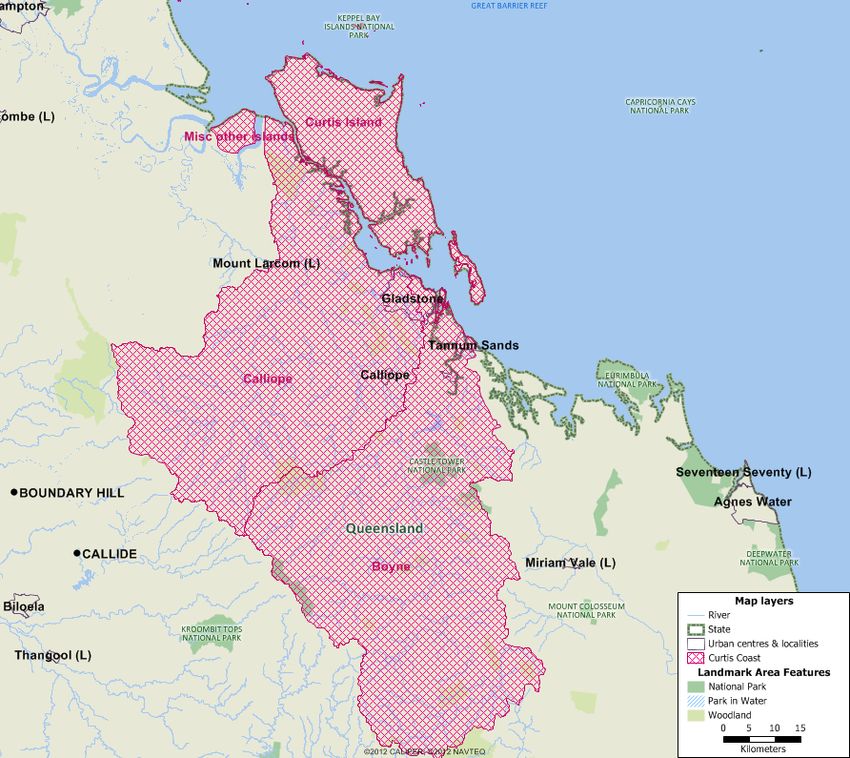
3. Curtis Coast ............................................................................................................... 35
3.1 Introduction ............................................................................................................................... 35
3.2 Socio‐economic profile – Curtis Coast ........................................................................................ 36
3.3 Water quality in the Curtis Coast ................................................................................................ 45
3.4 Benefits of maintaining Environmental Values ........................................................................... 54
3.5 Costs of improving or maintaining water quality objectives ........................................................ 58
4. Implementation issues .............................................................................................. 69
4.1 Intervention choice .................................................................................................................... 69
4.2 Enhancing intervention efficiency ...............................................................................................72
LIST OF TABLES                                                                                                                                         Page

Table 1: Demographic summary 2001, 2006, 2011 – Capricorn Coast .................................................................... 13
Table 2: Educational attainment – Capricorn Coast ............................................................................................... 15
Table 3: Employed persons by industry – Capricorn Coast ..................................................................................... 17
Table 4: Estimated anthropogenic loads data for key pollutants – Capricorn Coast ............................................... 23
Table 5: Economic and demographic drivers and future risks to EVs...................................................................... 25
Table 6: Gross value of commercial fishing catch (2005)........................................................................................ 28
Table 7: Consumer surplus from recreational fishing in the Capricorn Coast region ............................................... 29
Table 8: Key rural land uses (2009)........................................................................................................................ 30
Table 9: Regional groundcover statistics ............................................................................................................... 31
Table 10: Urban diffuse management – estimated costs and load reductions over the next 10 years...................... 33
Table 11: Indicative wastewater treatment costs (annual $ per tonne of pollutant removed) ................................. 34
Table 12: Demographic summary 2001, 2006, 2011 – Curtis Coast ........................................................................ 37
Table 13: Educational attainment – Curtis Coast ................................................................................................... 40
Table 14: Employed persons by industry – Curtis Coast ......................................................................................... 41
Table 15: Estimated anthropogenic loads data for key pollutants – Curtis Coast .................................................... 49
Table 16: Economic and demographic drivers and potential future risks to EVs ..................................................... 50
Table 17: Gross value of commercial fishing catch (2005) ...................................................................................... 56
Table 18: Consumer surplus from recreational fishing in the Curtis Coast region ................................................... 57
Table 19: Key rural land uses (2009) ...................................................................................................................... 59
Table 20: Regional groundcover statistics ............................................................................................................. 59
Table 21: Urban diffuse management – estimated costs and load reductions over the next 10 years...................... 61
Table 22: Indicative wastewater treatment costs (annual $ per tonne of pollutant removed) ................................. 64
Table 23: Major projects in the Curtis Coast region (established and emerging)..................................................... 66
Table 24: Recommended intervention options ..................................................................................................... 70

LIST OF FIGURES                                                                                                                                        Page

Figure 1: Regional context map .............................................................................................................................. 4
Figure 2: Map of the Capricorn Coast .................................................................................................................... 11
Figure 3: Population projections – Capricorn Coast ............................................................................................... 12
Figure 4: Average weekly gross family income – Capricorn Coast .......................................................................... 14
Figure 5: SEIFA indices – Capricorn Coast, 2011 .................................................................................................... 15
Figure 6: EMC‐related visitations .......................................................................................................................... 18
Figure 7: Operational mines – Capricorn Coast ...................................................................................................... 20
Figure 8: Map of the Curtis Coast .......................................................................................................................... 35
Figure 9: Population projections – Curtis Coast ..................................................................................................... 36
Figure 10: Average weekly gross family income – Curtis Coast .............................................................................. 38
Figure 11: SEIFA indices – Curtis Coast, 2011 ......................................................................................................... 39
Figure 12: Gladstone region visitors for the year ending September 2011 .............................................................. 44
Figure 13: Operational mines – Curtis Coast .......................................................................................................... 45
Figure 14: Throughput at Port of Gladstone .......................................................................................................... 52
Figure 15: Throughput at GBR ports...................................................................................................................... 53
Figure 16: Projected port capacity ........................................................................................................................ 53
Figure 17: DSDIP forecasts of ship calls under different scenarios of trade volumes ............................................... 54
Glossary
ABS        Australian Bureau of Statistics
ATSI       Aboriginal and Torres Strait Islander
BMP        Best Management Practice
BPEM       Best practice environmental management
DAFF       Department of Agriculture, Fisheries and Forestry (Queensland)
DSITIA     Department of Science, Information Technology, Innovation and the
           Arts (Queensland)
EHP        Department of Environment and Heritage Protection (Queensland)
EV         Environmental value
FBA        Fitzroy Basin Association
FTE        Full-time equivalent
GAWB       Gladstone Area Water Board
GBR        Great Barrier Reef
GBRMPA     Great Barrier Reef Marine Park Authority
GRP        Gross regional product
LNG        Liquefied natural gas
NRM        Natural resource management
SEIFA      Socio-Economic Indexes For Areas
TEV        Total economic value
TN         Total nitrogen
TP         Total phosphorus
TSS        Total suspended sediment
WQIP       Water Quality Improvement Plan
WQO        Water Quality Objective
WSUD       Water sensitive urban design
WWTP       Wastewater treatment plant
Key messages
Protecting the environmental values (EVs) of the waters of the Capricorn and Curtis Coasts is
vital to the long-term prosperity of each region. Through a process of robust science and
meaningful consultation, EVs and water quality objectives (WQOs) are being established for
each region.
Consultation undertaken by the Fitzroy Basin Association and previous research has
consistently recognised the importance of maintaining the condition of freshwater and marine
aquatic ecosystems in the Capricorn and Curtis Coast regions. Where the condition of the
aquatic ecosystem declines, key ecosystem functions and services also decline, affecting key
sectors such as tourism, agriculture, fishing and recreation.
There is a strong case for maintaining and enhancing waterway health in the region in
conjunction with facilitating sustainable regional development. The challenge for policy
makers is recognising the trade-offs between regional development and waterway health
and establishing development pathways that genuinely meet both objectives.
Capricorn Coast
For the Capricorn Coast there have been a number of benefits identified from maintaining EVs
including:
aquatic ecosystems, ecosystem function and services—provision of direct use values,
providing jobs and income to the local, regional and national economy, including through
the following channels, for example:
maintaining a regionally significant tourism sector, largely reliant on the condition of
waterway and coastal waters ecosystem health to continue to attract visitors;
providing recreation, boating and other aesthetic benefits to the community;
providing reliable and lower cost inputs to other sectors including agriculture, mining,
construction and water utilities; and
ensuring a sustainable and prosperous fishing sector (recreational and commercial), aquatic
ecosystems, ecosystem function and services—provision of in-direct use values, including
through the following channels, for example:
biological support for marine biodiversity, fisheries, etc., and support for other
ecosystems;
physical protection of coastal ecosystems, shoreline, etc.;
providing non-market or non-use values; for example existence, bequest, option (future
direct and indirect use) and cultural and spiritual values.
Risks to EVs in the Capricorn Coast are relatively lower than in many other parts of the Great
Barrier Reef (GBR) catchments. The economic drivers of risks to EVs in the Capricorn Coast
region include further agricultural development (cattle and irrigated agriculture – low risk),
further urban development (particularly in the narrow coastal zone) and tourism development in
specific areas.
EHP 1.
The economic and social impacts of protecting the
environmental values of the waters of the Capricorn and Curtis coasts
Given the nature of the risks and current regulatory and policy measures to mitigate risks
to EVs, the costs of maintaining EVs in the Capricorn Coast are likely to be manageable,
particularly given the costs will be primarily borne by the entities creating the risks.

Curtis Coast
The Curtis Coast region has a similar scope of benefits – attributable to the maintenance of the
condition of freshwater and marine aquatic ecosystems and the range of human use EVs for the
tidal and non-tidal waters – to the Capricorn Coast region.
The Curtis Coast is arguably the fastest developing region along the GBR coastline, with a
number of world-scale industrial developments triggering significant changes to land use and
potential risks to EVs in the region.
In response to these industrial developments, a number of comprehensive strategies have been
put in place to ensure development is able to proceed while still being broadly consistent with
protecting the EVs through the maintenance of water quality objectives. These initiatives range
from comprehensive whole-of-Reef strategies, to baseline water quality monitoring, through to
project-specific regulatory requirements for major projects. Within the Curtis Coast region, the
costs of these initiatives are primarily borne by the development projects, as part of the
conditions attached to the approval of the developments.
Measures in place appear reasonable given the EVs in the region and the outstanding
universal values of the GBR. Regulatory requirements under development approvals have
been designed to mitigate costs from externalities. While meeting the environmental
conditions of development approvals has imposed costs on developments, there is no evidence
to suggest that the requirements have made any of the projects non-commercial.

EHP                                                                                                2.
The economic and social impacts of protecting the
environmental values of the waters of the Capricorn and Curtis coasts

1. Introduction
The Queensland Department of Environment and Heritage Protection (EHP) commissioned
Marsden Jacob Associates to assess “The economic and social impacts of protecting the
environmental values of the waters of the Capricorn and Curtis Coasts.” A draft of this report
was released for public comment in April 2014 on the EHP website. This is the final report.
A useful definition of environmental values (EVs) is:
...those qualities of the waterway that make it suitable to support particular aquatic
ecosystems and human uses. This can range from aquatic ecosystems and primary
recreation values through to industry and irrigation uses...Environmental values
are essentially community aspirations on what human uses and aquatic ecosystem
functions people expect from their local waters.1
1.1 Terms of reference
The terms of reference for the study are to:
Assess and report the economic and social impacts of protecting the environmental values of the
waters of the Styx, Shoalwater, Waterpark, Curtis Island, Calliope and Boyne drainage basins2
and associated Great Barrier Reef waters in accordance with:
the requirements of section 11 (3) (b) of the Environmental Protection (Water) Policy 2009
(EPP Water 2009), and
the general technical and policy framework of the report The Economic and social impacts
of protecting environmental values in the Great Barrier Reef catchment waters and reef
lagoon, Marsden Jacob Associates, March 2010 (MJA Report).
1.2 Purpose of this study
The purpose of this study was to identify, scope, and, where possible, value the benefits of
achieving water quality objectives (WQOs) in the Capricorn and Curtis Coast regions, which
are comprised of the drainage basins identified in the terms of reference (see Figure 1). These
regions are essentially the coastal basins and associated Great Barrier Reef (GBR) waters that
are east of the much larger Fitzroy Basin. The Capricorn Coast region includes the Styx,
Shoalwater and Waterpark drainage basins and adjacent Queensland coastal waters, while the
Curtis Coast region includes the Calliope, Curtis Island and Boyne drainage basins and adjacent
Queensland coastal waters.
This study was undertaken based on publicly available information and data, and as a desktop
exercise. The consequence of this is that, given quantitative values established regarding EVs
have sometimes used different approaches, they cannot be imported into a formal cost-benefit
1
Fitzroy Basin Association (2014) Draft Community Consultation Report Establishing Environmental Values
and Water Quality Objectives for Capricorn and Curtis Coastal Basins and Coastal Waters, February 2014,
p. 6 and p. 8.
2
Includes the following Australian Drainage Division and River Basins: Styx (127), Shoalwater (128), Waterpark
(129), Curtis Island (131), Calliope (132) and Boyne (133).
EHP 3.
The economic and social impacts of protecting the
environmental values of the waters of the Capricorn and Curtis coastsanalysis. In addition, there are not yet any formal future estimates of loads and the impacts on key environmental assets and functions attributable to those loads. Therefore, a formal cost-benefit analysis has not been undertaken using the information and data in this report. Rather, this report summarises a number of lines of evidence to assist in understanding the economic and social context of waterway health in the region, and the potential benefits and costs associated with managing waterway health. Figure 1: Regional context map Source: EHP, 2014. EHP 4. The economic and social impacts of protecting the environmental values of the waters of the Capricorn and Curtis coasts
1.3 Context
1.3.1 Declining water quality in the waters of the Great Barrier Reef
The GBR is an extraordinary part of Queensland’s natural heritage and a major economic
resource. It supports over 60,000 tourism jobs and is worth around $6 billion to the Queensland
economy annually.3
The scientific evidence of declining water quality within the GBR is well documented and
widely accepted. The following reports have been instrumental in the formation of the
Queensland and Australian Governments’ water quality policy:
the Reef Water Quality Protection Plan, First Report;
the Great Barrier Reef First Report Card, 2009 Baseline;
Reef Water Quality Protection Plan, August 2011, Australian and Queensland
Governments’ publication (at www.reefplan.qld.gov.au); and
the scientific consensus statement prepared for the Queensland Government.
The GBR second report card (April 2013) provides an update on the status of land management
actions throughout GBR catchments and information on the condition of marine water quality,
sea grass and corals.
The key contaminants contributing to declining water quality in reef catchments and coastal
waters are nutrients, toxicants (including pesticides and herbicides) and sediments. These
contaminants are sourced from land-based activities, including from:
rural diffuse source emissions: stormwater run-off containing sediments, nutrients and
toxicants (including pesticides and herbicides) from rural land use activities;
urban diffuse source emissions: contaminated stormwater run-off from regulated urban
land development and its construction and from established urban areas, including
contaminants from roads and nutrients and pesticides from household lawns and urban
parks and gardens; and
point source emissions: primarily wastewater discharges from regulated activities.
1.3.2 Initiatives and programs to address land‐based contaminant emissions
The Queensland Government is committed to the ongoing protection of the GBR through a
range of initiatives and programs to address land-based contaminant emissions, including:
Reef Water Quality Protection Plan 2013. Through the Reef Water Quality Protection
Plan (and supporting water quality improvement plans where prepared), major on-ground
investments have been made to improve the water quality of the reef catchments.
Cane and Grazing Best Management Practices Program. The Queensland Government
is working in partnership with industry to set in place a Best Management Practice (BMP)
program for the cane and grazing industries.
Strategic Assessment. The Queensland Government and the Australian Government’s
Great Barrier Reef Marine Park Authority (GBRMPA) are undertaking a comprehensive
3
Deloitte Access Economics (2013) Economic contribution of the Great Barrier Reef, report prepared for the
Great Barrier Reef Marine Park Authority.
EHP 5.
The economic and social impacts of protecting the
environmental values of the waters of the Capricorn and Curtis coastsstrategic assessment of the GBR World Heritage Area and the adjacent coastal zone. The
strategic assessment includes:
a coastal zone component, led by the Queensland Government, examining the State’s
coastal management, planning and development framework and how it provides
environmental protection along the coastal zone, adjacent to the GBR; and
a marine component, led by GBRMPA, examining the arrangements in place to manage
and protect the GBR Marine Park and World Heritage Area.
The GBR Strategic Assessment was released for public consultation, with submissions
having closed on 31 January 2014. Further information on the strategic assessment is
available from http://www.dsdip.qld.gov.au/gbr-strategic-assessment/.
Gladstone Healthy Harbour Partnership. A forum to bring together parties (including
community, industry, science, government, statutory bodies and management) to maintain
and, where necessary, improve the health of Gladstone Harbour. The guiding principles of
the Partnership are open, honest and accountable management, annual reporting of the
health of the Gladstone Harbour and management recommendations and action based on
rigorous science and strong stakeholder engagement to ensure the ongoing and continuous
improvement in the health of Gladstone Harbour.
Further details on Queensland Government actions pertaining to reef protection are provided on
the Reef Facts website at http://www.reeffacts.qld.gov.au/ .
Additionally, the Single State Planning Policy (finalised in December 2013) provides a range
of state interests under the Sustainable Planning Act 2009. State interests include water quality,
wherein urban land development and its construction are planned, designed, constructed and
operated to protect environmental values and support the achievement of water quality
objectives under the Environmental Protection (Water) Policy 2009.4
At the Commonwealth level, another relevant policy is $400 million voluntary Reef Rescue
program. Under this program, the Commonwealth has provided grants to fund on-farm activities
by landholders that improve the quality of water entering the GBR lagoon.5
1.3.3 Regional context: Establishing local environmental values and water quality
objectives in the Fitzroy and Capricorn‐Curtis Coast areas
With a view to improving the resilience of the GBR by advancing local (and reef) water quality
protection, EHP has developed local-scale EVs, WQOs and aquatic ecosystems mapping for
key reef catchments and associated coastal waters.
EVs and WQOs for the Fitzroy Basin (adjacent to the current project area) were the subject of a
separate EVs process and were finalised in September 2011. Documents and plans are available
on the EHP website. Reference to Figure 1 shows that the Fitzroy Basin is substantially larger
than the Capricorn and Curtis Coast project area. (The Fitzroy Basin is approximately
143,000km2 in area whereas the current project area, comprising six river basins, is about
4
Environmental values for tidal and non-tidal waters include aquatic ecosystems and human uses (e.g.
agriculture, human consumption of aquatic foods, industry, recreation and aesthetics, drinking water and
cultural and spiritual values). Water quality objectives are long-term objectives for receiving waters (e.g. pH,
suspended solids) that protect the environmental values. They are not end-of-pipe emission standards.
5
See http://www.nrm.gov.au/funding/reef-rescue/
EHP 6.
The economic and social impacts of protecting the
environmental values of the waters of the Capricorn and Curtis coasts13,800 km2 in area.) Information on land-sourced sediment and nutrient loads in this report also
identifies that the bulk of the loads is from the Fitzroy Basin.
Draft EVs and WQOs for the Capricorn and Curtis Coasts Regions were published at EHP’s
website for public comment from April to June 2014. A draft of this report and a report on
consultation activities were also released for public comment6. Final EVs and WQOs are listed
on the EHP website (www.ehp.qld.gov.au ), and inform local-scale natural resource
management and land development planning and decision-making.
Locally derived EVs, WQOs and associated spatial mapping for reef catchments and coastal
waters inform:
planning and decision making for new developments involving wastewater discharges to
receiving waters (e.g. for point source environmentally relevant activities) under the
Environmental Protection Act 1994;
Local Government planning and decision making for urban land development under the
Single State Planning Policy (Water Quality State Interest) (Sustainable Planning Act
2009)—at the scale of local land development;
BMP approaches for cane and grazing activities to address diffuse emissions from rural
lands—at property / paddock scale;
the local scale natural resource management planning and decision-making by community-
based regional natural resource management (NRM) bodies – the Fitzroy Basin Association
(FBA) for the Capricorn and Curtis Coast regions; and
the development of water resource plans under the Water Act 2000.
These actions address sources of contaminant emissions, advancing reef catchments and GBR
coastal water quality and improving resilience.
1.3.4 Water quality objectives and the Four Pillars underpinning Queensland’s
economic development
The WQOs for Queensland waters are set within the context of the Queensland Government’s
State development priorities, the Four Pillars. In 2012, the State Government established an
economic development strategy for Queensland based around the following Four Pillars for
economic growth.
Agriculture
Queensland’s agricultural exports were valued at $8.9 billion, 16% of the state’s commodity
exports by value, in 2012-13.7 Queensland’s agriculture strategy sets the goal to double the
value of Queensland’s agricultural production by 2040. The four key pathways to achieving this
goal include:
increasing resource availability (e.g. water for irrigation);
driving productivity growth through innovation and bio-security;
6
Fitzroy Basin Association (2014) Draft Community Consultation Report Establishing Environmental Values
and Water Quality Objectives for Capricorn and Curtis Coastal Basins and Coastal Waters, February 2014, and
Queensland Government (2014) Aquatic ecosystem water quality guidelines: Capricorn-Curtis Coast region.
7
Queensland Government Department of Agriculture, Fisheries and Forestry (2013) Queensland’s Agriculture
Strategy: A 2040 vision to double agriculture production, June 2013.
EHP 7.
The economic and social impacts of protecting the
environmental values of the waters of the Capricorn and Curtis coasts focusing on access to key growth markets; and
enhancing production and supply chain inputs to lower the costs of production.8
The quality of the State’s land and water resources is critical to sustainable cropping,
aquaculture and fishing.
Resources
Coal, petroleum and minerals currently comprise in excess of 60% of Queensland’s exports by
value.9 The resources sector underpins a significant share of the Queensland economy, with
direct spending of around $36 billion in 2011-12, 64,300 residing full-time equivalent (FTE)
employees and with $8 billion of associated salaries.10 Further there is a large expected benefit
from the anticipated commencement of LNG production and export from terminals at Curtis
Island off Gladstone in the next few years. LNG exports are expected to boost exports in
2015-16 to a growth rate of 23¼% and are forecast to boost gross state product (GSP) growth in
the same year to 6%.11
The Government’s objective is to grow the resources industry through higher levels of
productivity and innovation. The continuing sustainable management and development of
current and future activities is necessary to protect Queensland’s water environment.
Construction
Construction is also a key activity underpinning economic growth, with the construction
industry directly accounting for around 10% of the State workforce. Within the study region,
construction is particularly important in the Gladstone region, with a large construction
workforce on Curtis Island building the LNG production and export facilities, which are all
being constructed by Bechtel. Bechtel’s workforce for the Curtis Island projects is, as at
November 2013, around 10,550 and is expected to peak in 2014 at around 11,000.12 The
estimated construction value of the three LNG plants is around $62 billion.13
The State is focussing on growth in the broader construction sector through a number of
planning initiatives (e.g. changes in planning regulation to expedite planning processes) through
to targeting grants for first time home owners who build a new home. The State interest in water
quality is achieved by land development and construction that is planned, designed, constructed
and operated to protect EVs of Queensland waters and support the achievement of water quality
objectives.
8
Queensland Government (2012) Queensland Agricultural Strategy: a 2040 vision to double the value of
production – discussion paper.
9
Government Statistician, Queensland Treasury and Trade (2012) Exports from Queensland and Australia to all
countries, by commodity, value, 2011-12 and Department of Transport and Main Roads (2013) Trade Statistics
for Queensland Ports for the five years ending 30 June 2012.
10
Lawrence Consulting (2012) Economic Impact of the Resources Sector on the Queensland Economy 2011/12,
prepared for Queensland Resources Council, p. iv.
11
Queensland Government (2013) Budget Strategy and Outlook 2013-14, p. 31.
12
Kevin Berg, GM Gladstone, Bechtel, presentation to Energy Skills Queensland conference, 4 November 2013.
13
Bureau of Resources and Energy Economics (2013) Resources and Energy Major Projects, p. 16.
EHP 8.
The economic and social impacts of protecting the
environmental values of the waters of the Capricorn and Curtis coastsTourism
The Queensland Government recognises tourism as one of the four pillars of our economy and
has a growth target for the tourism sector to reach $30 billion in overnight visitor expenditure
by 2020.14 , 15. Destination success: the 20 year plan for Queensland tourism outlines the
direction for tourism in Queensland (refer http://www.destq.com.au/20-year-plan ). The main
goal of Destination success is to make Queensland the number one tourist destination in
Australia, with a medium-term goal of achieving the national Tourism 2020 target (i.e. doubling
2010 visitor expenditure to $30 billion by 2020).
Destination success contains six themes to direct efforts. The 2nd theme - Preserve our nature
and culture - recognises the strong links between natural assets (including rivers, the Great
Barrier reef, beaches, etc.) and tourism, stating ‘To be competitive and successful over the next
20 years, we will preserve our nature and culture: Natural assets will continue to be the heart
of the Queensland experience—able to be enjoyed by visitors and locals alike, and preserved for
future generations…’. Water quality of rivers, streams, wetlands and coastal waters underpins
the tourism sector and outdoor recreation opportunities for all residents and visitors.
The Queensland Ecotourism Plan (2013–2020) has been prepared by the Queensland
Government in recognition of the key role played by the environment in ecotourism
experiences. (State of Queensland, 2013, Queensland Parks and Wildlife Service, available at
http://www.nprsr.qld.gov.au/tourism/pdf/final-ecotourism-plan-2013.pdf).
The process to identify EVs and WQOs is consistent with the drivers and directions established
in the plan, including:
Recent international visitor research reveals Australia’s biggest strength is its ‘world class
beauty’ and natural environments, rated number one by visitor markets.
Interest in nature is high amongst actual visitors to Australia, with 62% of international
visitors engaging in nature-based activities.
The strong interest of visitors in nature-based activities highlights the value of ecotourism to
the Queensland economy. With nature-based activities across Queensland, ecotourism is an
important driver of regional dispersal and contributor to regional economies.
Successful ecotourism relies on the maintaining the natural values that are the basis for
ecotourism: ‘It is the quality of Queensland’s unique natural environment with its rich
biodiversity and wildlife that is the foundation of the state’s tourism competitive advantage.
Visitors’ experiences are enriched by the outstanding natural and cultural values they
encounter. Recognition of this advantage is the first step in making Queensland a world
leader in ecotourism by 2020. Through best practice ecotourism, Queensland can deliver
world-class experiences that retain the inherent natural values upon which the tourism
industry depends and contribute to the sustainability of the natural areas as well as socially
and economically to local communities.’
14
See http://www.business.qld.gov.au/industry/tourism/tourism-in-queensland/queenslands-tourism-
industry/tourism-2020-strategy
15
Tourism and Events Queensland (2013) Tourism and Events Queensland Strategic Plan 2013-17.
EHP 9.
The economic and social impacts of protecting the
environmental values of the waters of the Capricorn and Curtis coastsThe need to conserve the natural values on which ecotourism is based is also reflected in the vision of the Queensland Ecotourism Plan, to be achieved by 2020: ‘Queensland is Australia’s number one ecotourism destination and recognised as a world leader in ecotourism, delivering best practice nature-based experiences that contribute to the conservation of our natural resources and cultural heritage….Underpinning the plan is acknowledgement that world-leading ecotourism is wholly dependent upon the conservation of Queensland’s rich biodiversity and environmental and cultural resources. The plan demonstrates the commitment the Queensland Government, tourism industry and the community is making to balance preservation with presentation by providing best practice ecotourism.’ EHP 10. The economic and social impacts of protecting the environmental values of the waters of the Capricorn and Curtis coasts
2. Capricorn Coast
  2.1 Introduction
This chapter considers the economic and social impacts of protecting the EVs of the tidal and
non-tidal waters of the Capricorn Coast (see Figure 2). The Capricorn Coast comprises the Styx
(area: 3020km2), Shoalwater (3607 km2), and Waterpark (1838 km2) basins (combined area:
8464km2), and GBR waters. The Capricorn Coast is to the east and north of Rockhampton, and
includes only a small number of urban centres and localities, such as Yeppoon, Kinka Beach
and Emu Park.
Figure 2: Map of the Capricorn Coast

Source: MJA, 2013.

In accordance with the Environmental Protection (Water) Policy 2009 EVs are protected by
achieving or maintaining the water quality objectives, through the management measures and
control actions applicable to the rural and urban diffuse and point source emissions of nutrients,
sediment and toxicants from activities and land uses in the basins.

EHP                                                                                             11.
The economic and social impacts of protecting the
environmental values of the waters of the Capricorn and Curtis coasts
2.2 Socio‐economic profile – Capricorn Coast
Demographic, social and economic data and information have been used to develop the
Capricorn Coast regional socio-economic profile.
2.2.1 Demographic profile
Population and population growth
From the 2011 Census, it is estimated that the population of the Capricorn Coast region is
around 24,331 people. Figure 1 shows the recent historical and forecast population growth for
the Capricorn Coast region compared with all GBR regions assessed in the 2010 Marsden Jacob
report. It indicates that:
significant population growth is expected in the Capricorn Coast region and across the GBR
regions over the next 20 years; and
the Capricorn Coast rate of population growth is likely to be higher than for the GBR as a
whole.
Figure 3: Population projections – Capricorn Coast
190%
% of 2011
180%
170% Capricorn
160% Coast
150% GBR
140%
130%
120%
110%
100%
90%
2011 2016 2021 2026 2031
Source: OESR and Marsden Jacob, 2014.
Other population and demographic statistics (Table 1) are noted below:
unlike much of the GBR, the population of the Capricorn Coast region is slightly skewed to
females (50.8% of the population), which may be related to men pursuing opportunities in
the resources sector outside of the region;
in the 2011 census, 3% of respondents identified themselves as being Aboriginal and Torres
Strait Islander (ATSI) in the Capricorn Coast region compared with around 3.6% for the
whole of Queensland; and
approximately 12.2% of people in the Capricorn Coast region were not born in Australia
and around 2.7% of the population speak a language other than English at home.
EHP 12.
The economic and social impacts of protecting the
environmental values of the waters of the Capricorn and Curtis coastsTable 1: Demographic summary 2001, 2006, 2011 – Capricorn Coast
2001 2006 2011
Total population 20,049 21,901 24,331
Percentage of males 50.1 49.7 49.2
Percentage of females 49.9 50.3 50.8
Percentage of ATSI descent 2.8 3.0 3.0
Percentage of people not born in Australia 10.7 11.1 12.2
Percentage of people who speak a language other 2.5 2.5 2.7
than English at home
Source: OESR and Marsden Jacob, 2013.
Note: data are based on place of enumeration.
Community capacity
A community’s capacity to participate in NRM is often indicated by a number of issues, briefly
outlined below.
Approximately 20% of adults (>15 years old) participate in voluntary work compared with a
State average of 18%, potentially indicating reasonable levels of social capital. Females had
higher levels of participation in volunteer work at 22%, compared to males (at 17%). However,
the ABS census data do not indicate what type of volunteer work (e.g. environmental
management) was undertaken.
The relative financial impact of any projects or policies that broadly impact on costs must be
considered as the burden may be relatively greater for lower-income families. The Capricorn
has a slightly higher incidence of low-income families than the State as a whole.
Approximately 16% of families in the Capricorn Coast area were on low incomes in 2011
(i.e.Figure 4: Average weekly gross family income – Capricorn Coast
$2,000
2011 dollars
$1,500
$1,000 Capricorn Coast
Qld
$500
$0
2006 2011
Source: Marsden Jacob based on ABS 2006 and 2011 Census data and CPI data.
Household ownership (owned or being purchased) is sometimes used as a proxy for economic
capacity. In the Capricorn, approximately 63% of homes are owned or are being purchased.
This is similar to a State average of 61%.
The ABS Socio-Economic Indexes for Areas (SEIFA) is a suite of composite indices of a
community’s capacity and socio-economic wellbeing. These indices are prepared using census
data and provide a broad means to make relative comparisons of social and economic resources
between regions. The three indices of most relevance are: 16
the Index of Advantage–Disadvantage, which is a continuum of values, where low values
indicate areas of disadvantage and high values indicate areas of advantage;
the Index of Economic Resources, which includes variables that are associated with
economic resources. Variables include rent paid, income by family type, mortgage
payments, and rental properties; and
the Index of Education and Occupation, which includes all education and occupation
variables only.
These indices were estimated for the Capricorn Coast based on a weighted average of SEIFA
indices for SA1 areas within the region. Results including a comparison with Queensland as a
whole are shown in Figure 5.
16
ABS (2001) Information Paper: Census of Population and Housing — Socio-Economic Indexes for Areas, cat.
no. 2039.0,
EHP 14.
The economic and social impacts of protecting the
environmental values of the waters of the Capricorn and Curtis coastsFigure 5: SEIFA indices – Capricorn Coast, 2011
Relative socio‐economic
advantage & disadvantage
Realitve socio‐economic
disadvantage
Economic resources
Education and Occupation
Index
920 940 960 980 1000 1020
Capricorn Coast Qld
Source: Marsden Jacob based on ABS 2011 census SEIFA indices.
Analysis of the data indicates:
compared with the State average, the Capricorn is at a relative disadvantage;
economic resources in the Capricorn are around the average of the State as a whole; and
the Index of Education and Occupation shows that the Capricorn is lower than the State as a
whole, which may indicate lower resilience to change.
Education levels in the Capricorn are lower than the State as a whole (Table 2), with lower
proportions of people having completed year 12 and having diploma, undergraduate or
postgraduate qualifications than the State average.
Table 2: Educational attainment – Capricorn Coast
Highest education level Capricorn Coast QLD
completed (% of 15+ population) (% of 15+ population)
Schooling
Year 10 38.4% 31.9%
Year 12 36.8% 47.8%
Post‐school
Certificate 22.1% 20.6%
Diploma 6.5% 7.9%
Undergraduate degree 9.0% 12.2%
Postgraduate degree 3.2% 4.3%
Source: ABS 2011 Census of Population and Housing.
EHP 15.
The economic and social impacts of protecting the
environmental values of the waters of the Capricorn and Curtis coastsEmployment and labour force
Labour force statistics in Table 3 show a reasonable degree of diversity in the Capricorn Coast
economy.
Employment in primary industries is slightly lower than the GBR average (10.6% compared
with 11.6%), but is twice the state average (10.6% with 5.3%).
Manufacturing employment is slightly lower in the region than for the rest of the GBR
(6.0% versus 8.9% of employment).
Employment in the construction and accommodation and food service industries are
significantly higher than the GBR and State averages.
Collectively mining, manufacturing and construction employ around 23% of the workforce.
Mining has become a key industry in the region, employing around 7% of the workforce.
Health care and social assistance are around the same proportion of employed persons as the
GBR average, but the share in education and training is substantially higher (9.9% versus
7.5% for the GBR and 8.1% for Queensland).
There were a number of important trends occurring between the 2006 and 2011 Censuses:
Employment in the mining sector has more than doubled over the five years, from 307
people (3.6% of employed persons) to 704 (7.1% of employed persons). Given the data on
are on a place of enumeration basis, a number of these workers are likely to be fly-in, fly-
out (FIFO) or drive-in, drive-out (DIDO) workers.
Agriculture continued its downward trend in employment from 399 people (4.7% of
employed persons) to 344 people (3.5% of employed persons).
While health care and social assistance experience slight growth in employment from 824 to
1,057 employed persons (from 9.7 to 10.7% of employed persons), numbers employed in
education and training were more-or-less stable, only slightly declining in absolute terms
from 998 to 984. This, however, meant a relative decline in education and training from
11.7% to 9.9% of the workforce.
EHP 16.
The economic and social impacts of protecting the
environmental values of the waters of the Capricorn and Curtis coastsTable 3: Employed persons by industry – Capricorn Coast
Employed persons Percentage
Industry 2006 2011 Change 2006 2011 Change
Agriculture, forestry and fishing 399 344 ‐55 4.7 3.5 ‐1.2
Mining 307 704 397 3.6 7.1 3.5
Manufacturing 567 593 26 6.7 6.0 ‐0.7
Electricity, gas, water and waste services 130 153 23 1.5 1.5 0.0
Construction 910 1,019 109 10.7 10.3 ‐0.4
Wholesale trade 193 270 77 2.3 2.7 0.4
Retail trade 908 1,087 179 10.7 11.0 0.3
Accommodation and food services 823 900 77 9.7 9.1 ‐0.6
Transport, postal and warehousing 276 382 106 3.2 3.9 0.7
Information media and telecommunications 68 93 25 0.8 0.9 0.1
Financial and insurance services 159 191 32 1.9 1.9 0.0
Rental, hiring and real estate services 227 205 ‐22 2.7 2.1 ‐0.6
Professional, scientific and technical services 329 359 30 3.9 3.6 ‐0.3
Administrative and support services 165 217 52 1.9 2.2 0.3
Public administration and safety 603 729 126 7.1 7.4 0.3
Education and training 998 984 ‐14 11.7 9.9 ‐1.8
Health care and social assistance 824 1,057 233 9.7 10.7 1.0
Arts and recreation services 81 90 9 1.0 0.9 ‐0.1
Other services 318 342 24 3.7 3.5 ‐0.2
Not stated 223 192 ‐31 2.6 1.9 ‐0.7
Total 8,508 9,911 1,403 100.0 100.0 0.0
Source: ABS 2011 Census of Population and Housing.
Note: Based on place of enumeration.
2.2.2 Summary of socio‐economic profile
The socio-economic profile presented above shows the Capricorn Coast region’s slightly lower
social and economic wellbeing than the State average. However, the economy of the Capricorn
Coast appears more diverse than some other GBR regions, which would tend to mitigate any
economic impacts that may occur as a result of measures to protect EVs.
EHP 17.
The economic and social impacts of protecting the
environmental values of the waters of the Capricorn and Curtis coasts2.2.3 Industry profile
Tourism
Tourism in the region is much lower than in other regions along the GBR, based on visitations
data collected as an administrative by-product of Environmental Management Charge (EMC)
data collected by the GBRMPA (see Figure 6).17 EMC data are collected where people are
customers of a commercial operator using the GBR. However, tourism is very significant to the
Capricornia Coast region from Yeppoon to Emu Park at the southern end of the region and also
to Great Keppel Island. The Capricorn Coast region is part of the broader Fitzroy NRM region
in which tourism made an estimated contribution of $478 million in 2011-12.18
Figure 6: EMC‐related visitations
1,200,000
1,000,000
800,000
Mackay‐Capricorn
600,000
Townsville‐Whitsundays
400,000
Cairns‐Cooktown
200,000
0
1994
1995
1996
1997
1998
1999
2000
2001
2002
2003
2004
2005
2006
2007
2008
2009
2010
2011
2012
Source: GBRMPA website, 2013.
Substantial new tourism opportunities have been approved for Great Keppel Island as part of an
integrated report development. It includes a hotel, apartments, marina and golf course.
Estimated economic benefits identified in the Queensland Coordinator General’s review of the
proposal included:
post-construction, an average of 1055 full-time, part-time and casual jobs on the island and
in the Capricorn Region—comprising 685 persons on the island and 370 on the mainland in
the surrounding regions (predominantly in Rockhampton and Yeppoon.
increased economic activity due to an increase in the estimated average daily population on
the island to 2274 visitors, residents and employees, which is approximately three times that
of the previous peak in the early 1990s.
once fully operational, total consumption expenditure on the island is expected to be around
$83 million each year, having significant flow-on effects to the local and regional economy.
17
Note these data are only where there is a trip to the GBR which is subject to the EMC. There are a large number
of other visits to the region which are not recorded in the EMC data set because they do not involve a trip to the
GBR.
18
Deloitte Access Economics (2013) Economic Contribution of the Great Barrier Reef, p. 15.
EHP 18.
The economic and social impacts of protecting the
environmental values of the waters of the Capricorn and Curtis coasts once fully operational, a projected annual increase in gross regional product (GRP) of the
Fitzroy Region of $75.2 million arising from estimated annual expenditure of $83 million
on the island. This is comprised of a direct increase of $41.7 million, an indirect increase of
$16.6 million and an induced increase of $16.9 million.
(State of Queensland (2013) http://www.dsdip.qld.gov.au/resources/project/great-keppel-island-
resort/gki-cg-report-eis.pdf )
A current proposal exists to expand the Iwasaki Capricorn Integrated Resort (north of Yeppoon)
in a 20 year staged, master-planned development comprising conservation, rural and urban
precincts. The initial advice statement for the report development estimates that it would
comprise approximately 8,000 dwellings in the residential community at capacity, equating
to a residential population of approximately 21,000 people.
Create between 18,500 and 19,000 construction jobs over the lifetime of the Project
(comprising between 8,000 and 8,500 on site jobs and between 10,000 and 10,500 off site
jobs).
Provide approximately 2,160 on-going permanent tourism/education jobs.
(Iwasaki Capricorn Integrated Resort Project Initial Advice Statement, 2013; available from
http://www.dsdip.qld.gov.au/resources/project/capricorn-integrated-resort/cir-ias-overview.pdf
Both these proposals occur within the broader context of the Queensland Ecotourism Plan
(2013–2020) prepared by the Queensland Government in recognition of the key role played by
the environment in ecotourism experiences. (State of Queensland, 2013, Queensland Parks and
Wildlife Service, available at http://www.nprsr.qld.gov.au/tourism/pdf/final-ecotourism-plan-
2013.pdf).
The vision of the plan is that by 2020 ‘Queensland is Australia’s number one ecotourism
destination and recognised as a world leader in ecotourism, delivering best practice nature-
based experiences that contribute to the conservation of our natural resources and cultural
heritage….Underpinning the plan is acknowledgement that world-leading ecotourism is wholly
dependent upon the conservation of Queensland’s rich biodiversity and environmental and
cultural resources’.
Agriculture
Employing around 3.5% of the workforce, agriculture is slightly more significant in the region
than in the State as the whole (at 2.7%) and the broader Rockhampton region (at 2.3%). Within
the region, beef grazing is the major agricultural activity, and the predominant one in Styx River
and Shoalwater Creek catchments. In the Waterpark Creek catchment, cattle grazing was
undertaken on around 51% of holdings, and horticulture was much more significant than in the
other parts of the Capricorn Coast region.19
19
ABS (2010) Land Management Practices in the Great Barrier Reef Catchments, Preliminary, 2008-09, cat. no.
4619.0.
EHP 19.
The economic and social impacts of protecting the
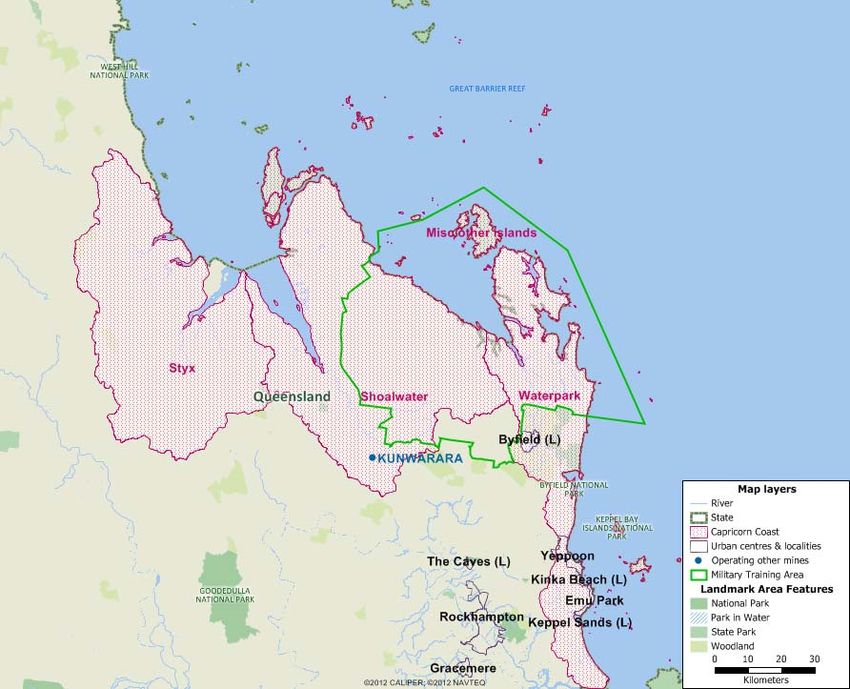
environmental values of the waters of the Capricorn and Curtis coastsMining
The Capricorn Coast basin does not contain a large mining industry, with only one operating
mine, the Kunwarara magnesia mine in the southern part of the Shoalwater region (Figure 7).
Figure 7: Operational mines – Capricorn Coast
Source: MJA, 2013.
Defence
The area is home to the Shoalwater Bay Military Training Area, which covers 454,500 hectares,
and is managed by the Commonwealth Department of Defence. The region has significant
environmental value, particularly due to its wetlands of international importance (Ramsar
wetlands) and its biodiversity, including vulnerable or rare plant or animal species.20
The Training Area poses environmental risks, particularly through the use of live ammunition,
including in major national and multi-lateral simulated combat exercises such as Talisman
Sabre. Because of the risks involved and the environmental and heritage values of the area, the
Department of Defence maintains strict environmental management of the area, including
appropriate rehabilitation and comprehensive water quality monitoring.21 The Department has
advised that water quality generally meets the water quality objectives and there are major parts
of the basin with intact high aquatic ecosystem values.
20
Department of Environment and Heritage (2006) Shoalwater Bay Military Training Area, Statement of
Significance.
21
Department of Defence (2009) State of the Environment Report for Shoalwater Bay Training.
EHP 20.
The economic and social impacts of protecting the
environmental values of the waters of the Capricorn and Curtis coasts2.3 Water quality in the Capricorn Coast
EVs are the attributes of the water asset that support aquatic ecosystems and the multitude of
direct and indirect human uses. Final EVs for tidal and non-tidal waters of the Capricorn Coast
are on the EHP website (www.whp.qld.gov.au ). These are derived from the draft EVs
established by FBA in conjunction with key local stakeholder organisations and the community,
released for public comment in April 2014 22. While there is some sub-regional variation, the
identified EVs are:
Aquatic ecosystems. Apparent across all freshwater (surface and groundwater),
estuaries/bays and marine coastal waters where relevant. These values are negatively
impacted by a number of land use activities across all sectors.
Agricultural use. Water used for irrigation and stock and domestic use where relevant. The
quality of water used by agriculture can have a marked impact on productivity. Grazing
BMP modules are being developed by the Queensland Government Department of
Agriculture, Fisheries and Forestry (DAFF), with the FBA and grazing industry leading the
process. BMP is informed by the EVs and water quality objectives for the waters of the
Capricorn Coast.
Fishing. Commercial fishing is undertaken in the region, particularly in the marine and
coastal zone. Water quality and waterway health have a significant impact on fish
population dynamics, fish health, catch rates, and the quality of fish caught.
Recreation. Both primary recreation (e.g. swimming, snorkeling) and secondary recreation
(e.g. waterskiing, fishing) are relevant across all sub-regions. This is also a vital attribute
underpinning tourism activity and can be impacted by changes in water quality.23
Visual appreciation and aesthetics. Visual appreciation and aesthetics are key values in
the region. These values can enhance values of adjacent land uses (e.g. residential, tourism)
and any decline in aesthetics is often reflected in land values. This use is non-consumptive.
Drinking water. Declines in water quality increase the cost of supplying potable water
through higher treatment costs, and potentially the need to augment treatment standards
where water pollutant thresholds are regularly exceeded. The majority of the drinking water
consumed in the region is provided by Fitzroy River Water (FRW) – a commercial business
unit of Rockhampton Regional Council responsible for delivering water supply and
sewerage services.24
Industry. Mining and construction are important industries underpinning the regional
economy. The State interest in water quality is achieved by land development and
construction that is planned, designed, constructed and operated to protect the EVs through
the achievement of water quality objectives.
Cultural and spiritual use. There is also significant evidence of cultural and spiritual
values attached to waterways by Traditional Owners, while some waterways also have a
22
Fitzroy Basin Association (2014) Draft Community Consultation Report Establishing Environmental Values
and Water Quality Objectives for Capricorn and Curtis Coastal Basins and Coastal Waters, February 2014.
23
Prayaga, P (2011) Estimating changes in values for recreation in the Capricorn Coast region of the Great
Barrier Reef, Doctor of Philosophy thesis, Central Queensland University, Rockhampton.
24
Rockhampton Regional Council (2013) Corporate Plan 2012-17.
EHP 21.
The economic and social impacts of protecting the
environmental values of the waters of the Capricorn and Curtis coastsYou can also read