The Economic Contribution and Financing of Racecourses in Ireland 2017
←
→
Page content transcription
If your browser does not render page correctly, please read the page content below
The Economic Contribution and Financing of Racecourses in Ireland 2017
The Economic Contribution and Financing of Racecourses in Ireland 2017

Cover Page: Killarney Racecourse August 2017, Healy Racing Photographers
The Economic Contribution and Financing of Racecourses in Ireland 2017

CONTENTS                                                                                                                                                                       PAGE
1.     EXECUTIVE SUMMARY ........................................................................................................................................ 2

2.     TERMS OF REFERENCE AND METHODOLOGY ...................................................................................................... 6

     2.1.        BACKGROUND..................................................................................................................................................... 6

     2.2.        METHODOLOGY .................................................................................................................................................. 6

     2.3.        SCOPE OF THE REVIEW.......................................................................................................................................... 7

     2.4.        STRUCTURE OF THE REVIEW................................................................................................................................... 7

3.     ECONOMIC CONTRIBUTION OF RACECOURSES ................................................................................................... 8

     3.1.        OVERVIEW ......................................................................................................................................................... 8

     3.2.        SERVICES PROVIDED AT RACECOURSES ................................................................................................................... 18

     3.3.        ECONOMIC INPUTS AND OUTPUTS RELATING TO RACECOURSES .................................................................................. 19

     3.4.        IMPACT ON LOCAL ECONOMIES: TOURISM .............................................................................................................. 21

     3.5.        EMPLOYMENT BY RACECOURSES .......................................................................................................................... 22

     3.6.        EMPLOYMENT IN THE OVERALL HORSERACING INDUSTRY ......................................................................................... 23

     3.7.        HORSERACING INDUSTRY EMPLOYMENT BY OCCUPATIONAL GROUP .......................................................................... 23

     3.8.        IMPACT ON HORSE BREEDING SECTOR .................................................................................................................. 25

     3.9.        PRIZE MONEY AND SPONSORSHIP ........................................................................................................................ 26

     3.10.       QUALITATIVE DATA FROM QUESTIONNAIRES.......................................................................................................... 27

     3.11.       CURRENT AND FUTURE ISSUES QUALITATIVE RESPONSES .......................................................................................... 33

4.     FINANCIAL REVIEW OF RACECOURSES ...............................................................................................................36

     4.1.        OVERVIEW OF RACECOURSE FINANCING ................................................................................................................ 36

     4.2.        ATTENDANCES .................................................................................................................................................. 37

     4.3.        PROFITABILITY OF RACECOURSES .......................................................................................................................... 43

     4.4.        PUBLIC INFORMATION FILED WITH THE COMPANIES REGISTRATION OFFICE ................................................................. 44

     4.5.        RATIO ANALYSIS................................................................................................................................................ 47

     4.6.        CAPITAL EXPENDITURE - PAST AND FUTURE ........................................................................................................... 48

     4.7.        CASH FLOW IMPLICATIONS AND FUNDING FUTURE CAPITAL EXPENDITURE .................................................................. 49

     4.8.        TAXES AND CHARGES ......................................................................................................................................... 51

     4.9.        LAND AND BUILDINGS ........................................................................................................................................ 52

     4.10.       THE COST OF STAGING FIXTURES .......................................................................................................................... 52

APPENDIX 1              LIST OF RACECOURSES ....................................................................................................................54

      Petrus Consulting                                                                                                                                                            1
The Economic Contribution and Financing of Racecourses in Ireland 2017 1. EXECUTIVE SUMMARY The core Breeding and Racing industry is estimated to generate €1.05 billion gross expenditure, which results in economic input of €914m into the Irish economy and core employment is estimated at 21,2001. Racecourses are the critical element for horseracing to take place – without the well-developed network of 26 racecourses located in nineteen different counties on the island, which are capable of hosting both National Hunt and flat race meetings, horseracing in Ireland simply would not happen and the related economic activities such as training, horse breeding and betting would either not be possible or would be seriously curtailed. In this sense, racecourses may be seen as the underlying ‘network infrastructure’ over which the spectacle of horseracing, with all its ancillary add-on activities, is provided to the public. Key Indicators. In recent years, previous declines in several key indicators for the overall horseracing industry have been reversed and improvements have taken place in a number of areas. However, long term issues remain – total attendances have increased in recent years but are still well below the level seen at the peak and average attendance is weak. There has been a small increase in the number of fixtures and races held and industry funding has increased along with prize money. More betting activity is subject to tax but on course bookmakers are under severe pressure. The number of horse owners and horses in training have each shown steep declines which is a cause for concern for the future of horseracing. Economic Contribution. Racecourses are only one part of the overall horseracing and breeding industry but, if it is accepted that racecourses are an essential precursor to all the related activities, then the racecourse activity is critically important and has a very high multiplier effect for all the other related activities in the wider horseracing industry. The 2017 Deloitte report on the Economic Impact of Irish Breeding and Racing estimated that the core breeding and racing industry generated €1.05 billion gross expenditure and, when secondary effects are included, that total economy wide expenditure amounted to €1.84 billion. Tourism. Recent information on the relationship between horseracing and tourism is lacking. However, from earlier work in this area, it is clear that racecourses play an important part in Ireland’s tourism industry, with a number of racing festivals coinciding with peak holiday times within the country. As a result, racing festivals held at Irish racecourses have an important role to play in the development of tourism within the country by attracting attendance at race meetings from domestic sources and from overseas. A research study commissioned for HRI in 20092 estimated the annual expenditure in the economy by overseas visitors who attend race meetings in Ireland came to just over €67 million. This study estimated that the number of overseas visitors attending race meetings in the period June 2008 to May 2009 came to 68,405 who, between them spent an average of €980 per visit, yielding a total spend over the period of €67,036,900.The same study found that overseas visitors made up 9% of all attendees at race meetings in Ireland. Employment. - Wages and salaries for full time, part time and casual racing staff amount to just over €12 million annually. It is estimated that there are approximately 407 full time equivalent (FTE) jobs supported by racecourses directly and employment has increased slightly over the 4 year period 2013 – 2016. The figure of 407 FTEs is made up of 225 full time staff, 60 part time FTEs and 120 casual FTEs. Average cost per full time equivalent employee has increased by 18% in the period. On-course and off-course activities in areas such as training, breeding, catering, betting, regulation and transport, all have high employment content and are supported or enabled by the existence of racecourses. Core and directly attributable employment is estimated at 21,200 in 2016 in horseracing, breeding, betting and directly attributable activities. Each job on the racecourse supports over 50 jobs off the racecourse and each racecourse supports over 800 jobs across the core breeding and racing sectors. 1 Economic Impact of Irish Breeding and Racing 2017, Deloitte for Horse Racing Ireland 2 Overseas Visitors Quantitative Research 2008/09 Prepared August 2009 by Behaviour & Attitudes for Horse Racing Ireland. Petrus Consulting 2
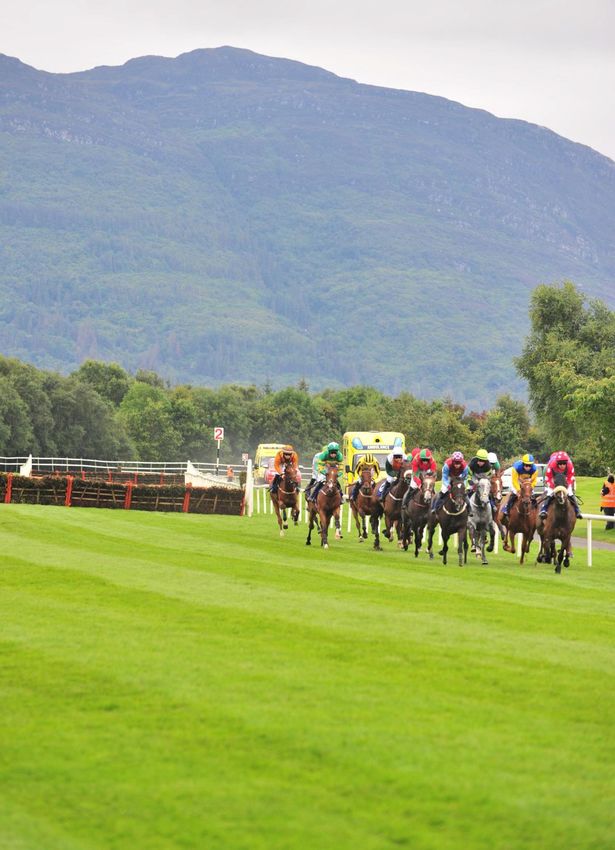
The Economic Contribution and Financing of Racecourses in Ireland 2017

Qualitative Response Assessment. On a qualitative basis racecourses are somewhat more positive about the
current and future position of racecourses. While the general economic downturn appears to have been
mostly overcome, it has been replaced by concerns about the effect of Brexit on the industry and on
racecourses. Racecourses are now less concerned than previously about their financial position and their
ability to support future investment. However, racecourses have concerns about a number of critical issues
relating to Brexit, attendance levels, the continuation of media rights income and managing operating costs.

Summary Financial Assessment. The overall assessment of the financial position of racecourses is that the loss
making position seen in earlier years has now been reversed and racecourses are making a reasonable level of
profits and generating positive cash flows. Almost all revenue sources have increased and this, combined with
the continued support from media rights income means that the racecourse sector is in a better financial
position than previously. However, the returns are not uniform across all racecourses. The financial situation
of individual racecourses can differ markedly from the overall average position. We have identified seven
racecourses that are either unprofitable, marginally profitable or whose profitability is highly exposed. Debt
levels have been reduced but the aggregate working capital position of racecourses is too low and needs
attention. The level of return on assets is still low and lower still when calculated on a replacement cost basis.

Total revenue for all racecourses is estimated to have been over €56 million in 2016. Revenues from all
sources - other than non-racing income - have increased over the period 2013 to 2016 and show a
continuation of the recovery from the sharp declines in previous years that arose as a consequence of the
economic downturn and its impact on key revenue elements such as Attendance, Betting, Advertising and
Sponsorship etc.

Media Rights income rose by just over €3.3 million in the period. Although Media Rights Income is now
somewhat smaller as a proportion of total revenue it is still by far the largest income source for racecourses
and, if non-racing income is excluded, represents half of all racing related income. Media rights income
remains the single most important revenue source for racecourses and a critical dependency for the industry
overall.

Media Rights income is both the biggest support to Irish racecourses and, at the same time, the biggest risk to
racecourses and to the industry more generally. The dependency ratio, defined as Media Rights as a
percentage of Total Revenues, has reduced slightly overall in recent years. However, the dependency ratio
varies considerably by Grade of racecourse with Premium Racecourses depending on Media Rights for 30% of
their total revenues, Grade 1 racecourses depending on Media Rights for 55% of their total revenues while
Grade 2 racecourses depend on Media Rights for 67% of total revenues.

Any material reduction in media rights income would compromise the ability of racecourses to maintain and
invest in the racetrack asset, threaten the ability of many racetracks to continue as going concerns and,
ultimately, endanger the future of the overall horseracing industry.

Other Revenue Streams. There has been an increase in the proportion of total revenues contributed by
racegoers from 31% in 2012 to 34% or approximately one third of total revenues in 2016. Advertising and
Sponsorship has remained relatively stable as a proportion of total revenue at 4%. Non-racing income
represents about 6% of total revenues.

Profitability for all racecourses combined, expressed as a percentage of turnover, is estimated at 10.6% in
2016 but this is heavily dependent on media rights and non-racing income levels. Results vary between
individual racecourses and course types with Grade II type courses earning 13% profit on turnover and Grade I
type courses earning 9% with Premier racecourses earning 11%. The level of profitability of racecourses has to
be considered in terms of their core purpose which is to generate funds in order to provide venues for fixtures
for the benefit of all horseracing stakeholders including owners, trainers, jockeys, bookies, breeders and the
racegoing public. The on-going capital investment required is provided by means of capital grants, by
borrowings and by the level of cash reserves that racecourses can provide directly from profits generated and

Petrus Consulting                                                                                               3
The Economic Contribution and Financing of Racecourses in Ireland 2017

retained for investment purposes. Without media rights income, racecourses would have experienced
aggregate losses of over €18 million. This shows the very high level of dependency of the racecourses on this
revenue stream.

Operating Costs. Operating costs for racecourses are high at 75% of total revenues. This figure is similar across
Premier, Grade 1 and Grade 2 racecourses. The figure has increased when compared to the level seen in the
previous report where operating costs were estimated to amount to 64% of revenues. The data do not fully
allow an analysis of all the constituent elements of operating costs or the changes in the period but the
increase identified in average wages and salaries would explain the increase. This cost needs to be carefully
controlled in the future. Given the sensitivity of all the elements of the profitability mix a small increase in
costs over time can erode the limited level of profitability of individual racecourses and the sector overall.

Debt and Liquidity. During the period 2012 to 2015 racecourses are estimated to have reduced their total
liabilities by approximately €20 million. Interest costs have declined consistently since 2008 reflecting
racecourses paying off loans, reducing interest costs and a reduction in capital investment overall. The working
capital ratio is a measure of the working capital position measuring the ability of racecourses to pay their bills
as they become due. Levels above 2 are generally considered adequate and this ratio, at 1.20, is in the risk
area. The reason for the adverse movement in the ratio is that current liabilities have risen and, within that,
the dependence on short term loans has increased.

Return on Assets and Return on Capital Employed Ratios. In 2015, the return on assets and capital employed
ratios are positive but at a low level namely 3.5% and 3% respectively. These levels of return are higher than
previously achieved but are insufficient to ensure long term sustainability and support future capital
investment. When computed on the basis of replacement costs the return ratio falls below 2%.

Capital Intensity. Operating a racecourse is a capital intensive business that earns low returns which, if they
are made, are reinvested for the future. Each €1 in revenues is estimated to require €4 in capital investment.
Over the past 15 years racecourses have invested €212 million and plan to invest €296 million over the coming
15 years.

The benefits provided by racecourses do not accrue to the racecourses themselves but, rather, to the other
horseracing participants such as owners, trainers, jockeys, bookies, breeders, support and ancillary service
providers. Benefits also accrue to the wider economy in the form of employment and taxes/charges paid.
Racecourses are distinguished by the fact that their objective is not to earn a return for shareholders but to
maintain and develop their facilities in order to provide safe and enjoyable venues for holding race meetings.
They do not pay dividends and if profits are earned such profits are re-invested in the racetrack and associated
facilities for the benefit of all stakeholders.

Racecourse Asset. The most important function of racecourses is to develop and maintain the racetracks
themselves, which are located on land holdings encompassing 3,500 acres owned and operated by the 26
racecourses. Racecourse facilities have to be developed and maintained throughout the year even though
racing may only take place on a small number of days during the year. Racecourses in total are used for about
4% of the time available but must be maintained for the remaining 96% of the time.

Required future capital investment is estimated by racecourses to be €296 million in order to upgrade
facilities across all racecourses over the next 15 years. This is a considerable increase in the level of future
investment seen in the last report and may reflect underinvestment in more recent years along with pressure
to upgrade facilities and rising construction costs. It is also the case that there will be investments listed that
do not materialise because they cannot be funded as a result of the situation of individual racecourses.

Racecourses have estimated that grant funding of approximately €97 million will be provided and the balance
of €200 million will be provided by racecourses either directly or by borrowings undertaken for the purpose.
Whether through borrowings or by direct contribution by the racecourses, the cost of the racecourse

Petrus Consulting                                                                                                4
The Economic Contribution and Financing of Racecourses in Ireland 2017
investment in terms of interest and capital payments and to provide racecourses’ own direct financial
contribution comes from profits generated and retained for reinvestment. The investment required net of
anticipated grants at 33% cannot be funded by all racecourses on the basis of current profitability and cash
flows generated.
Racecourses, in aggregate, need to generate free net cash flow of c. €16.3 million annually to repay their loans
for new investment, repay existing borrowings, and allow them to contribute their portion of their own
funding. This figure compares to the approximate €12.5 million cash flow that racecourses are estimated to
have generated in 2016 meaning that there is a shortfall in the ability of the racecourses to finance the
required investment. Either the investment has to be reduced, grant aid increased, profitability and free cash
flow increased or a combination of all of these elements. Implicit assumptions include that there are no cost
increases or additional operating costs incurred and that revenue sources and in particular media rights
income remain stable into the future. This is also an aggregate calculation taking all racecourses together and
the Premier racecourses having the largest investment plans will find it more difficult than the Grade 1 and
Grade 2 racecourses that have more achievable investment plans. In order to fund the required investment
the following are required:
Investment requirements to be prioritised with associated business cases
Improved profitability and free cash flow to be generated by racecourses from all sources
Increased revenue and / or decreased costs for all racecourses
Capital grant level to be increased
Racecourses have only recently become moderately profitable but the level of profitability and cash flow
generated is still inadequate to fund the level of capital investment identified by racecourses as being required
over the next 15 years. The racecourse asset requires considerable investment over the coming years which
can only be provided from grant aid, borrowings and cash reserves. Racecourses need to increase the current
level of profitability or else the necessary capital investment cannot be made. If racecourses cannot invest to
maintain and develop the racecourse asset then horseracing itself and all the related stakeholders will suffer.
Taxes and Charges. Racecourses are estimated to pay over €5 million annually in taxes and charges equivalent
to over 37% of operating profit.
Asset Replacement Cost. The overall replacement cost for the land and buildings for all racecourses is
estimated to be over €325 million.
Cost per Attendee. The average cost per attendee taken across all racecourses is €37 compared to the
average admission price of approximately €15 showing that racegoer attendees are paying a small proportion
of the cost of holding the fixture. The balance is made up partly by income from bookmakers, non-racing
income and advertising. However, the largest contribution is made from media rights income that contributes
over €18 per racegoer without which racecourses could not survive.
Cost per Fixture. The average cost to hold a fixture across all racecourses is almost €140k. This cost varies
widely according to the specific cost structure of each racecourse and the nature of the meeting from a low of
c. €60,000 to a high of c. €340,000. The average per fixture cost is €260,000, €114,000 and €90,000 for
Premier, Grade 1 and Grade 2 racecourses respectively.
Petrus Consulting 5The Economic Contribution and Financing of Racecourses in Ireland 2017 2. TERMS OF REFERENCE AND METHODOLOGY 2.1. BACKGROUND Petrus Consulting was engaged by the Association of Irish Racecourses (“the Association”) to carry out a review of the financing and economic contribution of Irish racecourses. The review is a follow-up to a similar review carried out in 2013. This current review can be read as a standalone report without reference to the previous review. For this reason, where relevant, the review repeats some material provided in the earlier review. Every racecourse in Ireland is a member of the Association and a list of racecourses is included as Appendix 1. The summarised objectives of the Association include furthering the interests of horseracing generally in Ireland and particularly the interests of racecourse owners and executives and advising and assisting members individually and, or, collectively on all matters pertaining to their separate and collective interests. The earlier review highlighted the importance of racecourses to the overall ecosystem of horseracing across the island. It identified the highly capital intensive nature of the business and the low level of return on investment, the critical importance of media rights income and the need for continuing and significant capital investment in the racecourse asset in future years in order to maintain and improve facilities for the benefit of all stakeholders. The review sought to highlight the economic contribution of racecourses and their financial structure in order to raise understanding among other industry participants about the high cost structure of racecourses, their capital investment requirements and their low level of profitability. The terms of reference for this current review are the same as before namely to: Update the previous review by examining the contribution which the racecourses make to the overall horseracing industry (including to owners, trainers, breeders, on and off course betting, attendees at meetings, sponsors and all the other associated direct and indirect social and economic benefits.) Review and examine the overall finances of the racecourses with particular attention to the following: income streams from all sources including attendances, sponsorship, media rights, grants the costs associated with operating these racecourses the level of capital expenditure which has taken place over the last 15 years future aggregate investment requirements borrowings, loans and cash position of the racecourses. 2.2. METHODOLOGY The methodology for the review comprised the following: A questionnaire was circulated to all racecourses requesting quantitative information on, for example, their income and expenditure levels and the trends therein, past and future capital expenditure and employment levels. Respondents were also asked to provide qualitative information on their views about the current and future issues facing their racecourses. The Association of Irish Racecourses assisted in circulating the questionnaire and used its influence to obtain responses. We wish to thank all the racecourses for responding to the questionnaire and for providing us with their detailed financial information and views on racecourses. A desk analysis of previous reports and reviews on the horseracing and related industries was carried out. In some cases, aspects of these reports which have a direct bearing on the racecourse element of the overall industry were updated for use in this report based on more recently available data. Petrus Consulting 6
The Economic Contribution and Financing of Racecourses in Ireland 2017

Financial information for racecourses was obtained from the returned questionnaires and also from the
annual financial statements which several racecourses also provided. These annual financial statements were
supplemented by accessing information from the Companies Registration Office (“CRO”) which in many cases
was available in greater detail. However, some racecourses are exempt from filing full financial statements or
became exempt during the period examined. Similarly, most racecourses have filed financial statements for
years up to and including 2015. Some, but not all racecourses, have filed financial statements for 2016. This
means that care must be taken in examining trend information based on CRO information throughout this
report because the base of racecourses in succeeding years may not be comparable.

Where meaningful or where the confidentiality of data provided by individual racecourses would not be
compromised we analysed the data provided by racecourses according to the grade of racecourse in the
categories of Premier, Grade I and Grade II to highlight differences in financial performance according to the
size of racecourse. See Appendix 1 for the categorisations of racecourse used.

A set of ratios related to profitability and return on investment was applied to the financial data for each
racecourse, the separate grades of racecourse and the racecourses in aggregate.

2.3. SCOPE OF THE REVIEW
The time period covered by the review is based on the most recently available information. The
questionnaires provided information in all cases based on 2013 - 2016 income and 2016 expenditure levels.
CRO financial statements were obtained from 2006 up to the most recently available time period which in
most cases was 2015 with, in some cases, information for 2016. The racecourses included in the review
comprise all the members of the Association of Irish Racecourses. There are 26 such racecourses as set out in
Appendix 1.

The economic review deals mainly with issues related to racecourses directly and also take into consideration
several of the closely related horseracing activities such as betting. The review does not go beyond the
horseracing industry into the wider economy although it is recognised that the horseracing industry is a key
contributor to the overall economy in terms of breeding, betting and, in addition, provides social and amenity
benefits not captured in economic terms as well as being an employer in its own right.

The scope of this review therefore concerns racecourses within the context of the overall horse racing
industry. However, in certain areas we have considered the wider contribution of racecourses such as, for
example, the role that racecourses play in tourism or the linkages between horseracing and the bloodstock,
media and gambling industries.

Our main focus is on the horse racing industry and we only consider wider social and economic impacts to the
extent necessary to provide a clear view of the overall impact of racecourses with the pool of related and
supporting activities.

2.4. STRUCTURE OF THE REVIEW
This report is structured as follows:

Section 1     Executive Summary contains a summary of the main findings from the review.

Section 2     Background, terms of reference and methodology for the report.

Section 3     An assessment of the economic contribution of racecourses.

Section 4     An assessment of the financial position of racecourses and their future outlook.

Petrus Consulting                                                                                           7
The Economic Contribution and Financing of Racecourses in Ireland 2017
3. ECONOMIC CONTRIBUTION OF RACECOURSES
3.1. OVERVIEW
Since the previous review in 2013 there has been a general improvement in the economic environment
and the effects of this can be seen in several of the key indicators for the horseracing sector and for the
industry overall. A key measure of the resilience of Irish racecourses is that all 26 survived the economic
crisis enabled in no small part by the availability of media rights income and the effort and dedication of
racecourse owners, management and staff.
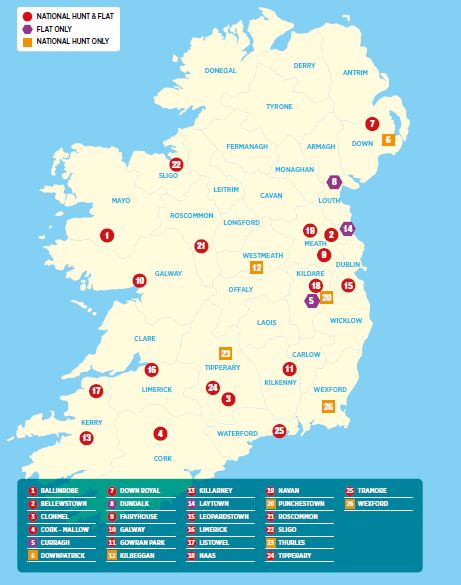
Irish racecourses make an important economic contribution to the horseracing sector within the
country. At a basic level, racecourses are the critical element for horseracing to take place – without
the well-developed network of 26 racecourses located in nineteen different counties on the island,
which are capable of hosting both National Hunt and flat race meetings, horseracing in Ireland simply
would not happen and the related economic activities such as training, horse breeding, and betting
would either not be possible or would be seriously curtailed. In this sense, racecourses may be seen as
the underlying ‘network infrastructure’ over which the spectacle of horseracing, with all its ancillary
add-on activities, is provided to the public.
Figure 1: Location of Racecourses in Ireland
Source: Horse Racing Ireland Factbook
Petrus Consulting 8The Economic Contribution and Financing of Racecourses in Ireland 2017
It would be easy to extend this analogy to imagine that the network of racecourses which exists bears
strong similarities to other types of networks, over which services are provided to end-users. It is quickly
apparent, however, that any such analogy is quite limited, given that the economic activities that occur
over the racecourse network involve very different kinds of relationships between the various parties
involved compared to the provision of services over other network industries, such as electricity, gas,
telecommunications, railways and so forth.
These other network industries were for many years characterised by monopoly provision of services to
end-users, with a vertically integrated monopolist both owning the infrastructure and providing all the
services along the value chain. In those network industries where competition has been allowed to take
place, the ex-monopolist incumbents have typically retained a very strong presence within their
respective sectors, with intervention from sectoral regulators required to ensure that other economic
operators are granted access to the incumbents’ networks in order to provide their own services to end-
users. In a number of these sectors – such as the retail supply of electricity and gas – the ex-monopolists
have retained high market shares while in others – for example, railway services – competition has yet
to be introduced at all. In this case, the integrated monopoly that owns and operates the network
infrastructure also controls and operates every facet of production in relation to the service provided.
In contrast, racecourses have never acted – and would never have been in any position to act - as
monopolists in the provision of horseracing services on their network of racecourses. Instead,
racecourses3 have actively co-operated with other parties - such as regulators, owners, trainers, on-
course bookmakers, facilities providers, sponsors, media companies, the racegoing public etc. - to create
between them an attractive year-round programme of race meetings across the country. In this regard,
while the existence of racecourses themselves is a necessary condition for horseracing to take place, it is
not in itself a sufficient condition. For horseracing to happen, the active input of all the other key players
listed above is required as well.
It is also instructive to view the provision of horseracing services – and, in particular, the active
collaboration in doing so by a number of disparate and different economic agents – as a type of
economic ‘ecosystem’, whereby the different parties bring very different resources, inputs and skills to
horseracing overall which, when combined together, enables the provision of an attractive and
important sporting spectacle. As well as providing their own inputs to the process, these different
entities have their own individual expectations about the kind of outputs they expect to derive from
their involvement in horseracing.
The kinds of inputs provided and outputs derived by the various parties involved in horseracing tend to
be well established amongst the parties involved. Sudden changes in commercial arrangements
governing any of these inputs or outputs – say, for example, a rapid decrease in the amount of
sponsorship money being made available or a significant rise in entrance ticket charges to the racegoing
public – would clearly have the capability of upsetting the quite delicate balance that currently exists
3
There are many racecourse owners and the racecourse ‘network’ is not owned by a single entity: four of the 26
racecourses are owned by HRI but the remainder are owned and operated by local committees and/or companies. In
contrast, in other network industries the entire network infrastructure tends to be owned by a single entity (aside
from telecommunications, where a number of competing networks exist).
Petrus Consulting 9The Economic Contribution and Financing of Racecourses in Ireland 2017 between the various economic agents operating in the horseracing sector. Changes in what entities pay for services provided to them by others or in payments for services they themselves provide therefore require careful consideration in terms of the impact such shifts might have for the financial and economic wellbeing of the sector as a whole. We review a number of key trends within the industry before setting out a description of the services that are typically provided at Irish racecourses. We then focus on the inputs to horseracing made by Irish racecourses and the outputs the courses deliver from their involvement on the industry. We examine indirect as well as direct economic effects and focus on the positive spin-off effects generated by horseracing, focusing in particular on the key areas of tourism and employment. Finally, we set out a forward-looking assessment by the racecourse operators themselves of the prospects for Irish racecourses derived from the qualitative responses to the questionnaire. Petrus Consulting 10
The Economic Contribution and Financing of Racecourses in Ireland 2017

Table 1: Irish Horse Racing and Betting Industries in Numbers (2006 - 2016)
                                                                                                                                                      Change     Avg.     Avg.
                                                                                                                                                       from     Level   Change
     Key Indicators for Horseracing                     2006    2007    2008        2009    2010    2011    2012    2013      2014    2015    2016
                                                                                                                                                       Peak -   2012-    2012-
                                                                                                                                                       2016     2016     2016
Betting and Exchequer Funding
Total Betting                                  €m.      3,667   3,926   3,903       3,281   3,257   2,858   2,843   2,675     2,755   3,262   5,245      0%     3,356       600.28
Total On Course Betting                        €m.        262     282     237        182     164     153    135.4   132.8     138.7   156.1   169.5    -40%      147          8.53
Total Off-Course Betting                       €m.      3,405   3,644   3,666       3,099   3,093   2,705   2708    2,542     2,616   3,106   5,075      0%     3,209       591.75
Total Government Funding of HRI                €m.         56    58.5         61     54.5    47.4    45.8     45         44    43.3    54.4    59.2     -3%       49          3.55
Prize Money
Total Irish Horse Racing Prize Money           €m.       55.1    59.6         60     52.9     46     44.4    44.9        46    48.6    53.4    56.8     -6%       50          2.98
HRI Funding of Prize Money                     €m.       30.6    32.3         34     30.3    28.3    28.1     28     28.9      30.8    34.9    36.4      0%       32          2.10
Commercial and Other Prize Money               €m.        8.6      10         9.2     7.9     5.4     5.2     5.9     5.8       5.9     6.2     6.8    -29%         6         0.23
Owners' Funding of Prize Money                 €m.       15.9      18    17.2        14.7    12.3    11.1     11     11.3      11.9    12.3    13.6    -23%       12          0.65
Attendance, Fixtures, Races and Entries
Total Racecourse Attendance                    000's    1,447   1,461   1,392       1,237   1,198   1,238   1,194   1,238     1,285   1,276   1,317    -10%     1,262        30.75
Average Attendance                                      4,536   4,387   4,070       3,586   3,587   3,685   3,413   3,548     3704    3,636   3,700    -18%     3,600        71.75
No of Fixtures                                            319     333     342        345     334     336     350     349       347     351     356       0%      351          1.50
No of Races                                             2,268   2,397   2,454       2,444   2,381   2,397   2,516   2,530     2,489   2,522   2,577      0%     2,527        15.25
No of Race Entries                             000's     87.4     105    96.5        94.7    72.5    65.9     64     63.5       56     54.9    58.3    -45%       59    -     1.43
Racehorse Numbers and Sales
No. of Stallions Mares and Foals in            000's     31.7      34    32.8        29.3    23.2    21.5    21.3    21.1      21.4    22.7    24.1    -28%       22          0.70
Ireland
of which foals born                            000's       12      13    12.4        10.2     7.6     7.6      8      8.2       8.3      9      9.3    -26%         9         0.33
No. of Irish Foaled Horses Exported                       n/a     n/a   5,016       5,315   5,181   4,987   4,837   4,844     5,028   5,115   4,992     -6%     4,963        38.75
Agg. Value of Irish Horses sold in Irish       €m.        192     179     100         68      68      81     93.8   133.4     147.4   152.5   164.1    -15%      138         17.58
Sales
No. of Horses in Training                               6,585   6,742   6,817       6,483   5,769   5,030   4,846   4,556     4,175   4,026   4,154    -39%     4,351   - 173.00
No. of Racehorse Owners                                 5,207   5,588   5,641       5,107   4,667   4,278   3,457   3,289     3,108   3,011   3,038    -46%     3,181   - 104.75
   Source: HRI Factbooks, Petrus Analysis
   Petrus Consulting                                                                                                11
The Economic Contribution and Financing of Racecourses in Ireland 2017 Table 1 sets out a number of key indicators for the overall horseracing and betting industries in Ireland from 2006 to 2016 inclusive. Since the previous review, several indicators have improved substantially but many still remain below the peaks achieved in earlier years. Total betting and government funding of HRI have increased significantly although on-course betting still remains well below the levels seen in earlier years albeit with some increase in more recent years. This is as a result of a technology shift whereby an increasing number of racegoers can place bets using smartphones while on the course. The substantial increase in revenues recorded from off-course betting from 2015 onwards is a result of enacting the Betting (Amendment) Act, 2015 that brought online betting into the tax net. KEY TRENDS RELATING TO RACECOURSES The number of racing fixtures (Figure 2) and races held (Figure 3) have increased since 2006. Despite a decline in both races and fixtures in 2009, 2010 and 2014, the number of each in 2016 surpassed the former peak values in 2012 and 2013, respectively. Figure 2: Number of racing fixtures, 2006 – 2016 Source: HRI Factbooks, Petrus Analysis Figure 3: Number of races held, 2006 - 2016 Source: HRI Factbooks, Petrus Analysis Petrus Consulting 12
The Economic Contribution and Financing of Racecourses in Ireland 2017

Despite increasing numbers of both races and fixtures, the attendance at race meetings has declined
from its peak of 1.46 million in the year 2007 (Figure 4). By 2012 there had been an 18% decrease in
attendance to 1.19 million, with the largest fall in attendance observed between 2008 and 2009, during
a period of sharp economic contraction. Since 2012, attendance at race meetings has increased
moderately, from 1.19 million to 1.317 million, an annual average increase of approximately 30,000
racegoers.

    Figure 4: Attendances at race meetings, 2006 - 2016

Source: HRI Factbooks, Petrus Analysis

However, as seen above, the number of racing fixtures has increased since 2006. Given the decline in
overall attendance it is unsurprising that the average number of racegoers attending each race fixture
has declined by a greater amount and is still considerably below the peak level achieved in 2006 – Figure
5 below. In 2016, average attendance was 3,700 compared to an average attendance in 2006 of just
over 4,500. There has been an 18% decline in average attendance over the period. The trend line,
(shown in red) illustrates the decline and the more recent modest uplift in average attendance.

As will be seen later in this report the fixed costs associated with holding a fixture are considerable and
declining attendances are a serious concern for the future financial wellbeing of racecourses.

Petrus Consulting                                                                                       13
The Economic Contribution and Financing of Racecourses in Ireland 2017 Figure 5: Average Attendances at Race Meetings, 2006 – 2016 Source: HRI Factbooks, Petrus Analysis A sharp decline in government funding of HRI is observed between the years 2008 and 2010, with a 22% reduction from €61 million to €47.4 million over the two years (Figure 6). From 2010 to 2014 there was a steady decline in HRI government funding, from €47.4 million to €43.3 million, a 9% decrease. There was a sharp increase in government funding in the years 2015 and 2016; from €47.4 million to €54.4 million in 2015 and €59.2 million in 2016, a 37% increase from the 2014 figure. This increase is welcome and shows that the impact of bringing online betting within the tax net by the enactment of the Betting (Amendment) Act 2015. Figure 6: Total Government funding of Horse Racing Ireland, 2006 – 2016 Source: HRI Factbooks, Petrus Analysis Petrus Consulting 14
The Economic Contribution and Financing of Racecourses in Ireland 2017

A similar trend to that seen in Figure 6 is observed in the figures for the prize money available for
horseracing (Figure 7) which declined from its peak of €60 million in 2008 to €46 million in 2010, a 23%
decline. An increase in prize money is observed from 2011 onwards, with the sharpest increase
observed from 2014 to 2016; from €48.6 million to €56.8 million, a 17% increase. However prize money
in total has still not reached the level seen at the peak in 2008.

This increase is also welcome as it supports the wider horseracing industry but has only an indirect
impact on racecourses as it is racehorse owners who benefit in the first instance.

Figure 7: Prize money, 2006 – 2016

Source: HRI Factbooks, Petrus Analysis

Betting revenues, shown in Figure 8 and 9, experienced a significant decline, beginning as early as 2007.
In the case of total betting revenues (Figure 8), the decline is relatively steady, from a peak of €3.9
billion in 2007 to €2.7 billion in 2013 (a 32% reduction). In the case of on-course betting (Figure 9) the
decline was relatively drastic; from €282 million in 2007 to just €133 million by 2013 (a 53% reduction).
This can be attributed in part to the attendance levels at racecourses but a more important factor was
the rise in popularity of online betting. In both cases, there has been an increase in betting revenues
from 2013 onwards. Total betting revenues have increased from €2.7 billion in 2013 to €5.2 billion in
2016 (a 49% increase). At noted above the main element of this increase is a result of bringing online
betting within the tax net from late 2015.

Petrus Consulting                                                                                      15
The Economic Contribution and Financing of Racecourses in Ireland 2017

Figure 8: Betting revenues (total), 2006 - 2016

Source: HRI Factbooks, Petrus Analysis

The level of on-course betting revenues has seen a modest increase in recent years and the trend is
positive but is 40% below the peak level seen in 2007.

Figure 9: On-course betting revenues, 2006 – 2016

Source: HRI Factbooks, Petrus Analysis

Since 2008, there has been a steady decline in the number of racehorse owners. In 2006 there were
5,207 racehorse owners and by 2016 this number had declined to 3,038. The figures for horses in
training show a large reduction - from a peak in 2008 of 6,817 horses in training, by 2016 this number
had declined to 4,154.

Petrus Consulting                                                                                  16
The Economic Contribution and Financing of Racecourses in Ireland 2017

Figure 10 below shows the level of horse ownership and horses in training from 2006 to 2016 with 2006
as the base year. It can be seen that there is a close correlation between the decline in horse ownership
and horses in training. Horse ownership and horses in training are a key indicator for the present and
future strength of the industry and the decline in these numbers is a particular concern.

Figure 10: Level of Horse Ownership and Horses in Training 2006 – 2016

Source: HRI Factbooks, Petrus Analysis

Summary of Key Indicators
 Indicator     Trend                                 Impact on Racecourses
 Racing        Small Increase                        Somewhat positive but see declining Average
 Fixtures                                            Attendance
 Races Held    Small Increase                        Positive impact on Media rights Income
 Total         Small increase in recent years        Positive but insufficient to counteract rising costs.
 Attendance                                          On a per fixture basis the increase is minimal
 Average       Still well below Peak                 Cost structure for racecourses is predominantly
 Attendance                                          fixed and there is a high cost per fixture.
 Government Almost at peak levels                    Recent increases are welcome and beneficial
 Funding
 Prize Money Almost at peak levels and               Welcome but only indirect impact on racecourses
               increases in recent years             generally
 Betting       Strong increase in recent years       Widened funding source is welcome
 Revenues      from inclusion of online betting
 On-course     Still far below peak levels but       On-course bookie revenue is important to
 Betting       small recent increase                 racecourses and they are under severe threat
 revenues
 Racehorse     Large reduction in number of          As key indicators for the present and future of
 Owners        owners and Large reduction in         horseracing, the large reduction in both
 Horses     in horses in training                    indicators is cause for concern.
 Training
Source: Petrus Analysis
Petrus Consulting                                                                                       17
The Economic Contribution and Financing of Racecourses in Ireland 2017 3.2. SERVICES PROVIDED AT RACECOURSES As well as providing the locations at which owners, trainers, jockeys and race-goers can all benefit from and enjoy the spectacle of horseracing, racecourses also provide the occasion and the facilities for other horseracing industry participants to supply a number of important services. Such services include the provision of dedicated, serviced areas for on-course catering, stabling and on-course betting. Racecourses also enable the racing fixtures to be broadcast to a far wider audience across the world for enjoyment and for off-course betting purposes in Ireland and in other countries. Racecourse venues are also used for a variety of other non-racing purposes, ranging from conferences to car boot sales, and some racecourses have facilities such as co-located golf courses and gyms. Racecourses provide and pay for a number of services that enable race meetings to take place. The most important function of racecourses is to develop and maintain the racetracks themselves, which are located on land holdings encompassing 3,500 acres owned and operated by the 26 racecourses. Racecourse facilities have to be developed and maintained throughout the year even though racing may only take place on a small number of days during the year. Racecourses in total are used for about 4% of the time available but must be maintained for the remaining 96% of the time. As well as the racetracks, racecourses also have other facilities such as turnstiles, stands, car parks, enclosures, bars, restaurants, weighing rooms, first-aid rooms, stable yards and facilities for on-course betting (comprising both on-course bookmakers, typically located in a bookmakers’ ring, and the Tote). From the returned questionnaires, racecourses reported employing almost 1,300 staff for race days in total comprising both full time staff and part time race day employees. The related employment costs for these staff are reported at over €12 million. Racecourses also provide and pay for necessary racing-related equipment such as admission systems for racing participants, public address systems, closed-circuit TV systems, race cards and race form information, telephones and media facilities, including dedicated press rooms. Racecourses also arrange for the provision of important support personnel and services at race meetings. Key personnel include stewards, doctors (usually a minimum of two), Order of Malta personnel (usually at least 12), two ambulances, two veterinary surgeons (in addition to the veterinary surgeon provided by the Turf Club), a Blue Cross horse ambulance, farriers and security personnel. Racecourses provide support to and liaise with An Garda Síochána in the area of traffic management in the vicinity of racecourses on race meeting days. Racecourses are also obliged by the Health and Safety Authority (HSA) to prepare and maintain event emergency plans in relation to race meetings held at their tracks. Racecourses are also subject to stringent regulation from a variety of bodies such as the Health and Safety Authority, Local County Councils regarding fire, water, waste and development planning, the Food Safety Authority for catering facilities, Revenue Commissioners for tax purposes, the Turf Club for participant facilities and Horse Racing Ireland for physical infrastructure. This regulatory oversight has improved horseracing and racecourses for the benefit of everyone involved in the sport but the burden of regulation itself falls principally on racecourses. Petrus Consulting 18
The Economic Contribution and Financing of Racecourses in Ireland 2017

3.3. ECONOMIC INPUTS AND OUTPUTS RELATING TO RACECOURSES
Table 2: Racecourse Benefits Provided and Received to and from Stakeholders
 Stakeholders          Benefits/Inputs       from Outputs from Stakeholders
                       Racecourses              to to Racecourses
                       Stakeholders
 Owners                Racecourse Facilities        Racehorses (but no financial             benefit   to
                                                    racecourses)
 Trainers and Jockeys Racecourse Facilities         Racehorses (but no financial             benefit   to
                                                    racecourses)

 Caterers                 Racecourse Facilities         Concession fees
 On-course                Racecourse Facilities         Pitch fees
 Bookmakers

 Off-course               Race meeting content Media rights income
 Bookmakers               provided
 Sponsors                 Exposure/publicity           Fees for Sponsors guests. Racecourses also raise
                                                       race sponsorship for the benefit of other
                                                       stakeholders
 Advertisers              Exposure/publicity           On course Advertising fees
 Racegoers                Racecourse Facilities - Race Entrance money
                          meetings
 Media                    Race meeting content and Exposure/publicity (but no financial benefit to
                          press facilities             racecourses)
 Breeders                 Showcase/Shop window         Racehorses indirectly (but no financial benefit
                                                       to racecourses)
 Government/HRI           Racecourse Facilities, Taxes Capital Grants/Fixture Management, Regulatory
                          and Charges
Source: Petrus Analysis
The economic activities of racecourses may be seen in the context of a number of key inputs and
outputs. These are summarised in Table 2 above. As can be seen, racecourses provide a variety of
important inputs to various other entities or stakeholders involved in the horse racing industry, some of
which are remunerated in monetary form whereas others are not.

A critical input provided by racecourses is the range of on-course facilities described above that are
made available to owners and trainers when they bring their horses to race meetings. Racecourses
provide on-course facilities such as stabling, changing facilities for jockeys, parking etc. as well as the
track itself over which the races take place.

Racecourses also provide on-course facilities to other stakeholders that in turn provide retail services to
the racegoing public at race meetings. The main providers of such services include the different on-
course caterers (which range from table service offered to premium ticket holders to fast food outlets)
as well as on-course bookmakers, including the Tote.

Racecourses also provide important exposure and publicity – both on-course and over TV and other
media – for companies and organisations who rent advertising space at strategic locations around the
course. Race sponsors are also provided with the same kind of on-course and off-course exposure and
publicity.

Petrus Consulting                                                                                       19
The Economic Contribution and Financing of Racecourses in Ireland 2017 The key input provided by racecourses is, however, the venues themselves, with the racegoing public gaining access to the entertainment spectacle of an Irish race meeting, while media organisations gain access to valuable race meeting content for use in their TV programming. Live content from Irish race meetings is broadcast over a variety of Irish, UK and international TV channels, as well as being broadcast on a closed circuit TV basis and to off-course betting shops. Races held at Irish racecourses also provide breeders with important opportunities for showcasing equine talent. In this sense, racecourses act as the ‘shop window’ for the breeding industry as was pointed out by many of those responding to the racecourse questionnaire. For Government too racecourses are an important outlet for showcasing an important national industry, which means that racecourses may be seen as a key input to national policy aimed at the development of the Irish horseracing industry. Associated with each of these inputs provided by the racecourses, there are a series of corresponding outputs that racecourses may or may not receive. Caterers, on-course bookmakers and other on-course service providers pay concession/pitch fees to the racecourses in return for the facilities provided to them by the racecourses to enable them to trade at race meetings. However, owners pay race entry fees to HRI and trainers do not pay fees to racecourses. Companies and organisations who take advertising space at racecourses pay fees to racecourses for doing so and in return receive marketing exposure for their products or services. Racecourses raise race sponsorship funds that are then transferred to and administered by HRI for the ultimate benefit of winning owners and connections. Race sponsors also get exposure but in this case the racecourse tends not to receive direct remuneration as the winning owners take this in the form of prize money. Racecourses may receive a small percentage of revenues from sponsors indirectly through the payments made by caterers for sponsors' guests. In recent years, an important benefit for racecourses has been generated via media rights income ultimately paid by off-course bookmakers in return for the supply of race meeting content. Racecourses also derive monetary gains from racegoers and from the Government (via HRI), the former by way of entrance fees to race meetings and the latter via capital grants for the development of racecourses. In a later section we set out the revenue and cost structure of the racecourse element of the overall horseracing spectacle. HRI also provides important capital grants which benefit racecourses and fixture management services to the overall horseracing industry. The inputs made and outputs that are derived from horseracing are not, of course, limited to those that directly involve the racecourses themselves, although it remains the case that without the existence of racecourses none of these inputs or outputs would occur. Examples of these include the relationships between bookmakers on the one hand and racegoers and owners on the other in relation to bets laid and winnings paid out on races, food and drink provided by caterers to racegoers, owners and trainers and the revenues earned by them arising from this and the relationship between breeders and owners, which is so dependent on the results garnered by horses in races held at Irish racecourses. Taken together, these relationships of themselves constitute a significant volume of economic activity – much of which bypasses the racecourses and is captured, in an economic sense, by other industry participants. Petrus Consulting 20
The Economic Contribution and Financing of Racecourses in Ireland 2017

    3.4. IMPACT ON LOCAL ECONOMIES: TOURISM
    Recent information on the relationship between horseracing and tourism is lacking. However, from
    earlier work in this area, it is clear that racecourses play an important part in Ireland’s tourism
    industry, with a number of racing festivals coinciding with peak holiday times within the country. As a
    result, racing festivals held at Irish racecourses have an important role to play in the development of
    tourism within the country by attracting attendance at race meetings from domestic sources and from
    overseas.

    A research study commissioned for HRI in 20094 estimated the annual expenditure in the economy by
    overseas visitors who attend race meetings in Ireland came to just over €67 million. This study
    estimated that the number of overseas visitors attending race meetings in the period June 2008 to May
    2009 came to 68,405 who, between them spent an average of €980 per visit, yielding a total spend over
    the period of €67,036,900.

    The same study found that overseas visitors made up 9% of all attendees at race meetings in Ireland.
    Of this percentage, a sizeable proportion stated that attendance at a race meeting was the primary
    purpose of their visit to the country. Overseas visitors were found to be very similar to their Irish
    counterparts in terms of age and gender and, like Irish racegoers, had a slight preference for attending
    racing festivals. Three-quarters of all overseas visitors came from the UK (60%) or the United States
    (14%) and over half of them attended race meetings in Dublin (14%) or the rest of Leinster (38%).

    The same study conducted market research with overseas visitors to determine their reasons for visiting
    the country to attend race meetings. The principal reasons provided are illustrated below. The quality of
    the spectacle and the atmosphere at Irish race meetings were the two principal reasons provided for
    attending race meetings here.

    Figure 11: Reasons for Visiting Ireland for a Race Meeting

    Source: Horse Racing Ireland - Overseas Visitors Quantitative Research 2008/09

    A 2012 study carried out by National University of Ireland Maynooth (NUIM) estimated the value of the
    previous year’s Punchestown festival at just under €60 million.5 This study estimated that in addition to
    the direct economic contribution of €59,800,000 a further €9 to €12 million could be added to take
    account of indirect spin-off benefits to the local economy. The study estimated that the €59.8 million

4
  Overseas Visitors Quantitative Research 2008/09 Prepared August 2009 by Behaviour & Attitudes for Horse Racing
Ireland.
5 The Economic Contribution of the 2011 Irish National Hunt Festival at Punchestown to the Economy of Kildare and
its Surrounding Regions, Report for Punchestown Racecourse by NUIM, January 2012, available at:
http://www.goracing.ie/pics/2012/NUIMREPORT.PDF
    Petrus Consulting                                                                                          21
You can also read