The Economic Impacts of Transportation Investments - Forecasting the Benefits of Contra Costa's 2020 Transportation Expenditure Plan
←
→
Page content transcription
If your browser does not render page correctly, please read the page content below
January 2020

The Economic Impacts of
Transportation Investments
Forecasting the Benefits of Contra Costa’s
2020 Transportation Expenditure Plan

Contents

Executive Summary
Executive Summary............................................................................ 3
   Introduction.......................................................................................... 6

Chapter 1
Population and Employment.............................................................. 7

Chapter 2
Contra Costa County Economy........................................................ 10

Chapter 3
Performance of the County’s Transit and Highway Networks......... 20

Chapter 4
Transportation Expenditure Plan Overview..................................... 29

Chapter 5
The Economic Impacts of the CCTA’s 2020 Expenditure Plan......... 32

Notes
Endnotes.......................................................................................... 37
The Economic Impacts of Transportation Investments
Forecasting the Effects of the Contra Costa Transportation
Authority 2020 Transportation Expenditure Plan

         The Contra Costa County transportation system
         is key to the county’s economic success

43% 						                                              Contra Costa County’s population and employment
                                                        are projected to grow over the 35-year Transportation
of employed Contra Costa residents commute out of       Expenditure Plan (TEP), increasing pressure on the
the county. Out-commuters are on the rise, increasing   transportation system. Home to 1.1 million people,
in number by 27.6% from 2010 to 2017.                   Contra Costa County is expected to grow by 32% by
                                                        2055. Contra Costa County currently has 401,000 jobs,

7 out of every 10
                                                        and countywide employment is expected to grow by
                                                        41% by 2055.
employed Contra Costa County residents drive alone
                                                        The county’s transportation system performance shows
to work, compared to 6 out of every 10 in Alameda
                                                        the need for TEP investments to improve the efficiency
County and 3 out of every 10 in San Francisco County.   of the transportation system and the lives of residents
                                                        who rely on the system daily. Delay from countywide

650,000 					                                           congestion has increased 103% since 2010, now totaling
                                                        5.4 million annual vehicle hours of delay (VHD), the
daily commuters take trips that rely on routes that     equivalent of 4.72 hours per capita. Out of the most
either pass through, end, begin, or are completely      congested corridors in the Bay Area, four out of 10 are
within Contra Costa County. These commuters have        in Contra Costa County. The average county resident
increased by 21.1% since 2010.                          spends the equivalent of 13 days commuting every year,
                                                        2.6 more days than the average California resident.

         Locally generated transportation tax dollars in Contra Costa
         County have a track record of funding successful infrastructure

New transit options funded through previous local tax
Measure J have been popular, outperforming ridership
projections—showing an appetite for new transit
options in Contra Costa County—which the TEP would
deliver.

     Richmond to San Francisco ferry service
outperformed daily ridership projections by 60% by
the fifth month of operation.

    In 2018, eBART outperformed daily ridership
projections by 29%.

    23 express lane miles built on I-680, taking
advantage of unused high occupancy vehicle (HOV) lane
capacity to ease congestion.

                            www.bayareaeconomy.org | @bayareaeconomy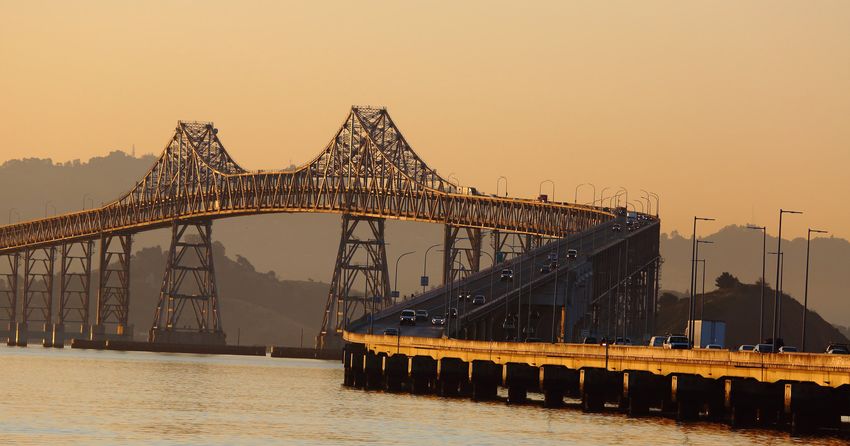
Investments
Report Title across the transportation network can
strengthen the Contra Costa County economy by:
JOBS TEP Spending by Subregion & Mode
Subregion
Creating jobs through Time and cost saving Southwest
West
$675M
capital investments and as a result of reduced $841M
operations congestion
$3.6B
$ East
$1,018M Central
Incentivizing economic Supporting business
$1,075M
Mode
development by attracting clustering and opening
businesses and workers Bike &
new markets
Ped 11%
Highways
Through $3.6 billion in transportation investments over
$3.6B
18%
35 years, the TEP will relieve traffic congestion, make Transit
44%
transit safer, cleaner, and more reliable, and provide
accessible and safer transportation options.
Local Streets
& Roads 27%
Economic Impacts of Contra Costa County
Transportation Expenditure Plan
Business
TEP Output &Impacts
Economic Jobs Derived
by from Contra Costa Count
Industry
Business Output Full-time Equivalent
Industry
($ in millions) Job Years
$3.6 billion Professional &
Business Services
1,771 9,060
in transportation spending over 35 years is expected to Financial Activities 1,664 3,517
result in: Construction 1,096 5,786
Manufacturing 1,004 349
$8.8 billion
Transportation 970 26,741
Education & Health
644 4,136
Services
in business output, representing new business revenues
Other Services 402 4,388
resulting from increased spending stemming from the
Wholesale Trade 370 573
initial transportation expenditures.
Retail Trade 363 2,179
Media & Information 281 202
1,656 jobs Postal & Warehousing
Government
114
70
754
145
supported annually for 35 years, the equivalent of
Utilities 39 40
57,965 full-time jobs years.
Agriculture &
13 95
Extraction
$2.3 billion Total 8,803 57,965
Note: Full-time equivalent job-years represent one year of one job. For example, a
full-time construction job lasting for four years would count as four job-years in
in cost savings benefit over 35 years. this table. Additionally, a 50% part-time manufacturing job lasting two years is
counted as one job-year.
Data: Calculated using TREDIS Software; inputs from Contra Costa County Model
Performance Measures
Analysis: Bay Area Council Economic Institute
www.bayareaeconomy.org | @bayareaeconomy
Per capita TEP-related savings based on Value
,!!&)
of Cost Savings Benefits
-
&
)&
projected 2055 population include: +*0*
!
$2.3B savings &-
by &/+0
2055
!
( -
!% )
$218 per capita reduction in vehicle !&)& $
operating costs, including maintenance,
operations, and fuel costs
#%)
!&)&
"$
$245 per capita reduction is safety costs
,! %&!
$575 per capita value of personal time
)/!&)&
*$
savings )/!&)&
"$
$449 per capita value of business time
savings
$58 per capita in value of environmental ,&
&&
)/ !&)&
benefits +$
All data calculated using TREDIS software with inputs from the Contra
Costa County Model Performance Measures. )
,
),&
!).%'
#,)&%! ! )%!&)!, )/!
%!% &,%&
1
/&
& /1%!,
! !
&)
),)
Key projects in the TEP address inefficiencies in
the current transportation system
$100 million $200 million
invested in East County high-frequency, high-capacity invested to relieve congestion, ease bottlenecks, and
transit extension to Brentwood and connectivity to improve local access along the I-680 corridor and $50
transit, rail, and parking. million to improve transit reliability along the I-680 and
Highway 24 corridors.
15,900 more Contra Costa County residents chose
transit as their commute mode in 2017 versus 2010, As the main route connecting San Ramon, the city with
showing an appetite for more transit options. the most jobs in Contra Costa County, to Concord,
the most populous city in Contra Costa County, both
directions of travel on I-680 together experienced 1.3
$19 million million vehicle hours of delay in 2018.
to improve traffic flow and local access to Richmond-
San Rafael Bridge along I-580 and Richmond Parkway. Projects Include:
Transit only “bus-on-shoulder” operation
188,000 vehicle hours of delay (VHD) on the 7.7-mile
approach to the Richmond-San Rafael bridge in 2018, Expansion of park-and-ride facilities
up from 5,000 VHD in 2010.
Advanced technologies that track and learn from
congestion data to inform adjustments to traffic
Congestion solutions along this corridor will address signals that smooth traffic and increase efficiency of
increases in delays to serve the 11,000 Contra Costa the freeway
County residents who commute to Marin County on a
daily basis. 25 miles of continuous express lanes
www.bayareaeconomy.org | @bayareaeconomy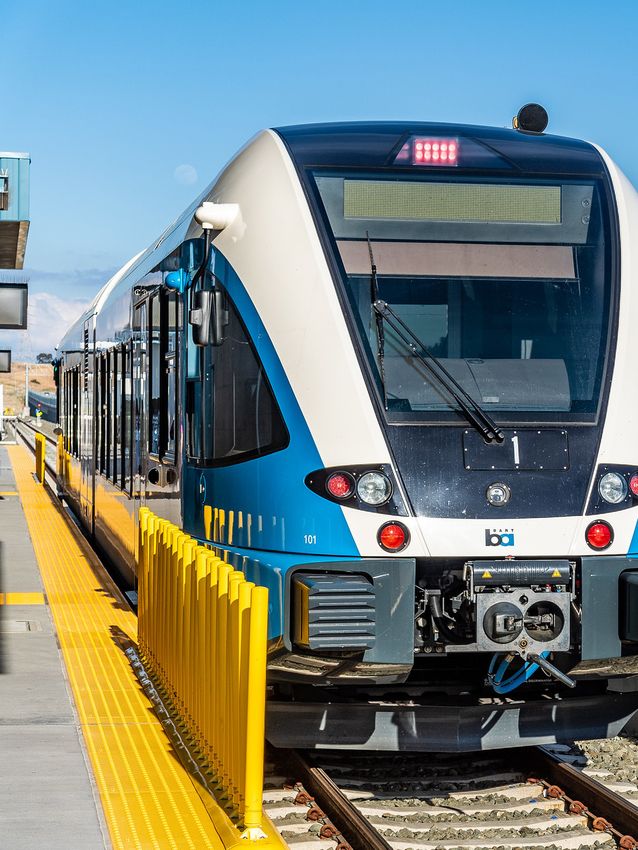
Bay Area Council Economic Institute

Introduction
Transportation networks are an integral support system          Consumer Spending
to economies. A well-functioning transportation network
efficiently connects people to jobs and businesses to           Transportation is the fourth largest category for
services, while enabling the flow of goods into and             personal expenditures in the U.S. Nationwide,
out of a region. The design of a transportation system          household spending on transportation totaled $1.2
influences land use, quality of life, and productivity of       trillion in 2017 and increased by 55% since 2000.3 The
communities. Transportation benefits can be measured            average household spent an annual total of $9,737
using many metrics, some of which are described below:          on transportation in 2017. Household transportation
                                                                costs can be even greater if a system is inefficient or
                                                                operating over capacity. One study estimates disrepair,
Employment
                                                                congestion and lack of safety features on roadways cost
The American Public Transportation Association found            the average Concord, CA driver $1,968 annually.4
that 24,200 full-time equivalent jobs are supported for
one year per $1 billion of combined spending on public          Goods Movement
transportation capital investment and operations.1
Additionally, the Federal Highway Administration                Balancing the needs of passenger and freight
estimates that 13,000 full-time equivalent jobs are             movement is also an important factor to consider, as
supported for one year per $1 billion of federal                congestion costs and road conditions impact goods
spending on highways.2                                          movement businesses. An analysis of the impact
                                                                congestion has on goods movement found that $20
                                                                billion worth of time and fuel was wasted in the trucking
Direct Transportation Network Benefits
                                                                industry due to congestion in 2017.5
Time savings for commuters—either by allowing for
varied mode choices or reducing congestion—can                  These measures display that businesses, commuters,
directly equate to an increase in productivity that             and residents benefit from a reliable and uncongested
benefits workers and employers. Transportation                  transportation system. California is ranked 41st
investments can also enhance safety, thereby                    for transportation infrastructure by U.S. News and
lessening the cost of accidents. Lastly, investments            World Report—a score that takes commute time,
in environmentally-friendly modes of transportation             road quality, unstable bridges and public transit
can reduce emissions, which can contribute to overall           usage into consideration.6 Continued investment in
environmental goals.                                            the transportation network is essential to remaining
                                                                economically competitive on a local and global scale.
Economic Development Benefits                                   This study analyzes the economic impacts of the Contra
Transportation investments can also reshape the                 Costa Transportation Authority’s 2020 Transportation
makeup of a local economy. Specifically, transportation         Expenditure Plan (TEP). A countywide economic
networks support business clustering and open new               profile, an analysis of jobs-housing imbalance, and
markets, allowing companies to enhance their supply             trends in regional commutes and mode share explain
chain efficiency, access broader labor pools, and target        the need for focused investment in Contra Costa’s
more customers. Transportation investments are also             transportation network. The performance of the current
tied closely to land use benefits, specifically as it relates   transportation system reveals how strategic investments
to transit investments. Transit-oriented developments           can serve travel needs and preferences throughout
have sprung up around rail stations, streetcar lines,           the county. Finally, modeling the economic impact of
and bus rapid transit (BRT) stops around the country            the investments in the TEP highlights the overarching
as investors look to take advantage of the density of           impact the transportation investments will have on the
people using those systems.                                     county’s economy.

6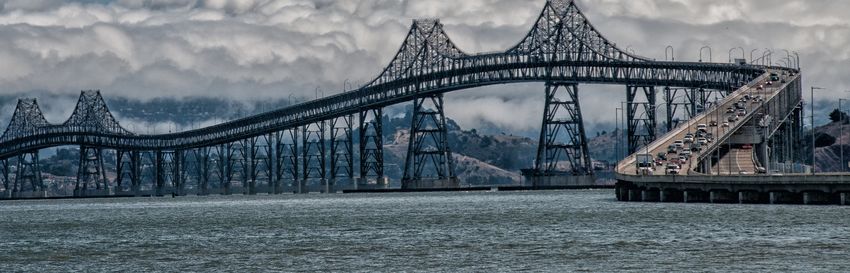
1
Population & Employment
Contra Costa County Population                                                                              Concord has the largest share at 17% of the total
                                                                                                            projected population growth, an increase of 61,000
Over the course of the 35 year timeline of the TEP,                                                         people by 2055.
projected population growth in Contra Costa County
is concentrated in a few urban areas in the county.                                                         Richmond is the second highest, with 15% of the
Contra Costa is currently home to 1.1 million people,                                                       projected growth, an increase of 31,000 people.
a population expected to increase 32% by 2055. Over
                                                                                                            Third, 10% of the growth is projected in Antioch,
40% of this population growth is projected to occur in
                                                                                                            estimated to add 35,000 people.
three cities in Contra Costa:

      Contra Costa County Population by Transportation Analysis Zone (TAZ) 2018

                                                                                                                          Antioch
                                                                                                 Concord

                                Richmond
                                                                                                                                      Brentwood

                                                                                             Walnut Creek

                                                                                                                                                  Population by TAZ
                                                                                                              San Ramon
                                                                                                                                                      < 250
                                                                                                                                                      250 - 500
                                                                                                                                                      500 - 1,000
                                                                                                                                                      1,000 - 2,000
     Data: Contra Costa Transportation Authority; Association of Bay Area Governments 2017
     Analysis: Bay Area Council Economic Institute
                                                                                                                                                      2,000+

                                                                                                                                                                      7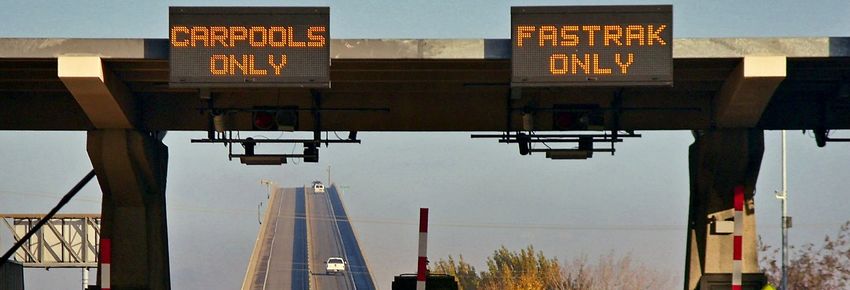
Bay Area Council Economic Institute

    Contra Costa County Population Change by Transportation Analysis Zone (TAZ) 2018-2055

                                                                                                                     Antioch
                                                                                            Concord

                           Richmond
                                                                                                                                   Brentwood

                                                                                        Walnut Creek

                                                                                                                                               Population Change
                                                                                                         San Ramon                             by TAZ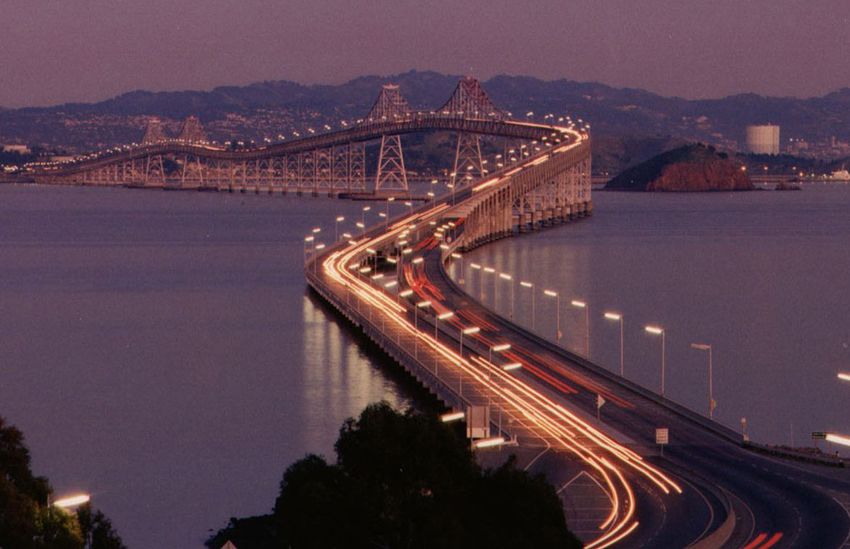
The Economic Impacts of Transportation Investments

  Contra Costa County Employment by Transportation Analysis Zone (TAZ) 2018

                                                                                                                     Antioch
                                                                                            Concord

                           Richmond
                                                                                                                                Brentwood

                                                                                        Walnut Creek

                                                                                                                                            Employment by
                                                                                                         San Ramon                          TAZ
                                                                                                                                               < 250
                                                                                                                                               250 - 500
                                                                                                                                               500 - 1,000
                                                                                                                                               1,000 - 2,000
Data: Contra Costa Transportation Authority; Association of Bay Area Governments 2017
Analysis: Bay Area Council Economic Institute
                                                                                                                                               2,000+

 Contra Costa County Employment Change by Transportation Analysis Zone (TAZ) 2018-2055

                                                                                                                     Antioch
                                                                                             Concord

                           Richmond
                                                                                                                                Brentwood

                                                                                        Walnut Creek

                                                                                                                                            Employment
                                                                                                         San Ramon                          Change by TAZ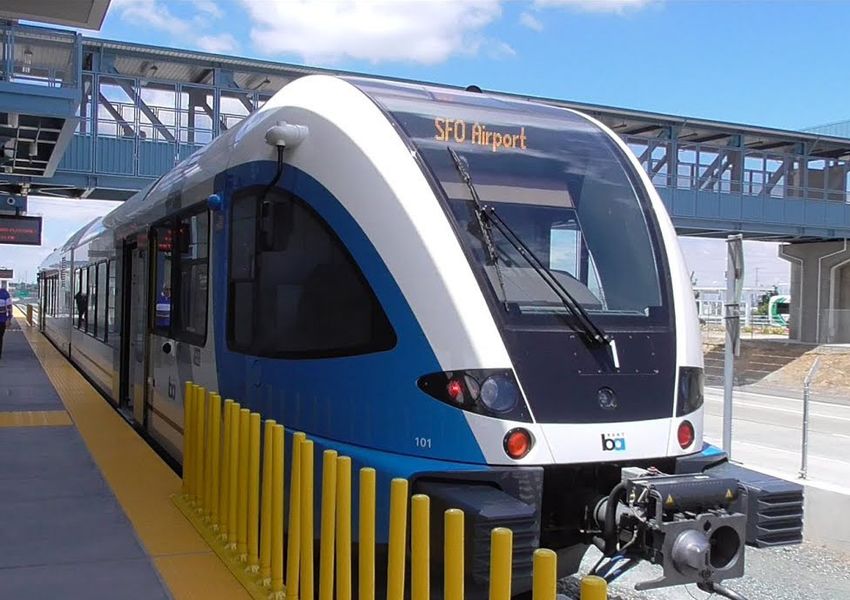
2
Contra Costa County Economy
Contra Costa has an annual Gross Domestic Product                            Health Care and Social Assistance leads employment
(GDP) of $73 billion, accounting for 17% of the San                          in Contra Costa with a 20% share of countywide jobs.
Francisco metropolitan area total GDP, which is the                          Retail Trade and Accommodation and Food Services
sixth largest of all metropolitan areas in the nation.7                      are the two other sectors that have over 10% share
The businesses contributing to Contra Costa’s economic                       of employment. Compared to other counties in the
output trust in the county’s transportation network.                         San Francisco metro area, Contra Costa has a lower
Ensuring they continue to thrive is dependent on                             percentage of jobs in the Professional and Technical
a functioning transportation system, which the TEP                           Services sector, at only 8% versus 10% in Alameda and
investments plan to deliver.                                                 20% in San Francisco.

                                           Top Sectors in Contra Costa
                                                                                             Finance and Insurance,
                                                                                                      6%

                                                                                                        Administrative and
                                                                                                         Waste Services
                                                All other                                                      7%
                                                  29%                                                          Professional and
                                                                                                              Technical Services
                                                                                                                     7%

                                                                                            Construction
                                                                                                8%

                                                                                  Accommodation and
                                                                                     Food Services
                                                                                         11%
                                             Health Care and Social
                                                   Assistance
                                                      20%
                                                                           Retail Trade
                                                                              13%

             Data: Quarterly Census of Employment and Wages Q1 2019; includes private, local government, state government, and federal
             government employment
             Analysis: Bay Area Council Economic Institute

10
The Economic Impacts of Transportation Investments
-"()2
-
()-
$
"4 -/55!/5#!
/55!
%" "-
#/55! %" "-
#/5#!
-"( /5#!
-( )"
))
)- #% /5% '/.#+5
6" "-
" "")(1
) !% ##% '!/
6
)-(-
1 2)-)(1
) ,% +% ',.#
" )-(0-
" +% % '##
( )$"(--
" 2("0)
.% #% ,.+#
"( -
" % /% .+5
0-0(
+% % .5
-()(1
)3$-$0
)-(-
" ,% % .5
- 0(-(
4 )0)" $
"4 - )*
0)$(
1-
"
"1( -)--"1( - (
"1( - $
"4 -
6
4)
)46("0
" "
)-
-0-
In the last decade, the most significant shift in the 2009 to 2019. Transportation and Warehousing saw
employment profile in Contra Costa is an increased the largest decrease, falling from 3% of the countywide
concentration of jobs in the largest sector, Health Care employment in 2009 to less than 1% in 2019, with a
and Social Assistance, which grew by 23,170 jobs from total reduction of 6,300 jobs.
! *&!'*
#
!0
* *0 -&
!
,1"1,1"
"$
!'*&''
! -
#
!0
*&*'
,1"1
",$
&0'-&
! /
**
'*
-
#
!0
*
'*! *&!'**"+%"$
"1$ *
!/'*
!-*/'*! *&!'**(%,$%
*'.'
*!*/ ,$ +$
$ !- *0/
,1" %
)$
$
,$
1$
,1"1 ,1"" ,1", ,1"+ ,1" ,1" ,1") ,1"( ,1" ,1"
*&
'* !-*/'* '*
!* * &#&' *' - -
#
!0
*0&%
*
!&
#
!0
*.
!#
*#&*
*
2
0 '
' 02&!-
! !
'*
*-*
11Bay Area Council Economic Institute
While the makeup of the top sectors is not uniform those two counties in comparison to Contra Costa. An
across the county, unemployment rates have largely analysis of the wages in two most common destinations
converged among the sub-regions. Countywide, the for Contra Costa out-commuters, Alameda and San
unemployment rate in June 2019 was 3.2%, below the Francisco, shows that Health Care is the only sector
statewide unemployment rate of 4.2% and on par with where Contra Costa has higher average weekly wages.
other counties in the region such as Alameda (3.1%) and This is a draw for Contra Costa residents to seek work
San Francisco (2.3%). outside the county, necessitating they trust in a reliable
transportation system as they travel longer distances to
On top of the nominally higher number of jobs in San
seek higher paying jobs.
Francisco and Alameda, higher wages are seen in
Average Weekly Wages: Contra Costa Versus Top
Destinations for Out-commuters
$7,000
&! $
$6,000
$
#
#
$5,000
&
!
$4,000
$3,000
$2,000
$1,000
$0
Health Care and Retail Trade Accommodation Construction Professional and Administrative and Finance and
Social Assistance and Food Services Technical Services Waste Services Insurance
Contra Costa Alameda San Francisco
!
$
!
$
% "
#
" $
& $
$&
!
!
Jobs-housing imbalance, mode share, and fewer bike and pedestrian commuters, both reveal
commute flows opportunities for investment to make these more
attractive options for commuters. Commute flows
Several key metrics measuring the pressure on the show growth in the number of people relying on the
Contra Costa transportation system find that daily use Contra Costa transportation system daily, necessitating
of the system is growing, and a regional imbalance innovative investments to limit congestion. These
of where jobs and housing are located limits pressure conditions point to a need for investment in congestion
from being alleviated. The balance between housing, management technologies and additional commute
jobs, and employed residents shows insufficient jobs options, both of which are planned investments in the
located within the county for the size of the workforce TEP.
housed in Contra Costa. Mode share and commuting
trends illuminate lower use of local transit ridership
12The Economic Impacts of Transportation Investments
Ratio of jobs to housing Ratio of jobs to employed residents
The ratio of jobs to housing provides insight into the The ratio of jobs to employed residents shows the
balance between the number of people living in an area mismatch between jobs in the county and the size of the
and working in an area. A healthy balance is around 1.5, employed population in Contra Costa.
one full-time and one part-time jobs per housing unit.8
If the ratio is too low it indicates inadequate availability Contra Costa has 0.67 jobs for every employed
of jobs for the number of residents, if too high it resident. This is lower than San Francisco that has
indicates inadequate housing for the number of jobs. 1.49 jobs per employed resident and Alameda,
which has 0.93 jobs per employed resident.
Within Contra Costa County the jobs-housing ratio
is low at 1.03, indicating an inadequate number of The most extreme mismatch between jobs and
locally available jobs to match the available housing. employed residents is in East Contra Costa in cities
such as Oakley, Clayton, and Brentwood.
Neighboring Alameda County has a jobs-housing
ratio closer to what is considered healthy at 1.21 Higher ratios are seen in Southwest and Central
and San Francisco County has a housing-jobs ratio Contra Costa such as Walnut Creek, Pleasant Hill,
of 2.06, indicating insufficient housing for jobs San Ramon.
levels. In 2010, Contra Costa had 97,404 more employed
The imbalance is more extreme in East Contra Costa residents that it did jobs within the county, this
cities such as Brentwood, Clayton, and Antioch. discrepancy has grown reaching 194,844 in 2018.
Parts of the county have healthier balances such as
San Ramon, Walnut Creek, and Danville.
13Bay Area Council Economic Institute
Jobs-Housing and Jobs-Employed Resident Ratios by City and County
Jobs Housing Jobs Employed Jobs Housing Jobs Employed
Geography
Ratio 2018 Residents Ratio 2018 Ratio 2010 Residents Ratio 2010
Antioch 0.67 0.41 0.59 0.48
Brentwood 0.44 0.40 0.44 0.41
Clayton 0.54 0.33 0.35 0.32
Concord 0.99 0.63 0.92 0.74
Danville 1.24 0.76 1.05 0.91
El Cerrito 0.64 0.46 0.55 0.53
Hercules 0.58 0.35 0.49 0.36
Lafayette 1.19 0.78 1.08 1.00
Martinez 1.28 0.83 1.14 1.00
Moraga 1.04 0.70 0.94 0.91
Oakley 0.44 0.26 0.33 0.26
Orinda 0.85 0.58 0.76 0.71
Pinole 1.15 0.78 0.99 0.87
Pittsburg 0.90 0.54 0.74 0.57
Pleasant Hill 1.65 1.14 1.40 1.25
Richmond 1.16 0.74 0.98 0.80
San Pablo 0.76 0.54 0.63 0.51
San Ramon 1.82 1.09 1.73 1.35
Walnut Creek 1.58 1.24 1.41 1.48
All Contra Costa 1.03 0.67 0.92 0.78
San Francisco County 2.06 1.49 1.37 1.65
Alameda County 1.21 0.93 1.06 0.99
Data: Department of Finance 1/1/2019; Contra Costa Transportation Authority; Association of Bay Area Governments 2017
Analysis: Bay Area Council Economic Institute
These imbalances between jobs, housing, and the size of the workforce within the county
shows why
These imbalances commuting
between out of the
jobs, housing, county
and the is a part and
of daily
jobslife
arefor many Contra
imbalanced on aCosta
regional scale, resulting
size of the residents.
workforce Furthermore, the ranging
within the county shows why ratios across the Bay Area
in longer show that
commutes. housing
This and necessitates
imbalance jobs
are imbalanced on a regional scale, resulting
commuting out of the county is a part of daily life for in longer commutes. This imbalance necessitates
continued focus on the Contra Costa County
many Contra continued focus on
Costa County the Contra
residents. Costa transportation
Furthermore, the network to keep
transportation commuters
network daily travel daily travel
to keep commuters’
timeacross
ranging ratios at a minimum.
the Bay Area show that housing times at a minimum.
10
14INSIGHT
Bishop Ranch Business Center
Employment hub in Contra Costa, transportation accessibility
key to its success.
Bishop Ranch is a 585-acre mixed-use business park up within Bishop Ranch before heading to BART, having
in San Ramon. On top of office space, Bishop Ranch a larger fleet of automated feeder shuttles would allow
features a shopping center, dining options, and other each bus to go directly to BART after loading passengers
lifestyle amenities. With 30,000 employees, Bishop at a single location, cutting down commute times and
Ranch hosts 59% of San Ramon’s jobs, and 7% of making transit a more attractive option.9
Contra Costa County’s jobs. Bishop Ranch has a holistic
transportation strategy, including direct connections to Transportation access is a key factor in business location
BART and ACE in coordination with County Connection, decisions, and the comprehensive transportation
shuttles from San Francisco, a bike share program on strategy is an element of the continued popularity
campus, and subsidized carpooling. of Bishop Ranch. Transportation, along with regional
benefits such as housing and regional talent, is one
Bishop Ranch has also invested in autonomous shuttles, of the top amenities highlighted by Bishop Ranch to
which started operating in 2018. Their hope is to grow prospective tenants. Investing in better connections
these shuttles to a fleet of nearly 100 to make last mile to transit countywide can help make other business
connections from the business park more efficient. locations in the county similarly attractive to companies
Instead of buses that spend 15 minutes picking people choosing where to locate in the Bay Area.
Bishop Ranch Business Park in San Ramon
15Francisco County. However, Contra Costa residents spend more time and travel longer
distances to get to their place of work:
• 43% of employed Contra Costa residents work outside of the county, in comparison
Bay Area Council Economic Institute
to neighboring Alameda County (35%) and San Francisco County (24%).
• Regional commutes are becoming more common among Contra Costa residents, the
Mode share number of commuters
and commute traveling
patterns in outside of theThecounty
averageincreased
commuteby 27.6%
time fromCosta
in Contra 2010in 2017
was 37.1 minutes. 11
This means the average Contra
Contra Costa to 2017,
Countywhile the number of commuters employed within Contra Costa County only
Costa commuter spends the equivalent of 13.4 days
Contra Costagrew
County byis10.8%
home to from 2010employed
538,126 to 2017. annually getting to work. This number is higher
37,960
• slightly
residents, (7.8%)
higher thanofSanthe ContraCounty.
Francisco Costa workforce than
travels over Contra
average. 90 minutes
Costa to get to work,
commuters spend
the highest share of any county in the Bay Area
However, Contra Costa residents spend more time and theand the third
equivalent of 3highest in commuting
more days the state. The
than
travel longer distances to get to their place of work:
number of residents bearing these 90+ minute commutes has increased 102% since
the average Californian, with a statewide average
commute time of 29.8 minutes, or 10.8 days.
2009.ix Contra Costa residents work
43% of employed
• of
outside The
theaverage
county, incommute
comparison time in Contra Costa
to neighboring in 2017
Mode wastrends
share 37.1 minutes.
in Contra
x
This means
Costa the
County
Alamedaaverage Contra
County (35%) andCosta commuter
San Francisco spends the equivalent of 13.4 days annually getting
County
(24%).
to work. This number is higher than average, The majority of Contra Costa residents drive alone
Contra Costa commuters spend the
to work, but the share of single occupancy car
Regionalequivalent
commutes are of becoming
3 more days morecommuting
common than the average decreased
commuters Californian, with from
by 1.7% a statewide
2010 to 2017.
average
among Contra commute
Costa residents.time
The of 29.8 of
number minutes, or 10.8 days.
commuters traveling outside of the county increased Working from home is becoming more popular in
by 27.6% from 2010 to 2017, while the number of Contra Costa, increasing by 1.2% since 2010, a shift
Mode share trends in Contra Costa County
commuters employed within Contra Costa County resulting from 11,870 more people working from
• The majority of Contra Costa
only grew by 10.8% from 2010 to 2017. residents drive alone
home. to work but the share of single
occupancy car commuters decreased by 1.7% from 2010 to 2017.
37,960 (7.8%) of the Contra Costa workforce travels There was a 1.6% increase in transit mode share
• Working from home is becoming more popular in Contra Costa, increasing by 1.2%
over 90 minutes for work, the highest share of from 2010 to 2017, representing 15,917 more
sincecounty
any Bay Area 2010,anda shift resulting
the third from
highest 11,870 moretransit
in the people working from home.
riders. This increase in residents choosing
The 1.6%
state.• Residents withincrease
these 90+inminute
transitcommutes
mode share fromtransit
2010 shows
to 2017, representing
an appetite for more 15,917
transit more
commute
transit102%
have increased riders. This
since increase in residents choosing
2009. 10
transit shows an appetite for more
options.
transit commute options.
Contra Costa Mode Share
Total Employed Work from
Year Drive Alone Transit Carpool Bike / Ped
Residents Home
2017 538,126 67.6% 11.0% 11.9% 7.6% 1.9%
2010 458,169 69.3% 9.4% 12.7% 6.4% 2.3%
Change 2010 - 2017 79,957 -1.7% +1.6% -0.8% +1.2% -0.4%
Data: American Community Survey 1-year estimates 2010, 2017
Analysis: Bay Area Council Economic Institute
11
16The Economic Impacts of Transportation Investments
Mode share in Contra Costa County vs. other Bay Area counties
Mode •share Contra Costa has
in Contra comparatively
Costa County vs.lower rates ofContra transitCosta
use. also
The has
higher usage
a lower shareofoftransit
individuals
other BayinAreaothercounties
counties reveals a prospect of increased whotransit
bike orridership
walk to work.
amongThe lower
Contra share of
Costa
bicycle and pedestrian commuters in Contra
residents
Contra Costa to match other
has comparatively level
lower ratesso
oftransit use in Costa
the region through investments making
is another prospect for shifting mode share.
transit
transit use. The ahigher
moreusage
convenient
of transitoption.
in other The strategic investment in bike and pedestrian
• Contra
counties reveals Costa alsoofhas
a prospect a lowertransit
increased share of individuals who bikeplanned
infrastructure or walkin to
thework. The encourage
TEP could lower
ridershipshare
amongof bicycle and pedestrian commuters in Contra
Contra Costa residents to match more localCosta is another
commuters prospect
to choose for form of
an active
higher levels of transit use in the region through
shifting mode share. The strategic investment in bike and pedestrian infrastructure
transportation to get to work.
investments making transit a more convenient
option. planned in the CCTA TEP could encourage more local commuters to choose an active
form of transportation to get to work.
Bay Area Mode Share Comparison, 2017
Total Employed Work from
Drive Alone Transit Carpool Bike / Ped
Residents Home
Contra Costa 538,126 67.6% 11.0% 11.9% 7.6% 1.9%
Alameda 766,065 61.5% 16.0% 10.3% 6.2% 6.0%
San Francisco 496,450 34.2% 36.7% 6.4% 7.6% 15.1%
Bay Area 3,813,764 64.9% 12.8% 10.5% 6.5% 5.3%
Data: American Community Survey 1-year estimates 2017
Analysis: Bay Area Council Economic Institute
Commute pattern trends
• Excluding
Commute those who work from home, over 650,000
Pattern Trends dailylocal
choice than commuters take tripslocal
transit, pinpointing thattransit
rely on routes that either pass through, end, begin, or are
as an area for completely
improvement.withinThe TEPContra
reflects this
Excluding those who work from home, over 650,000
Costa. opportunity with a 38% of the investments allocated
daily commuters take trips that rely on routes that to fund local transit.
Transit
• pass
either is the
through, commute
end, begin, ormode for 22.8% of commuters
are completely leaving Contra Costa and only
2% ofCosta.
within Contra commuters within the county. This suggests Over regional transit
the past seven suchthrough
years, as BART, is a grew
commuters
more common mode choice than local transit, faster pinpointing
than anylocal
othertransit
group as an area
relying forContra
on the
Transit is the commute mode for 22.8% of
improvement. The TEP reflects this opportunity withtransportation
Costa a 38% of thesystem,
investments
increasing by 54.5%
commuters leaving Contra Costa and only 2% of compared to a 27.6% increase in out-commuters
commutersallocated to fund
within the local
county. Thistransit.
suggests regional and a 10.8% increase in those working and living in
Over
• such
transit asthe past
BART, is aseven years through
more common mode commutersContra
grew Costa.
faster than any other group
relying on the Contra Costa transportation system, increasing by 54.5% compared to a
27.6% increase in out-commuters and a 10.8% increase in those working and living in
Contra Costa.
17
12Bay Area Council Economic Institute
Mode Share by Type of Commuter, 2017
Increase Work from
Total Drive Alone Transit Carpool Bike / Ped
2010-2017 Home
Out-commuters 231,320 +27.6% 65.0% 22.8% 11.7% – 0.5%
Live and work in
306,806 +10.8% 69.6% 2.0% 12.1% 13.4% 2.9%
Contra Costa
In-commuters 97,642 +26.6% 81.2% 5.9% 11.9% – 0.9%
Through
59,611 +54.5% 68.4% 11.9% 18.4% – 1.2%
commuters
Total 695,429 +21.2% 69.6% 10.3% 12.5% 5.9% 1.7%
Data: American Community Survey 1-year estimates 2017
Analysis: Bay Area Council Economic Institute
Higher growth in
Daily Commuters Relying on Contra Costa through and out-
Transportation System
Daily Commuters with 2010-2017
Relying Increase
on Contra Costa commuters is
Higher growth
in through and
evidence that the
Transportation System with 2010-2017 Increase out-commuters is
regional jobs-housing
evidence that the
Sutter
Yuba
Placer
imbalance
regionalis jobs-housing
putting
moreimbalance
people on the
is putting
52,800Yuba
+38%
Sutter
Through-
Placer roadsmore
in Contra
people Costa,
on
the roads in Contra
necessitating
Yolo commuter El
Napa
52,800 Dorado
Costa, necessitating
Sonoma +38%
Through-
Sacramento
investments
investments to to
Yolo commuter
manage congestion.
Solano El
Dorado
manage congestion.
Napa Live & work
Marin
Sonoma 265,800
231,300 +7% Solano
Sacramento
In-commuter
+28%
Out-commuter Contra
LiveCosta
& work 97,600
265,800
San
Marin +27% Joaquin
231,300
San Francisco +7% In-commuter Stanislaus
Total +28% Alameda
Out-commuter 6,800
Contra Costa 97,600
Through-commuters, in-commuters,
650,000 San Mateo
+33% +27% San
out-commuter,
Joaquin and those who live
+20% Through-
commuter and work in Contra
Merced
Costa total over
San Francisco
Stanislaus
Santa
Alameda 650,000 and all use the county’s
Total Clara
Through-commuters,
transportation system daily.in-commuters,
Santa
6,800
650,000
Cruz
San Mateo
+33% out-commuter, and those who live
+20%
Data Source: American Community Survey 1-year Estimates 2010, 2017
Analysis: Bay Area Council Economic Institute Through-
commuter and work in Contra
Merced
Costa total over
Monterey Santa San Benito 650,000 and all use the county’s
For 300,000+ residents who live andClara work in Contra Costa County, few live
in the same city
Santa transportation system daily.
where they work. Even cities with the highest number of jobs have low percentages of their
Cruz
total workforce residing in the same city:
Data Source: American Community Survey 1-year Estimates 2010, 2017
Analysis: Bay Area Council Economic Institute
• San Ramon has the largest Monterey
number San
ofBenito
jobs, but only has 12% of their workforce living
in San Ramon.
• Walnut Creek, the second largest job center, has only 7% of their workforce living in
the city.
18
13The Economic Impacts of Transportation Investments
For 300,000+ residents who live and work in Contra Richmond and Antioch, with third and fourth largest
Costa County, few live in the same city where they work. share of jobs, both have 15% of their workforce as
Even cities with the highest number of jobs have low residents.
percentages of their total workforce residing in the same
city: These low percentages reveal that even among those
who live and work in Contra Costa, many rely on the
• Richmond and Antioch, with third and fourth
San Ramon has the largest number of jobs, but only largest share
transportation networkof
tojobs, both
traverse have 15%
the county of
for their
has 12% of their workforce living in San Ramon. daily commute. This exemplifies the benefit that all
their workforce as residents.
residents gain from investment in the system across the
These low
Walnut percentages
Creek, the second revel
largestthat even has
job center, among those
countywho
evenlive and
if they work
work inthe
within Contra
county.Costa,
many rely on the transportation network to traverse the county for their daily commute. This
only 7% of their workforce living in the city.
exemplifies the benefit that all residents gain from investment in the system across the
county even if they work within the county.
Share of workforce employed and housed in the same city
Top 10 cities by number of jobs Jobs 2018 Percent of workforce residing in City
San Ramon 50,657 12%
Walnut Creek 49,665 7%
Concord 43,870 15%
Richmond 42,306 15%
Antioch 22,854 23%
Pleasant Hill 22,648 5%
Danville 19,472 11%
Pittsburg 18,926 18%
Martinez 18,556 9%
Data: Contra Costa Transportation Authority; Association of Bay Area Governments 2017; Longitudinal Employer-Household
Dynamics, 2017
Analysis: Bay Area Council Economic Institute
v. Chapter 3: Performance of the county’s transit and highway networks
The performance of the transportation system in Contra Costa County reveals key
opportunities for strategic investment. Projects that capitalize on these opportunities are
reflected in the projects that CCTA’s TEP plans to fund. Each of the following opportunities
were identified thought analysis of metrics measuring the performance of the transportation
system and are described in more detail in this chapter:
• Lower transit use in Contra Costa, including lower per capita usage and declining local
transit ridership shows a prospect for investments that enhance transit connectivity
making it a more attractive option.
• The success of new transit services demonstrates an appetite among residents for
more transit options.
19
• Upward trend in highway congestion by route show corridors worthy of investment in
innovative traffic solutions.
• Rising roadway collisions resulting in injuries and fatalities, in the past three years3
Performance of the County’s Transit and
Highway Networks
The performance of the transportation system in BART operates three lines in the county and carries
Contra Costa County reveals key opportunities for the most passengers annually in Contra Costa. The
strategic investment. Projects that capitalize on these three lines connect Richmond to Warm Springs,
opportunities are reflected in the projects that the Richmond to Millbrae, and Antioch to SFO.
TEP plans to fund. Each of the following opportunities
were identified through analysis of metrics measuring AC Transit operates 15 routes with stops in Western
the performance of the transportation system and are Contra Costa, three of which offer transbay service
described in more detail in this chapter: into San Francisco.
Lower transit use in Contra Costa, including lower Tri Delta Transit serves East Contra Costa with 15
per capita usage and declining local transit ridership local bus routes.
shows a prospect for investments that enhance WestCAT runs 12 local routes, and one transbay bus
transit connectivity. in Western Contra Costa.
The success of new transit services demonstrates an County Connection has 33 weekday and 7 weekend
appetite among residents for more transit options. routes in Central Contra Costa.
Upward trends in highway congestion by route show Per capita transit ridership in Contra Costa is lower
corridors worthy of investments in innovative traffic than transit ridership on a regional scale. In 2016, there
solutions. were 24.7 total annual weekday boardings per capita
Rising roadway collisions resulting in injuries and in Contra Costa County while the Bay Area saw 60.2
fatalities over the past three years shows need for weekday boardings per capita in the same year. Per
investment in features enhancing safety on Contra capita ridership in both Contra Costa and the Bay Area
Costa roadways. are relatively stable, but the much higher use seen at
the regional level shows there is an opportunity to grow
ridership in Contra Costa County if strategic investments
Countywide transit ridership are made to improve the transit system in the county.
There are five major transit providers in Contra Costa
offering service in the county. Four bus agencies offer
service to the subregions of the county, and Bay Area
Rapid Transit (BART) serves all four:
20The Economic Impacts of Transportation Investments
)
1
,
/ $
%) $
% $")
)$ %) ,
)/-%#/1$
'0#0
'# #' #' (0#0 # (0#+
(0#0
0#0
0#0
*0#0 +# +# +#'
++# +*#* +#+
+0#0
!0#0
0#0
+0!! +0!+ +0!* +0! +0! +0!(
/ 1$
)$ %)
)
)$ %) ,
)/)$
%)
,
$%$
) ,
/ $" $) /$)$ , ,
.
/$#
) )$ "
)
$
%" $))
%%
&
$
"$)
)
& $
) $
%)& %)1 & 1
$
%)& )
$
%))%
1
/ %% /1$ ,
%)),)
95+ 74,
+,
&7
9"7 5+
!6
1
+"1
"
3888
%*.)
#*)
38888
%888 3*3)
2*#)
%8888
*)
*3)
888
2*%)
2*2)
8
%0%/ %/0%. %.0%
9 +",
1' $41,$!& 1 7$+&+1 76
1
"$"1+$,1( ,19 $4"17$""1
$" +
1 +",
1
$1 $4"17$""1
$", +&+,"1 "+7+,38%
38%.41$+&$+1
"
+",- +&+,"1, 4 7$
+,17+1$4"$,$" 7+*
1 +
1 +",
1-,19 - 9 +",
1- 1
$" +",
11,
9" 7 ,
, 7 9+$4"
$"$!
",1
141
21Bay Area Council Economic Institute
Average weekday ridership across all five major The agency with the largest decrease in ridership
agencies grew by 15% in Contra Costa County from between FY15/16 and FY17/18 was Tri Delta Transit with
FY10/11 to FY14/15, but in recent years that growth a 12.4% decrease, followed by AC Transit (-10.9%) and
has been reversed, with a 6% decrease in countywide WestCAT (-6.3%). County Connection was less impacted
average weekday ridership from FY15/16 to FY17/18. with a loss of only 0.3%.
This decrease in ridership over the past three years was
felt across all transit agencies in the county with bus
ridership experiencing the sharpest decline.
*%3.
#72*
57 4 .+ #%#.*%+.
2+) 5+." 1.+ %#.*%+.
66666
/6666
/66666
06666
.3#&$$$ #06&$2*
066666 3 54 .+ #*+50-( #
%#.*%+.#50(*%++.
&6666
*+.%.
7 +5+.")
&66666
6666
$$
66
6&
60
6/
6
6
6-
6,
6
6$
&6
&&
&0
&/
&
&
&-
&,
&
&$
%#.*%+.7 .. %#+ 7 5+."4!1 #
%#.*%+.
%. *'*+#.+ 1!5 %'*2 %1+ 5*.% 1#%*'%*. 5*)
. 7 06&$
7# !5 + + 57*%1# ! %#%" #+. .1.
A total of 15.1 million BART trips ended in Contra Costa with a 3.3% decrease from FY15/16 to FY17/18. BART
in FY19, 13% of total systemwide trips. The stations ridership in Contra Costa also weathered the recent
with the highest ridership in Contra Costa are El Cerrito regional trend in ridership decline better than the rest
Del Norte, in West Contra Costa, and Pleasant Hill and of the system. From FY16 to FY19, ridership in Contra
Walnut Creek in Central Contra Costa. Costa declined by 4% while the rest of the system
ridership shrunk by 5%.
BART ridership has followed the same declining trend in
ridership seen on local bus ridership, though the decline
has been less extreme than most local bus agencies,
22The Economic Impacts of Transportation Investments
Adoption of new transit options The parking lot use at Antioch, the new last stop station,
is another testament to the success of eBART. The
The two new eBART stations that opened in Contra station opened with capacity for just over 1,000 cars,
Costa County in May of 2018 have shown stable six months into operation BART announced a plan to
ridership numbers in their first year of operation at add an additional 800 spots due to the consistently full
about 90,000 total monthly exits across the two stations. parking lots commuters were experiencing by 6 a.m. on
The successful adoption of use seen and sustained at weekdays.12 The funding for additional parking capacity
these two stations shows an appetite for more regional at the Antioch station is coming from the existing CCTA
transit options among Contra Costa residents. Measure J sales tax, an example of how local funding
is key for the ability to act promptly on necessary
improvements to the transportation system.
4 %,! 2 %#,
!2,, %#1 ,)
#(0 %""#
*3333
+3333
3333
3333
-3333
.3333
&3333
!2
!2
2
2
(
(
(
,
!
,
#
#
2
(
/)
/)
(
'(
(
/
/
%
(
/
/
/
/
(/
#/
4
"
"
"
&$
.3
&$
,
&$
,
&
&$
4
4
%0
&$
'
&$
.3
&$
&$
&$
&$
&$
&$
4#, %
,,)/(
#,(
, 4 .3&$
4# !2 ) ) 24(%/# ! %#%" #), ,/,
23Bay Area Council Economic Institute
!
&&
&&
&&
&&
&&
"&&
#&&
&&
&
'
%
! '
' %
%'
$
!!$!
The new Richmond ferry connecting Marina Bay in passengers. This service would not exist without the
Richmond to the San Francisco Ferry Building has local sales tax dollars generated by the current sales tax
outperformed ridership projections since it began measure. For continued investment in varied commute
running in January of 2019. While operated by the San options such the Richmond ferry, the county needs
Francisco Bay Area Water Emergency Transportation continued generation of local funds.
Authority (WETA), the operating funds invested in this
new line came from the existing CCTA Measure J sales Highways: Congested corridors and top
tax. WETA projected 480 daily boardings for the new bottlenecks in Contra Costa County
service, but ridership climbed well above that in the first
month of operation with 635 daily boardings in January Contra Costa residents, visitors, and those traveling
2019.13 through the county lose millions of hours to congestion
every year. A total of 5.4 million vehicle hours of delay
Ridership continued to grow in the first five months (VHD) were recorded on freeways in the county in 2018,
of operation, a trend that shows interest in alternative the equivalent of 4.72 hours per capita.14 Four of the
commute options among Contra Costa residents. Under 10 most congested corridors in the Bay Area as ranked
current conditions with capacity of 445 passengers per by Metropolitan Transportation Commission (MTC)
trip and a schedule offering four ferries during morning are completely or partly within Contra Costa County,
commute hours and two during PM commute hours, displaying a clear need for investment in congestion
the route has the capacity to grow up to 2,670 daily relief strategies planned for in the TEP.
24The Economic Impacts of Transportation Investments
&+.&$
+.&** &*+ $&$.*&+.&1$.5
&$" 82*
"5
"
&1. &. &$ *. &$ $
.
$! &1*+&"5
*1"+.&5*
&""
0 '0-7 7 +.&1$ ',)#
"6
-'7 8
*. $6.& ..+1*
+.&1$ -)'#
%
07 8 0
!"$.& * $ +.&1$ )'#
'7
77 -7 $2 "".&"$1.*! &*.
&1$ '7)#
''
77 8
8$. &
.&&$&* +.&1$ ,)#
07 0/7 7 $&".&
#&$ +.&1$ %)0#
&. #+($. $&$
+. &$ + $+.
2*
"5
&1*++($. $&$
+. &$&$1+5+$+5+$
1*+5+1* $
(!.* #&$.
+&$*35 " . +)&$
+."5 + $. 5+.. $
.
*+
&"&
&$+ +.$."5
*.*.
$'# $1.+&$+( *35+
#$.*
"+(+"++.
$/#(
)
. .*&(&" .$*$+(&*.. &$&## ++ &$07',
8$"5+ +58*&1$ "&$&# $+. .1.
When measured against neighboring Solano and that investment in Contra Costa up to this point from
Alameda county, controlled for the number of lane miles local tax measure funding, such as the express lanes
contained in each county, Contra Costa falls between on I-680, have helped keep congestion lower than
the two with 7,600 VHD per lane mile in 2018 compared Alameda, but there is still room for further relief.
to 5,400 in Solano and 13,000 in Alameda. This shows
!.'(!
2#'
"333
"-333
"3333
333
*333
333
-333
3
-3"3 -3"" -3"- -3", -3" -3" -3"* -3") -3"
4
!. +2 !
!!. +2 ! +'!(+!. +2
!+
!.'( !
2$% (.'(. (.#+1+'+
++ /
((# ! +'02( '
+
/+! 0++20!.
(# +'/
+
(+ ' '
!0 (# !*3 #& (# +'(!
, #&
+
!'
#'+ + ! ' (#!'++
! $
+' (% '!' (.' + 2(+ $ %
4
2 (
( 24'!.
! !
(+
+.+
25Bay Area Council Economic Institute
Percent of Total Vehicle Hours of Delay by Freeway
in Contra Costa 2018
Existing Express SR242-N
I580-W
3 .5 %
I580-E
2 .2 % SR160-N
0 .6 %
Lanes
4 .7 %
SR24-W
4 .8 %
SR24-E
2 1 .2 %
The Bay Area Express Lane network is a I80-W
7 .2 %
coordination of Bay Area transportation
agencies to develop 600 miles of express lanes I680-S I680-N
8 .7 % 1 4 .7 %
in the Bay Area by 2035. The MTC Express
Lane program will operate 270 miles of express
SR4-E
lanes. The first MTC-operated section was 9 .6 %
I80-E
opened in Contra Costa on I-680 connecting SR4-W 1 2 .8 %
1 0 .1 %
San Ramon, Danville and Alamo opened in
Data: PeMS
October 2017. The section includes 23 express Analysis: Bay Area Council Economic Institute
lane miles in Southwest Contra Costa.
These performance metrics show that express The freeways bearing the largest share of the
lanes are a successful tactic to take advantage countywide VHD are routes that connect the most
of unused capacity in high-occupancy vehicle populous cities to job hubs. Parallels can be drawn
(HOV) lanes without inhibiting the benefit between the most congested routes, the commute
of faster speeds for carpoolers and clean air flows, and the job and population density in the county:
vehicles: SR-24 westbound, SR-4 westbound and I-80
westbound all support commuters traveling through
Peak hour travel speeds in the express
and from Contra Costa into Alameda and San
lanes averaged 10 mph faster northbound
Francisco counties and together account for 22% of
and 11 mph faster southbound than the
the total VHD in the county.
general-purpose lanes in Q2 2019.
The reverse or evening commute routes carrying
Share of toll-free carpools and clean air people from San Francisco and Alameda to Contra
vehicles has increased, rising from 37% in Costa, including SR-24 eastbound, SR-4 eastbound,
June 2018 to 41% in June 2019. and I-80 eastbound, account for 43.6% of total
VHD.
Toll costs saw an average increase of
$2.40 year-over-year in Q1 2019. Higher As the main route connecting San Ramon, the city
tolls were a result of an algorithm that with the most jobs in Contra Costa, to Concord, the
proactively managed demand in 2019 to most populous city in Contra Costa, both directions
prevent the lanes from slowing. of travel on I-680 together account for 23% of the
countywide VHD.
The TEP plans for continued investment in strategies
along these corridors to alleviate the growing VHD in
the county.
26INSIGHT
Transportation Finance Trends
receive $31.1 million per year to maintain local streets
The case for local funding. and roads. The Contra Costa Transportation Authority
In FY18/19, transportation spending in California is only guaranteed $2.4 million per year through the
totaled $35 billion.15 Just under half of this was funded Local Partnership Program, and must compete for any
through local sources, while about a third came from the additional SB1 funding.
state, and the remaining from the federal government.
Nationwide, public spending on transportation and Regional Funding
water infrastructure across federal, state, and local
Approved by Bay Area voters in 2018, Regional Measure
sources as a share of GDP hit a six-decade low in
3 (RM 3) will generate $4.45 billion by 2035 from three
2017 at 2.28 percent16 —showing that as the economy
$1 toll increases in 2019, 2022, and 2025. These funds
expands, infrastructure spending has not kept up.
will go towards highway and transit improvements
Examining where the lesser investments were felt
across the Bay Area to relieve congestion. However,
between 2007 and 2017 reveals capital investments
only $360 million out of the $4.45 billion is allocated to
plummeted by 16%, while infrastructure operation
fund projects in Contra Costa.
and maintenance actually rose by 9.5%.17 This shows
infrastructure is becoming more expensive to maintain,
which is limiting the funds available for new investments.
/0 ( )
+ (" $
0 .
"
".( +,11
,1#,
#11%
Federal Funding #!% ,1%
1% 1%
The federal government’s main source of transportation
funding, the highway trust fund (HTF) has funding *1%
issues.18 The majority of the HTF funding dollars (85-
1% #% 1%
90%) come from an excise tax on gas and diesel. This
*1%
source has become less reliable due to improving fuel ,1%
efficiency and modest growth in vehicle mileage, and as
a result, HTF spending exceeds its revenue. Congress 1%
(
++ "
has made up for this with transfers from the general
/0 ( )
+
fund, most recently in 2015, but a report from the + (
+
(-)+ & & )-)-(-')2 -
-(.0" ++
"
".( +
)
2
0 )
) 02("-
" "
)+
+-+
Congressional Research Service predicts HTF account
balances will reach zero sometime during FY2021 if the
current sources of funding remain unchanged. The nationwide trend of less funding for capital projects
and higher operating and maintenance costs shows
the important role that local sales tax dollars play
State Funding in supporting the modernization and expansion of
In 2017, the California legislature enacted a transportation infrastructure in the county. The smaller
transportation funding package, known as Senate share of federal and state dollars allocated for transit
Bill 1 (SB1) that is estimated to increase annual state shows that local funding is necessary to grow transit
revenues for the California transportation system by an options. Additionally, the uncertainty of the allocation
average of $5.2 billion per year over the next decade, of federal, state, and regional dollars emphasizes the
through phased in tax and fee rate increases.19 As part need for a consistent local revenue source to ensure
of SB1, local cities and towns in Contra Costa directly sufficient funds to operate and improve the Contra
Costa transportation system.
27You can also read