The Economics behind the Epidemic: Afghan Opium Price and Prescription Opioids in the US - IZA DP No. 12872 DECEMBER 2019 - IZA ...
←
→
Page content transcription
If your browser does not render page correctly, please read the page content below
DISCUSSION PAPER SERIES

IZA DP No. 12872

The Economics behind the Epidemic:
Afghan Opium Price and Prescription
Opioids in the US

Claudio Deiana
Ludovica Giua
Roberto Nisticò

DECEMBER 2019
DISCUSSION PAPER SERIES

IZA DP No. 12872

The Economics behind the Epidemic:
Afghan Opium Price and Prescription
Opioids in the US

Claudio Deiana
University of Cagliari and University of Essex
Ludovica Giua
DG Joint Research Centre, European Commission
Roberto Nisticò
University of Naples Federico II, CSEF and IZA

DECEMBER 2019

Any opinions expressed in this paper are those of the author(s) and not those of IZA. Research published in this series may
include views on policy, but IZA takes no institutional policy positions. The IZA research network is committed to the IZA
Guiding Principles of Research Integrity.
The IZA Institute of Labor Economics is an independent economic research institute that conducts research in labor economics
and offers evidence-based policy advice on labor market issues. Supported by the Deutsche Post Foundation, IZA runs the
world’s largest network of economists, whose research aims to provide answers to the global labor market challenges of our
time. Our key objective is to build bridges between academic research, policymakers and society.
IZA Discussion Papers often represent preliminary work and are circulated to encourage discussion. Citation of such a paper
should account for its provisional character. A revised version may be available directly from the author.

                                                     ISSN: 2365-9793

                                           IZA – Institute of Labor Economics
Schaumburg-Lippe-Straße 5–9                      Phone: +49-228-3894-0
53113 Bonn, Germany                             Email: publications@iza.org                                    www.iza.org
IZA DP No. 12872 DECEMBER 2019
ABSTRACT
The Economics behind the Epidemic:
Afghan Opium Price and Prescription
Opioids in the US*
We investigate the effect of variations in the price of opium in Afghanistan on per capita
dispensation of prescription opioids in the US. Quarterly county-level data for 2003-2016
indicate that reductions in opium prices significantly increase the quantity of opioids
prescribed. The increase involves natural and semi-synthetic but not fully synthetics opioids,
therefore suggesting that the effect is moderated by the amount of opium contained in
the products. While this evidence could suggest a pass-through of lower production costs
to retail prices, boosting patients’ demand for opioids, we fail to detect significant effects
of changes in retail prices on per capita dispensation. Moreover, firm-level analysis reveals
that advertising expenses of opioid producers increase following opium price declines and
so do their stock prices and profits. Overall, our findings suggest that supply-side economic
incentives might have played an important role in the opioid epidemic.
JEL Classification: I11, I12, I18, L65
Keywords: prescription opioids, drugs, opium price, supply-side economic
incentives
Corresponding author:
Ludovica Giua
DG Joint Research Centre
European Commission
Via E. Fermi 2749, TP 361
Ispra (VA), I-21027
Italy
E-mail: ludovica.giua@ec.europa.eu
* We thank participants at 4th Dondena Workshop on Public Policy (Milan, 2019), CIED (Matera, 2019), 11th TWEC
(Amsterdam, 2019), 15th CSEF-IGIER Symposium on Economics and Institutions (Capri, 2019), ICEEE conference
(Lecce, 2019), CRENoS Workshop (Orani, 2019), Marche Polytechnic University seminar series (Ancona, 2018), AIEL
conference (Ancona, 2018), Applied Economics Workshop (Petralia, 2018), AIES conference (Naples, 2018). We are
grateful to Antonio Acconcia, Jérôme Adda, Luca Anderlini, Marco Bertoni, Sonia Bhalotra, Massimo Bordignon, Pierre
André Chiappori, Emanuele Ciani, Antonio Ciccone, Decio Coviello, Guido de Blasio, Rajeev Dehejia, Davide Dragone,
Andrew Ellul, Rachel Fernandez, Basile Grassi, Tullio Jappelli, George Mailath, Giovanni Mastrobuoni, Massimo
Morelli, Michael Muller-Smith, Marco Nieddu, Tommaso Oliviero, Marco Pagano, Lorenzo Pandolfi, Matthias Parey,
Nicola Persico, Luigi Pistaferri, Erik Plug, Carlo Prato, Enrico Rettore, Lorenzo Rocco, Shanker Satyanath, Annalisa
Scognamiglio, Saverio Simonelli, Jim Snyder, Rodrigo Soarez, and Giancarlo Spagnolo for their valuable suggestions.
The opinions expressed in this paper are those of the authors and do not reflect the views of the institutions to which
they are affiliated. Any errors are the fault of the authors alone.1 Introduction
The United States is experiencing its most devastating health crisis since the height of the
HIV/AIDS pandemic in 1995. In 2016 alone, Centers for Disease Control and Prevention (CDC)
recorded more than 63,600 drug overdose deaths nationwide, up five-fold since 1999. And two-
thirds of these fatalities involved opioids. Over the years, opioid-analgesic poisoning death rates
have increased for all age groups and especially for non-Hispanic white men and women (Chen
et al., 2014; Case and Deaton, 2015). Currently, the International Narcotics Control Board
estimates that the US is the leading consumer of opioid-based drugs, accounting for 50% of
the worldwide use of morphine, and 72.9% of oxycodone and other derivatives (United Nations,
2018). One of the most striking aspects of the current epidemic is that even if the users later
go over to illicit or illegal opioids, most of the abuse starts with opioids prescribed legally by
physicians (Okie, 2010).1
US pain specialists and advocacy organizations began to debate pain management practices
in the 1990s. The American Pain Society pressed for recognition of pain as the “fifth vital sign”
along with blood pressure, heart rate, respiratory rate and body temperature, while growing
numbers of professional and consumer groups urged greater use of opioid-based pain therapies
(Tompkins et al., 2017; Rosenblum et al., 2008). Pharmaceutical companies promoted opioids
heavily as a treatment option, often hiring consultants to emphasize the safety and benefits of
their opioid-based drugs and investing in major marketing campaigns (Van Zee, 2009; Jones
et al., 2018). For many years now physicians have been prescribing these drugs to more and
more patients, including people not suffering from a terminal illness; and this notwithstanding
the absence of any increase in patients’ reported pain and the strong evidence of the risk of
addiction and abuse associated with their prolonged use.2 In 2017, New York Special Narcotics
Prosecutor Bridget G. Brennan stated: “We did not develop an opioid epidemic until there was
a huge surplus of opioids, which started with pharmaceutical drugs.”3 More recently, Hadland
et al. (2019) and Nguyen et al. (2019b) show that opioid mortality rates and opioid prescription
rates are positively associated with physicians receiving marketing payments from the pharma
industry on opioid products.
In this paper, we assess the extent to which the economic incentives of opioid manufacturers,
stemming from variations in the world price of opium (i.e., the raw material for producing opioid-
based drugs), have contributed to the rapid growth in the use of prescription opioids (POs) in
the United States over the last few decades. According to estimates of the United Nations, 10
kilograms of opium are needed to produce around 1 kilogram of morphine base, which implies
a yield of about 10%.4 We use opium price in Afghanistan as a proxy for the world price of
1
Evans et al. (2019) and Alpert et al. (2018) analyse the effect of the reformulation of OxyContin in 2010
on heroin and opioid deaths, offering evidence of a consumer substitution response.
2
This prompts suspicions about the reasons underlying this crisis (Chang et al., 2014). The National In-
stitutes of Health, the federal agency responsible for biomedical and public health research, holds the phar-
maceutical industry and other stakeholders (e.g. insurance companies) partly responsible. See details at
https://www.drugabuse.gov/drugs-abuse/opioids/opioid-overdose-crisis.
3
Council on Foreign Relations, December 2017.
4
However, higher morphine content in raw opium and/or higher extraction technologies may determine a
2opium. In fact, according to the UN, in 2007 Afghanistan produced 93% of the world total
production of opium. We therefore seek to determine whether shocks to the price of opium in
Afghanistan, by altering opioid producers’ markup, affect per capita dispensation of POs in the
US.5
We use quarterly data at county level for the years 2003-2016 and measure price shocks
by interacting the log-change in the quarterly price of opium in Afghanistan with US counties’
ex-ante demand for opioid-based analgesics.6 This formulation captures the larger effect of
opium price shocks in counties where the initial demand for POs is greater, as the incentives
for pharmaceutical companies to promote opioid painkillers should be stronger where the initial
demand for analgesics is higher (Alpert et al., 2019; Nguyen et al., 2019a). In fact, the marginal
rate of success in marketing POs is likely to be higher where the pool of people suffering from
chronic pain is larger. To measure ex-ante county-level demand for POs, we use the number of
mining sites per capita in 1983, since in counties with a greater concentration of mining sites the
workforce is more likely to suffer from chronic pain. Given that it depends on a county’s geo-
morphological features, this measure exploits variation in subsoil characteristics in 1983, making
endogenous sorting in the demand for analgesics less likely. Indeed, most manual occupations
in mining and construction, in fact, are by nature exposed to the risk of chronic pain, often
associated with more use of painkillers to allow speedier return to the job (Leukefeld et al.,
2007).7
We find that a reduction in the price of opium in Afghanistan increases per capita PO
dispensation in the US significantly, and the estimated effect increases with the initial level of
demand for opioids in the county. In our data, a 1-standard-deviation decrease in opium price
growth (i.e., a fall by 20 percentage points) increases per capita dispensation of POs by 5 doses
in counties at the 12th percentile of the mining site distribution, and by around 6 doses in
those at the 76th percentile. This result is robust to a battery of tests, including the addition
of both county-year and state-quarter fixed effects, a placebo test with various lead times for
the price change, and alternative proxies for the ex-ante county demand for opioids, namely
the share of miners, the share of veterans and the share of workers in the heavy manufacturing
sector. Moreover, since the evolution in the price of opium is determined by the instability in
Afghanistan, we provide further evidence that the results hold when using variation in conflict
intensity, as measured by the number of Western casualties per quarter in Afghanistan, to
capture variation in the price of opium (Lind et al., 2014).
We show that the effect varies with some socio-economic characteristics. In particular, in
lower ratio. See DEA (1992) and United Nations (2003).
5
We discuss that the relative size of Afghan production creates incentives to the diversion of opium to the
illegal market that are likely to make the supply of licit opium destined to the pharmaceutical industry vary
accordingly (Section 3.2).
6
This recalls the approach of Bruckner et al. (2012) in studying the effect of oil price shocks on democrati-
zation.
7
Furthermore, mining is a particularly dangerous industry. According to the 1994 Census of Fatal Occupa-
tional Injuries, the mining sector had the highest fatality rate (27 per 100,000 workers employed, compared with
24 in agriculture, forestry and fishing and 15 in construction), as well as above-average rates of severe injury (i.e.,
cases involving lost work days and restricted work activity).
3line with the findings of previous studies (Case and Deaton, 2015; Krueger, 2017; Baker et al.,
2018), it is smaller in counties with higher initial levels of income, education, urbanization or
health insurance coverage. Conversely, the effect is stronger in areas with a higher initial share
of health care workers in the population. This is consistent both with the thesis that a greater
supply of health care services might imply easier access to POs per se and with the idea that
prescription rates might rise where competition for customers among health care suppliers is
more intense (West, 2013).
Remarkably, we find that negative changes in opium prices are significantly correlated with
increases in per capita opioid abuse death rates. This suggests that the increase in POs distri-
bution, possibly due to over-prescription, might lead the fatal abuse of pharmaceuticals, which
is at the root of the current epidemic (Okie, 2010). Moreover, we show that per capita drug-
related crimes, either sale or possession, increase significantly following a drop in the price of
opium. This indicates spillover effects on the illegal drug market (Mallatt, 2017; Meinhofer,
2017).
Further, the evidence indicates that the change in POs distributed is influenced by economic
incentives to opioid producers. Our hypothesis is that a fall in the price of opium, i.e., the cost of
the raw material, might widen the markup and so prompts an increase in the quantity of opioid-
based drugs dispensed. Thus, we expect the mechanism to be stronger for the drugs whose
production requires positive amounts of opium. The price shocks have an asymmetric effect on
the quantity of opioids prescribed, depending on the importance of opium in the manufacturing
process. Specifically, we find that most of the effect on per capita dispensation of POs relates to
natural and semi-synthetic drugs, which are produced either by natural processes or by chemical
modifications to opium, while for fully-synthetic opioids, in which raw opium is not an input,
we find no correlation with price changes.
While this evidence supports our claim, another possible explanation would be changes in
demand from patients. This would be the case if a fall in the price of opium led to a decline
in the market price of POs and in turn an increase in patients’ demand for opioids. We test
this alternative mechanism by replacing the price of opium with the average retail price of
generic opioid-based painkillers. We fail to detect that decreases in the market price of opioids
significantly increase per capita PO dispensation. Albeit the inclusion of different fixed effects
in the model, the relation might still suffer from a residual endogeneity concern. Nevertheless,
this result seems not supporting the existence of solely channel of change in patient demand.
This is in line with the findings of a recent study by Cutler et al. (2019), who show that patient
demand is relatively unimportant, compared with supply-side factors, in explaining variations
in health care spending.
Our hypothesis is supported by a firm-level analysis where we assess how opium price changes
affect the advertising expenses of US pharmaceutical companies. Importantly, we find that
opioid manufacturers, pharmaceutical companies that have obtained FDA approval for opioid
painkillers, significantly react to declines in opium prices by increasing advertising expenses.
This might suggest that opioid producers have reacted to the drop in raw material costs by
4using promotions as a strategy to expand demand at a time in which their markup has increased
(Zejcirovic and Fernandez, 2018). What is more, our firm-level estimates reveal that both the
stock market prices and profits of opioid producers benefits from a decline in the price of opium.
By contrast, the stock price of companies producing a substitute analgesic drug, ibuprofen, is
unaffected, even though their profits decline following an opium price drop. Overall, these
results indicate that a negative shock to the price of opium in Afghanistan is associated with
higher expected future profits for PO manufacturers in the US. This apparently confirms that
investors perceive opioid-producing companies as factoring fluctuations in the price of opium
into their business strategies.
Taken together, our results suggest that the rapid increase in the use of POs in the US
in recent decades has been to a significant extent supply-driven. This finding is particularly
important in the context of an epidemic opioid crisis, which public health officials have called
the worst drug emergency in America’s history, and at a time when excessively high prescription
rates are universally recognized as the root cause of the surge in overdose mortality (Okie, 2010;
Case and Deaton, 2015; Kolodny et al., 2015; Schnell, 2017). The rise in the use of opioid-based
drugs has produced a number of other adverse public health outcomes, such as emergency room
visits and neonatal abstinence syndrome (Patrick et al., 2012; Chen et al., 2014; Dart et al.,
2015), while the total economic burden of opioid-related overdoses, abuse and clinical practices
was calculated at about USD 80 billion in 2013 alone (Pollack, 2016).8 Other adverse effects
of the opioid crisis, especially socio-economic outcomes, are also increasingly studied. Case
and Deaton (2015, 2018) document that worsening labour market conditions and lack of access
to health care have fuelled a rise in drug, alcohol and suicide deaths, or “deaths of despair”,
especially among less educated, middle-aged, non-Hispanic white Americans. With reference
to opioid deaths, Ruhm (2019) highlights the importance of “drug environment” factors, such
as differential drug risks for different population subgroups. Other studies focus specifically
on the relationship between opioids and such other variables as employment (Carpenter et al.,
2017; Harris et al., 2017; Krueger, 2017; Currie et al., 2018), crime (Mallatt, 2017; Meinhofer,
2017; Doleac and Mukherjee, 2019), duration of disability benefits (Savych et al., 2018) and
child removals (Gihleb et al., 2018). Unlike these studies, our paper investigates the supply-side
drivers of opioid use.9 In line with some of these studies, we provide further evidence on the
socio-economic repercussions of the rise in opioid use in terms of both deaths and drug-related
crimes.
The present paper also contributes to two other strands of research. First, we add to the
supplier-induced demand literature by examining the economic incentives behind the dramatic
increase in PO use (Rice, 1983; Rice and Labelle, 1989; Iizuka, 2007; Liu et al., 2009; Currie
et al., 2011; Iizuka, 2012; Currie et al., 2014; Lu, 2014; Shigeoka and Fushimi, 2014; Sekimoto
and Ii, 2015). Second, our analysis builds on the literature on the effects of international com-
modity price shocks. Earlier studies have shown that commodity price shocks matter for conflict
(Brückner and Ciccone, 2010; Dube and Vargas, 2013; Bazzi and Blattman, 2014; Berman and
8
There is a vast literature on drug overdose and mortality rates. See Paulozzi (2012) for a review.
9
Dasgupta et al. (2018) review the social and economic determinants of increased use of opioids.
5Couttenier, 2015; Berman et al., 2017), democracy (Bruckner et al., 2012), mental health (Ad-
hvaryu et al., 2014) and schooling (Brückner and Gradstein, 2013); we show that they also have
an impact on the dispensation of prescription drugs. To our knowledge, this is the first contri-
butions to explore how supply-side incentives affect the per capita dispensation of opioid-based
drugs, documenting the first link in the causal chain that triggered the opioid crisis in the US.
The paper is organized as follows. Section 2 describes the development of the opioid crisis in
the US. Section 3 presents the data and our empirical strategy. Section 4 discusses the results,
robustness checks and the heterogeneity analysis. Section 5 interprets our findings in the light
of supply-side economic incentives. Section 6 concludes.
2 The US opioid crisis
Since the late 1990s, the US has seen an unprecedented escalation in the abuse and diversion of
prescription opioids that has been labelled “opioid crisis”. According to the CDC (2017), in the
period 1999-2016 more than 630,000 people died from drug overdoses. At first used primarily to
treat cancer-related pain, opioids have increasingly been prescribed for other symptoms, such
as back pain and osteoarthritis.
In the mid-1990s, the American Pain Society strongly advocated the concept of pain as
an essential aspect of health, to be monitored and managed (Max et al., 1995). The aim was
to promote awareness that patients in pain were generally under-treated, largely because pain
was not assessed regularly during physician and GP appointments or in hospital post-surgery.
Pain level was considered a subjective measure, unlike temperature, blood pressure, respiratory
rate and heart rate. Within five years the Joint Commission on Accreditation of Healthcare
Organizations and other US health experts had begun to emphasize the importance of regularly
assessing pain in all patients.10 Pain began to be accepted as a standard health check, and
physicians started to recognize self-reported pain as a the “fifth vital sign” to be assessed in
checking the body’s life-sustaining functions (Walid et al., 2008). The Department of Veterans
Affairs also proposed a toolkit including guidelines for comprehensive pain assessments.11
As prescription rates for opioid pain relievers rose, so did their misuse (Okie, 2010). Abuse
and diversion of prescription opioids spread rapidly across the country. Opioid abusers learned
that crushing the pills and injecting, inhaling or swallowing the resulting powder gave them a
morphine-like “high” and this created a market for the diversion of prescription (Evans et al.,
2019; Alpert et al., 2018). According to the Department of Health and Human Services, the
consequences have been devastating: not only an increasing number of deaths directly ascribed
to the abuse of these drugs but also the rising incidence of neonatal abstinence syndrome due
to opioid misuse during pregnancy and a surge in infectious diseases such as HIV and hepatitis
10
The Joint Commission accredits more than 21,000 US health care organizations and programmes. In most
US states Joint Commission accreditation is a condition for eligibility for Medicaid and Medicare reimbursements.
11
This concept is highlighted in the “Pain as the 5th Vital Sign” Toolkit (VA, 2000). For further details, see
https://www.va.gov/painmanagement/docs/toolkit.pdf. Wyse et al. (2018) report a slow but steady increase
in the use of medication for opioid disorders among veterans.
6C among the abusers. The Department estimates that 11.5 million people in the US misused
opioids in 2016 and more than 100 people died every day from opioid overdose. However, this
spectacular rise in the use of POs did not follow from any increase in patients’ reported pain
(Chang et al., 2014), which raises questions about the real drivers of the epidemic.
Perhaps one of the main determinants may have been the strategy adopted by some phar-
maceutical companies, and related stakeholders, to promote their opioid-based products. One
of the best known cases is the marketing campaign for OxyContin, an oxycodone-based drug
introduced by Purdue Pharma in 1996. The amount invested in its launch and marketing was
unprecedented, especially considering that it is a controlled drug. According to a 2002 Sen-
ate hearing, Purdue Pharma invested over USD 200 million in promoting OxyContin in 2001
alone.12 In that year OxyContin accounted for more than two-thirds of all oxycodone sales
in the US. As Van Zee (2009) documents, the producer’s marketing practices were unusually
aggressive.13 In particular, these massive campaigns targeted the physicians profiled as the
highest prescribers of opioids, and focused on convincing primary care physicians that opioids
entailed very little risk of addiction and could be used safely to alleviate pain not associated
with cancer. As a result, between 1997 and 2002 OxyContin prescriptions for cancer patients
increased fourfold, while those for non-cancer-related pain, which accounted for 86% of the total
opioid market in 1999, increased tenfold (General Accounting Office, 2003). Indeed, because
of its misleading promotion campaigns and, especially, the misrepresentation of addiction risk,
Purdue Pharma and some of its executives were fined over USD 600 million in 2007, and other
opioid manufacturers and distributors are now also facing lawsuits on similar grounds.14
The policy response to the opioid crisis came primarily at state level. The targets of the
policies varied (patients, physicians, pharmacists) and the types of limitation differed. The
impact of state policies on this dramatic epidemic is being investigated in both the medical
and the economic literature, but so far there is no clear consensus on whether these laws have
effectively limited abuse or reduced mortality (Meara et al., 2016; Popovici et al., 2017; Rees
et al., 2017; Buchmueller and Carey, 2018; Deiana and Giua, 2018; Doleac and Mukherjee,
2019).
12
See “OxyContin: Balancing Risks and Benefits”, Hearing of the Committee on Health, Education, Labor
and Pensions, S. HRG. 107-287, US Senate, Feb 2002.
13
They comprised the profiling of physicians, distribution of complimentary merchandising, and all-expenses-
paid conferences for health professionals to be trained in pain management. By the end of 2000, Purdue had a
total call list of more than 70,000 physicians across the US and had distributed patient starter coupons for free
prescriptions of the drug for 7 or 30 days. By 2001, 34,000 of the coupons had been redeemed nationwide. See
Van Zee (2009).
14
For instance, the founder of Insys Therapeutics was convicted in a case linked to the US opioid crisis, where
he was found guilty of conspiring to fuelling sales of addictive painkillers. Recently, Oklahoma’s judge ruled
that Johnson & Johnson had intentionally downplayed the dangers of using opioid drugs, forcing the company
to pay 572 million dollars in compensation to the state for false, misleading and dangerous marketing campaigns
for opioids. Interestingly, the fine landed well below the expected amount and trading investors responded
immediately, making Johnson & Johnson’s stock market price rise by more than 5% in the following hours.
73 Data and Empirical Strategy
Here we describe how the various sources have been combined to build our main dataset, provide
some descriptive evidence on the relationship between the price of opium in Afghanistan and
the prescription of opioids in the US, and describe our empirical strategy for investigating the
effect of these price changes on the dispensation of opioid-based drugs.
3.1 Dataset Construction
The data on POs come from the Automation of Reports and Consolidated Orders System
(ARCOS), maintained by the US Drug Enforcement Administration’s Office of Diversion Con-
trol. Since the Controlled Substances Act of 1970, manufacturers of controlled substances are
required to report on the amount of drugs produced and sold in the US. The annual ARCOS
reports record the quantities (in grams) of every controlled active ingredient sold in the US. The
data are disaggregated at the 3-digit zip code level across the United States and are available
quarterly. We gather the data for the period 2003-2016. We also draw zip code level informa-
tion on the number of mining sites in 1983 from the Mine Safety and Health Administration
(MSHA).15
As the rest of our data are disaggregated at the county level, we transpose the prescription
drug and mining site zip codes to county level using the 2000 and 2010 zip-to-county crosswalks
produced by the MABLE/Geocorr Application of the Missouri Census Data Center. To ac-
count for demographic differences between counties, we use the official intercensus population
estimates (total population counts and counts by sex, age band, race and ethnicity). The 1980
and 1990 population counts and the variables employed in robustness checks and heterogeneity
analysis come from the US Census Bureau. The quarterly time series of average prices of dry
opium in Afghanistan come from the Ministry of Counter Narcotics of the Islamic Republic
of Afghanistan, in partnership with the United Nations Office for Drug Control and Crime
Prevention (UNODCCP).16
Our final sample comprises 3,109 (out of 3,142) US counties and quarterly data for 14 years
(2003q1-2016q4). We also exploit the CDC WONDER Database, which provides detailed yearly
data on drug fatalities at county level.17 Moreover, we employ the Uniform Crime Reporting
(UCR) Program Data provided by the FBI, which gives the number of arrests by county and by
15
Mining sites refer to the extraction of coal (40%), metals (6%), non-metals (6%), stone (17.5%), and sand
and gravel (30.25%). The first year available is 1983. Taking instead the number of people employed in mining
sites as a robustness check, our findings stand confirmed.
16
The main analysis uses the average price (in US dollars per kilogram) drawn from traders in Nangarhar
and Kandahar provinces; the empirical checks are based on the average farm-gate price, which is available only
from 2004q3.
17
We count the following underlying or contributing causes of death: mental and behavioral disorders due
to use of opioids (F11) or due to multiple drug use and use of other psychoactive substances (F19); newborns
affected by maternal use of addictive drugs (P04.4) or by neonatal withdrawal symptoms (P96.1); identification of
opiate drugs or other drugs with addictive potential in blood (R78.1 and R78.4); abnormal levels of other drugs,
medicaments and biological substances (R82.5, R83.2, R84.2 and R85.2); accidental or intentional poisoning by
and exposure to drugs (X40-X44, X60-X64, Y10-Y14 and Y45); and assault by drugs, medicaments and biological
substances (X85).
8type of drug-related crime. According to the UCR, drug abuse violations are defined as state
and/or local offenses relating to the unlawful possession, sale, use, growing, manufacturing, or
making of narcotic drugs including opium, cocaine and their derivatives, marijuana, synthetic
narcotics, and dangerous non-narcotic drugs such as barbiturates. Furthermore, we use data
on the number of conflict fatalities in Afghanistan during the considered time period, which
are provided by the web site iCasualties.org. The data, which we aggregate quarterly, contains
information on name, cause of death, location and date of every casualty (Lind et al., 2014).
In the last part of the analysis, we use the Wharton Research Data Services (WRDS)
Compustat database, which includes financial, statistical and market data on active and inactive
companies throughout the world. It covers 99% of the world’s total market capitalization with
quarterly company data history. We focus on three main variables: stock prices, profits and
advertising expenses.
3.2 Preliminaries
In the last few decades Afghanistan has been the world’s leading producer of illicit opium, ahead
of the “Golden Triangle” (Myanmar, Laos and Thailand) and Latin America, reaching 90% of
global production in 2007.
Under Taliban rule in the 1990s, poppy cultivation increased spectacularly, from under
22,000 hectares in 1995 to over 38,000 in 1999, when Afghanistan supplied around 70% of illicit
opium worldwide.18 Cultivation plummeted to just over 3,200 hectares in July 2000, when the
Taliban leader Mullah Omar declared opium to be un-Islamic, in hopes of concessions by the
United Nations. With the start of military operations after 11 September 2001, however, the
Taliban broke the deal with the UN, allowing farmers to grow poppies again, and the land under
opium went back up to over 34,000 hectares in 2002 and 190,000 in 2007.19 Today, Afghanistan
is indisputably the world’s leading opium producer: according to the UN, in 2007 it produced
8,200 tons of opium, or 93% of the world total.
After peaking in the early 2000s owing to the ban on opium production, the average price
fell steadily as output soared. Figure 1 plots opium prices and the land area of opium poppy
cultivation in Afghanistan over time. The solid line shows traders’ prices, the dashed line farm-
gate prices. Predictably, the traders’ price is always a bit higher, but the two series are closely
correlated and inversely related to the number of hectares under opium poppies in Afghanistan
(grey bars).20 While opium prices were very volatile during our sample period, a good part
of this was due to the violent conflict in Afghanistan, which rules out the possible problem of
reverse causality for our analysis (Lind et al., 2014).21
18
The United Nations Office for Drug Control and Crime Prevention (UNODCCP) has been monitoring
Afghan opium poppy production since 1994.
19
See news reports: https://www.theguardian.com/world/2001/apr/01/internationalcrime.drugstrade
and https://www.theglobeandmail.com/news/world/kabul-may-be-lifting-opium-ban/article4153970/.
20
The peak in 2009-2011 reflects the rapid deployment of 100,000 US troops to the region, whose strengthened
oversight disrupted poppy production: the total area cultivated dropped to 123,000 hectares and the price of
opium jumped by 220% in a single year.
21
To provide further evidence that the variation in opium price affecting the changes in prescription rates is
exogenously determined by conflicts in Afghanistan, in Table 3 we implement a robustness test where we replace
9Figure 1: Hectares Cultivated with Poppies and Price of Opium in Afghanistan
Note: The grey bars are the number of hectares cultivated with opium in
Afghanistan annually. The solid line plots the average quarterly traders’ price
of dry opium in Afghanistan; the dashed line, the farm-gate price.
We take the price of opium in Afghanistan as a proxy for the world opium prices. In
fact, while we are not claiming that pharmaceutical companies make use of raw opium sourced
illicitly, we provide suggestive evidence that the trends in opium price in the legal market are
likely to be correlated with those in opium price as measured in Afghanistan. According to the
International Narcotics Control Board (United Nations, 2018), in 2016 India was the main legal
producer of raw opium, at 23.3 tons (or, 2.5 tons in morphine equivalent). In the same year, the
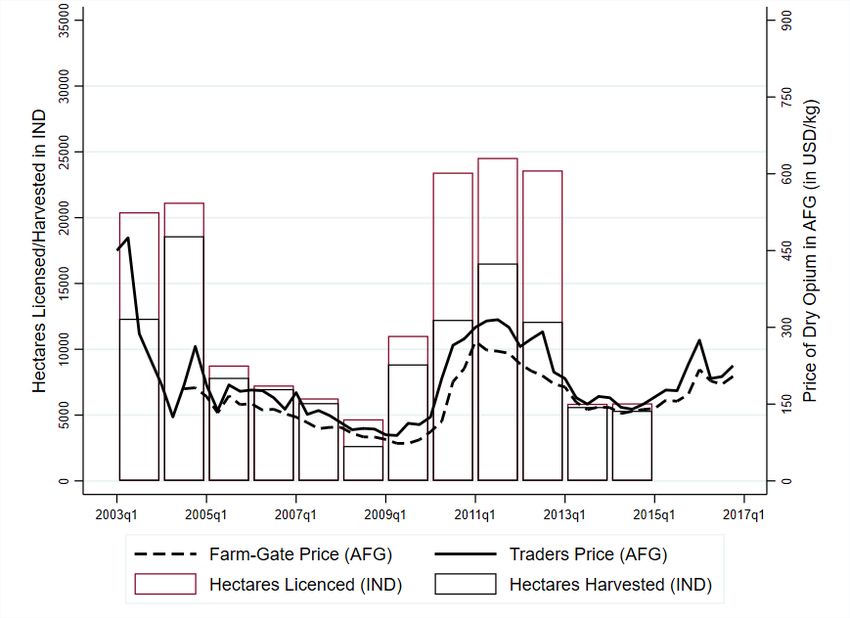
UNODCCP estimated Afghan opium production at 4,800 tons. Figure 2 reports information
on the production and diversion of opium in India, the main producing country of licit opium.22
The graph shows the price of illicit opium in Afghanistan, the number of hectares licensed to
cultivation of licit opium in India and those actually harvested. Paoli et al. (2009) consider
the share of hectares not harvested over the total area licensed to cultivation as a proxy for
diversion of licit opium. Also the UN has repeatedly reported the existence of leakages into
the illicit market (United Nations, 2005). As Figure 2 shows, this ratio for diversion of licit
opium is positively correlated with the price of opium in Afghanistan, as the difference between
hectares licensed and harvested is larger the higher the price of opium in Afghanistan. This
signals the existence of a stronger incentive for diversion from licit production when the price
of opium in the illegal market is higher. While actual production of licit opium in India is
positively correlated with the amount of opium diverted, the fact that both are also positively
our measure of price shock (i.e. the log-change in quarterly opium price) with conflict intensity as proxied by
(the log-change in) the number of Western casualties by quarter.
22
Data on India comes from the Indian Central Bureau of Narcotics (http://cbn.nic.in/html/
operationscbn.htm). See also Paoli et al. (2009) for contextual information.
10Figure 2: Price of Opium in Afghanistan vs Production of Opium in India
Note: The bars are the number of hectares licensed to opium cultivation
(red) and those actually harvested (black) in India annually. The solid line
plots the average quarterly traders’ price of dry opium in Afghanistan; the
dashed line, the farm-gate price.
correlated with the price of opium in Afghanistan suggests that, ceteris paribus, the quantity of
licit opium destined to the pharmaceutical industry decreases more than proportionally at high
levels of the Afghan opium price and vice versa. Thus, this would make licit opium relatively
more costly when opium price in Afghanistan is high and relatively less costly when incentives
for diversion are very low, i.e. opium price in Afghanistan is low.
Over the same period, pharmaceutical firms in the US invest billions of dollars annually in
advertising of drugs and medical equipment. While promotion of prescription drugs includes
direct-to-consumer advertising (DTCA) on broadcast and print media, the bulk of promotional
spending is targeted to physicians and other health care professionals through office visits by
company representatives (i.e., detailing), product sampling, and advertising in professional jour-
nals (Zejcirovic and Fernandez, 2018; Cegedim, 2013).23 Over the years, the growth in the
share of prescription drugs expenditures coincided with the growth in pharmaceutical promo-
tion, which increased from $11.4 billion in 1996 to $29.9 billion in 2005 (Datta and Dave, 2017)
and $32.3 billion in 2008 (Cegedim, 2013).24 Notably, these are the years in which, as shown
above in Figure 1, the price of opium fell sharply. Consistent with this, in Section 5 we show
that declines in the price of opium are positively associated with advertising expenses by firms
23
Together with New Zealand, the United States is the only country where advertising for prescription
drugs is legal. According to Cegedim (2013), detailing and free sampling accounted for about 83% of the US
pharmaceutical promotional budget in 2011.
24
Based on a representative survey, Campbell et al. (2007) show that in 2004 a good fraction of US physicians
received gifts from pharmaceutical sales representatives. Further, Mizik and Jacobson (2004), find that detailing
and free drug samples have positive and statistically significant effects on the number of new prescriptions issued
by a physician.
11that produce FDA-approved opioid-based drugs. This provides support to the hypothesis that
supply-side economic incentives played a role in the onset of the opioid epidemic.25 Recently,
Hadland et al. (2019) and Nguyen et al. (2019b) find that marketing payments on opioid prod-
ucts received by physicians are positively correlated with opioid mortality rates and opioid
prescription rates, respectively. At the same time, Figure A.1 indicates that the retail prices
of generic POs and the substitute analgesic, ibuprofen, remained relatively flat throughout the
period 2000-2015, offering presumptive evidence that demand-driven effects are unlikely to have
played a significant role in the rapid expansion of PO use.26
3.3 Empirical Strategy
Our analysis serves to gauge the extent to which change in dispensation of opioid-based drugs in
the US, which in principle should respond only to medical needs, is instead driven by economic
incentives. Specifically, we investigate whether changes in the sales of prescription opioids in
the US are driven by those in the price of dry opium produced in Afghanistan.
If the change in the quantity of opioids dispensed in the US is determined by economic
incentives to suppliers based on the price of the raw material, this mechanism can be expected
to be stronger in areas (in our study, counties) with higher ex-ante demand for opioids, as proxied
by (the log of) the per capita number of mining sites in 1983.27 These counties would represent
the most fertile local markets for analgesics, where PO promotion campaigns presumably had
the greatest chances of success. Accordingly, we estimate the following model:
∆ ln M GEpcct = α + β(ln M ines1983pcc ∗ ∆ ln OpiumPt ) + δt + γc + tθc + ct , (1)
where ∆ ln M GEpcct is the log-change in the per capita amount of Morphine Gram Equivalent
(MGE) dispensed in county c between quarter t − 1 and quarter t, ∆ ln OpiumPt is the log-
change in the average price of dry opium in Afghanistan between quarter t − 1 and quarter
t and ln M ines1983pcc is the log of the number of mining sites in 1983 (over the population
in 1980).28 We include county and quarter dummies and county-specific linear trends, which
should capture any changes in institutional or demographic factors during the period. The
errors are clustered at county level.29
25
David et al. (2010) find a positive correlation between different types of promotion of pharmaceuticals and
adverse drug events, such as overdoses and allergic reactions, in the US. See Morton and Kyle (2011, ch.12) for
a description of the market for pharmaceutical products.
26
The average prices are computed from the full sample of the Medical Expenditure Panel Survey (MEPS)
as the average full price for each dose (tablet or patch) of the generic drug in a given year. Only the price of
hydrocodone decreased in the period, by around half.
27
The robustness analysis uses alternative proxies for ex-ante county demand for painkillers.
28
M ines1983pc is rescaled by 100,000 residents to ease the interpretation. We use the log rather than the
simple number of mining sites per capita in 1983 because the distribution of sites across US counties is strongly
positively skewed. Using the number of mines per capita yields comparable results when excluding counties above
the 99th percentile (32 counties).
29
Clustering the errors at state level does not alter the results. The regressions are weighted by the county’s
share of the national population in 2000. Unweighted estimates are identical.
12Our dependent variable is a measure that accounts for changes in the total per capita dis-
pensation of opioid-based analgesics in a given county. These drugs come in different forms and
have different active ingredients. Here, we focus on the most commonly used substances: mor-
phine, hydrocodone, hydromorphone, oxycodone, fentanyl, meperidine and methadone, which
are all classified as Schedule II or Schedule III.30 We rescale the quantity of each substance to
account for relative potency and construct a single MGE indicator.31 Table A.1 reports the
descriptive statistics for the main outcome and control variables. Figure A.2 describes the ge-
ographical distribution of average MGE in 2003 and 2016, i.e. at the beginning and the end of
our sample period. We observe substantial variation across counties and years. The darker the
area, the higher the dispensation of POs. The lighter areas, indicating lower levels of MGE per
capita, are found predominantly in the central regions. The two maps also reveal the remarkable
nationwide increase in opioid use that marked our period.
Our explanatory variable measures shocks to the price of opium in Afghanistan. The anal-
ysis exploits price changes between two consecutive quarters to capture time variation. The
fluctuations during the period 2003q1-2016q4 are highly persistent, with an autoregression co-
efficient of 0.99. The augmented Dickey-Fuller test does not reject the hypothesis of a unit
root in opium price levels at the 90% confidence level, but it does reject the hypothesis of a
unit root in the first-differenced opium price at the 99% confidence level. Thus, we use the
first-differenced series of the (log) price of opium, which is stationary (as shown in Figure A.3),
to identify local shocks to the time series, as a proxy for changes in the cost of the raw material
for opioid-based drugs. Moreover, as observed above, opium price changes depend essentially
on the violent conflicts in Afghanistan, ruling out potential reverse causality problems (Lind
et al., 2014).
The geographical variation in local demand for prescription opioids in the US is proxied
by the number of mining sites per capita in a county in 1983. The distribution of mining
sites across the US is shown in Figure A.4. We use this as a measure for ex-ante demand for
opioids at the local level, given the common use of analgesics among workers employed in jobs
marked by physical strain and risk of injury (Leukefeld et al., 2007). A simple cross-sectional
regression between the log of mines per capita in 1983 and the log of opioid dispensation
rate over the period 2003-2016 produces an elasticity equal to 0.08, controlling for state-level
unobserved heterogeneity. This evidence goes together with Figure A.5, which shows a positive
link between our measure for the ex-ante demand of painkillers, i.e. mines, and the incidence
of unintentional injury rates at work. Moreover, as additional suggestive evidence we show
that mines positively correlates with payments or transfers of value to physicians or hospital
recipients in 2016 (Figure A.6). This provides empirical support to the claim that the presence
30
The lower the schedule order, the greater the drug’s abuse potential. For instance, heroin is a Schedule I
substance, while cough medicines with less than 200 mg of codeine per 100 ml. are Schedule V. Schedule II and
Schedule III substances are those that have respectively high and moderate potential for abuse and are known
to lead to psychological or physical dependence.
31
Our choice of multipliers for conversion into MGE units conforms to Gammaitoni et al. (2003), Paulozzi
et al. (2011) and Brady et al. (2014). We rescale the substances as follows: morphine by 1, hydrocodone by 1,
hydromorphone by 4, oxycodone by 1, fentanyl by 75, meperidine by 0.1 and methadone by 7.5.
13of mining sites is a good proxy for the ex-ante local demand for opioid analgesics. At the same
time, this measure is reasonably exogenous to the current quantity of opioids prescribed by
physicians, as it is predetermined by geographic morphology and measured in 1983, well before
the onset of the opioid crisis (in the late 1990s).
The coefficient β in Equation 1 is meant to capture the impact of opium price shocks on
per capita MGE units dispensed in US counties. In other words, if opioids were dispensed
independently of the price of opium and strictly on the basis of the actual medical needs of the
population, β would not be statistically different from zero. Yet, the unfolding of the opioid
crisis and the proliferation of newspaper articles and academic papers instead suggest that we
should expect the coefficient β to be negative. This would imply that, where dependence on
painkillers is greater, a fall in the price of opium should trigger a larger increase in per capita
dispensation of POs. In this case the underlying mechanism would be purely economic; that is,
drug manufacturers react to changes in the cost of the raw material (the price of dry opium)
by promoting their drugs so as to obtain a greater increase in profits.
4 Results
In this section we present our main result, namely the estimate of the effect of opium price
shocks on per capita dispensation of MGE units. We test for robustness to a battery of checks
and placebos. Then, we discuss heterogeneous effects and compare them with the results in
the literature. Finally, we give evidence of the effect of opium price shocks on opioid-related
mortality rates and drug-related crime rates.
4.1 The Effect of Opium Price Shocks on Prescription Opioids Dispensation
Table 1 shows the main results of the estimation of Equation 1. Column 1 reports the uncon-
ditional estimate of the effect. This coefficient is negative and strongly significant at the 1%
level, indicating that an increase in the price of opium in Afghanistan is closely correlated with
a reduction in opioid prescriptions in the US. Our interaction term implies that the impact
of opium price changes should be larger in counties with higher initial demand for analgesics
(i.e., heavier dependence on opioids), proxied by mining sites. Indeed, we expect pharmaceu-
tical companies to have a higher marginal rate of success in promoting opioids in areas where
relatively more people suffer from chronic pain and are therefore in need of analgesics.
Column 2 includes county and quarter dummies to control, respectively, for time-invariant
local heterogeneity and for time effects that might possibly confound the main effect. We find
that the coefficient doubles and remains statistically significant at the 1% level, which suggests
considerable heterogeneity in opioid use across quarters and counties. Column 3 evaluates our
main specification as in Equation 1, where we also add county-specific linear time trends to
purge the effect of other unobserved time-varying characteristics at county level. This should
rule out the possibility that counties with different initial demand for POs were already on
differential growth trajectories of opioid dispensation, so that the change in use would have
14Table 1: Effects on MGE
(1) (2) (3)
Dep. variable ∆ lnMGEpc ∆ lnMGEpc ∆ lnMGEpc
lnMines1983pc * ∆ lnOpiumP -0.0025*** -0.0056*** -0.0064***
(0.0003) (0.0021) (0.0023)
Observations 174,104 174,104 174,104
R-squared 0.0074 0.3279 0.3329
County Dummies X X
Quarter Dummies X X
County-Specific Linear Trends X
Note: * p4 of Table A.2 we add 1-quarter and up to 1-year lags, respectively, to our main specification.
The coefficients associated with the lags suggest that there are no delayed effects, while the
coefficient of interest remains stable in both magnitude and significance.35
We also run a battery of additional placebo tests. First we generate new interaction terms
that exploit quarterly changes in other time series: international oil prices, the Consumer Price
Index (CPI) and the international prices of copper, sugar, coffee, cocoa, wheat and palm oil.
Table A.3 shows no impact of these interaction terms on changes in per capita use of POs.
This eliminates the danger that our results might be capturing spurious correlations. Second,
we check whether opium price shocks are systematically associated with changes in the sales of
other drugs, namely amphetamines, methamphetamines and cocaine. The results in Table A.4
support our thesis.
Table 2 presents a set of robustness checks on our main specification. Column 1 includes
county-specific quadratic and cubic time trends to purge the effect from possible non-linear,
unobserved time-varying characteristics at county level. The coefficient β remains stable and
statistically significant at the 1% level. Column 2 includes state-quarter fixed effects to account
for potential unobserved time-varying factors, such as changes to the institutional set-up at state
level, during the period. This is an important check in view of the policies recently introduced
in various states to counter the opioid crisis. In this case the magnitude of the effect diminishes,
but it remains statistically significant at the 5% level. Next, in column 3, we include county-
year fixed effects to account for yearly heterogeneity at county level. Here, we exploit only
the residual quarterly variation of the phenomenon, as the fixed effects absorb any changes in
local characteristics that may vary from year to year (such as average education or income) and
Table 2: Effects on MGE: Robustness checks I
(1) (2) (3) (4)
Dep. variable ∆ lnMGEpc ∆ lnMGEpc ∆ lnMGEpc ∆ lnMGEpc
lnMines1983pc * ∆ lnOpiumP -0.0065*** -0.0039** -0.0083** -0.0054**
(0.0024) (0.0019) (0.0034) (0.0025)
Observations 174,048 174,104 174,104 174,048
R-squared 0.3367 0.5942 0.4349 0.6545
County-Specific Quadratic Trends X
County-Specific Cubic Trends X
State-Quarter FE X X
County-Year FE X X
Note: * pconfound our estimate. In this specification the coefficient is higher and remains statistically
significant at the 5% level. Finally, in column 4, we almost saturate the model by including
both state-quarter and county-year fixed effects. Remarkably, the coefficient remains strongly
negative and statistically significant at the 5% level.36
Then, we consider whether the results may not be driven by the way in which the explanatory
variable is measured. Throughout the analysis we use the traders price of opium in Afghanistan,
but it could be contended that this price itself depends on trends in demand for opium-based
products in the US. Accordingly, we re-estimate our main specification, replacing the traders
price with the farm-gate price (Table 3, column 1), which is known to depend mainly on changes
in local conditions (conflict events or weather) and is unlikely to be affected by changes in the
prescribing rates of opioids in the US. Since the farm-gate price is available only after 2004,
column 2 also reports the estimate using the trader price, but with the restricted farm-gate
sample. Reading across columns 1 and 2 indicates that our main result is robust not only to an
alternative measure of opium prices but also to restriction of the sample to more recent periods.
Moreover, we test the robustness of our results by exploiting changes in conflict intensity
in Afghanistan as an alternative measure to capture opium price shocks. As discussed above,
variation in the price of opium produced in Afghanistan is mainly determined by conflict. In
our setting, warfare destroys physical infrastructure, cultivated hectares and human capital,
which should trigger a drop in the production of opium and a subsequent increase in its price.37
Table 3: Effects on MGE: Robustness checks II
(1) (2) (3) (4) (5) (6) (7)
Dep. variable ∆ lnMGEpc ∆ lnMGEpc ∆ lnMGEpc ∆ lnMGEpc ∆ lnMGEpc ∆ lnMGEpc ∆ lnMGEpc
lnMines1983pc * ∆ lnOpiumP -0.0083** -0.0053***
(0.0032) (0.0019)
lnMines1983pc * ∆ lnCasualties -0.0019**
(0.0010)
I(Mines1983pc > Median) * ∆ lnOpiumP -0.0107***
(0.0039)
lnMiners1983pc * ∆ lnOpiumP -0.0046***
(0.0014)
lnVeterans1999pc * ∆ lnOpiumP -0.0400***
(0.0137)
lnHeavyManuf1999pc * ∆ lnOpiumP -0.0040*
(0.0021)
Observations 152,341 152,341 174,104 174,104 173,880 173,936 96,880
R-squared 0.3557 0.3557 0.3339 0.3325 0.3323 0.3319 0.3443
Opium Price Farm Trader Trader Trader Trader Trader
Note: * pThus, we replace the log-change in opium price with the log-change in the number of Western
casualties in Afghanistan (see Lind et al., 2014). The estimates in column 3 confirm our main
result. This lends further credibility to our empirical strategy as it rules out any residual concern
on the endogeneity of opium price shocks.
Next, we construct four alternative measures of initial opioid exposure. In column 4 of
Table 3, instead of a continuous variable for initial exposure we use a binary indicator for the
most highly exposed counties, i.e. those above the median in number of mines per capita. In
column 5, we replace the number of mining sites per capita with the number of people employed
in mines in 1983 over the population in 1980 (Miners1983pc). Since mines might also capture
levels of urbanization, education or poverty, columns 6 and 7 of Table 3 use two alternative
proxies for the initial demand for opioids to address this concern. Column 6 uses the population
share of war veterans in 1999. Veterans are another population group making greater use of
opioid-based medications (Edlund et al., 2007; Banerjee et al., 2016), and they are more or
less evenly distributed across rural and urban counties. Column 7 takes the per capita number
of heavy manufacturing workers in 1990, as this sector, like mining, is characterized by high
rates of work-related injury but is typically concentrated in cities and towns. Reassuringly,
the estimated coefficients in these alternative specifications are all negative and statistically
significant, strengthening confidence in our main results.38
4.2 Heterogeneity Analysis
We check for heterogeneous effects of opium price shocks on the per capita dispensation of POs
according to counties’ socio-economic characteristics.
In Table 4 we define dummy variables equal to 1 for above-median values of income per
capita, share of graduates, urbanization, share of people with health insurance, and share of
elderly (over 65) at the beginning of the period (1990 or 2000, depending on data availability).
Interacting these indicators with our variable of interest, we find empirically that factors such as
education mitigate the effect of opium price shocks on PO dispensation, in line with the findings
reported by Case and Deaton (2015). Also, wealthier and urbanized areas, which typically
feature a higher share of residents with health insurance, display lower impact of opium price
changes on the dispensation of opioid-based drugs, in line with the empirical evidence provided
by Krueger (2017). This result also confirms the recent findings on the effect of Medicare
expansion on opioid use by Baker et al. (2018), namely that enrolment in the Medicare plan
that combines drug coverage with other medical benefits significantly reduces the probability
of requests for opioid prescriptions, by comparison with other (stand-alone) drug plans.
We also explore the possibility of heterogeneous effects driven by the initial availability of
health services in a county. Specifically, we interact our variable of interest with the share of
38
When including different proxies for the ex-ante demand for opioids (mines, veterans and employment in
the manufacturing sector) in a “horse-race” regression, we find a robust and statistically significant negative
impact on opioids dispensation associated with any of them. Since the effects are separately identified, we
confidently exclude that the different proxies are possibly capturing similar geographical variations (if anything,
we are estimating different sub-population margins). All the specifications are also robust to the inclusion of
county-year fixed effects, thus exploiting within-year variation.
18You can also read