The economy of local food in vancouver
←
→
Page content transcription
If your browser does not render page correctly, please read the page content below

Vancouver Economic Development Commission | British Columbia, Canada

                    the economy of local food in vancouver
INDUSTRY PROFILE » GREEN TECH

the economy of local food in vancouver
August 2009
By Chris Hild (M.B.A.)
Report produced for the Vancouver Economic Development Commission
Project Supervisors: Jonathan Kassian, Vancouver Economic Development Commission, and Dr. James Tansey, Centre for Sustainability and
Social Innovation, Sauder School of Business, University of British Columbia.

Contents
Executive Summary......................................................................................................... 3

Recommendations........................................................................................................... 4

1. Introduction................................................................. 6
1.1 The Food System in Vancouver.................................................................................. 6

1.2. Distribution.............................................................................................................. 8

1.3 Farmers’ Markets...................................................................................................... 9

1.4 Value Added Production............................................................................................ 11

1.5 Demand Drivers: Supermarkets & Restaurants............................................................ 12

1.6 Institutional Buying................................................................................................... 12

1.7 Summary: Barriers & Gaps Within the Vancouver Food System.................................... 13                                        This project was undertaken in
                                                                                                                                            conjunction with the Centre for
                                                                                                                                            Sustainability and Social Innovation,
2. Case Studies. ................................................................ 13                                                        Sauder School of Business, University
                                                                                                                                            of British Columbia.

2.1 Case Study: Granville Island Public Market................................................................ 13

2.2 Case Study: Portland . .............................................................................................. 14

3. Current Vancouver Initiatives.................................... 16
3.1 Local Food First........................................................................................................ 16
                                                                                                                                            We acknowledge the financial
3.2 Vancouver Food Policy Council.................................................................................. 17                      support of the Province of British
                                                                                                                                            Columbia through the Ministry of
3.3 Hub Concept............................................................................................................. 17             Small Business, Technology and
                                                                                                                                            Economic Development and the NCE
                                                                                                                                            Program and NSERC provided via the
                                                                                                                                            Industrial Research & Development
4. Conclusions.................................................................. 19                                                         Internship Program Fund.

                                                                                                                                            VEDC
Appendix 1........................................................................... 21                                                    Suite 1620 - 1075 West Georgia Street
                                                                                                                                            Vancouver, BC Canada
                                                                                                                                            Toll Free: 1 866 632 9668
                                                                                                                                            www.vancouvereconomic.com

                                                                                           2
INDUSTRY PROFILE » GREEN TECH

Executive Summary                                                     in favour of other regions with lower cost structures.
The food system within Metro Vancouver is responsible for             This movement has left a gap in the food system, which,
feeding more than two million people on a daily basis. The            because of required capital and capacity, is difficult for local
region’s population is expected to grow substantially over            entrepreneurs to fill and further contributes to food waste.
the next thirty years, which means the system will need               The mainstream food distribution network, similar to the
to keep pace. However, the region’s seasonal production               food supply network, is controlled by large distribution
limitations, coupled with demand for its horticultural products       and wholesale companies that feature imported food.
from around the globe, have created a system reliant on a             Supermarket chains operate their own distribution facilities
predominantly imported food supply. Industrial conglomerates          and a concentrated, independent wholesale network serves
from California and Mexico enjoy significant cost, economies          the fragmented retail marketplace. From a restaurant
of scale and efficiency advantages over local producers.              and hotel perspective, two large food service distribution
Further, they demand local buyers to accept supply on a year-         companies control approximately two-thirds of the market
round basis, which shifts power into the hands of imported            share in Metro Vancouver. Because of the food system’s
producers. As a result, the food system’s dependency on               concentration of power, alternative distribution companies
imported food has made the local region less self-sufficient          have emerged, which place greater emphasis on supporting
and places food security at risk.                                     local producers, but lack infrastructure and value chain
Constraints within the imported or ‘mainstream’ food                  linkages to create significant economic benefits.
system have provided incentives for local producers to                Infrastructure investments, such as storage and equipment,
grow high value crops, which has helped create a valuable             can be cost prohibitive for producers because of the cost and
export market. These high value crops, such as blueberries,           limited relative use that comes from seasonal production.
are partly produced because of high land costs in Metro               The highly fragmented network of small farms also creates
Vancouver that make certain crops unprofitable to sell in the         barriers to scale up local production at a critical mass level.
domestic market. Subsequently, some domestically produced             However, the distribution community is beginning to invest
crops are labeled as ‘boutique’, which translate to higher            in local producers by educating them of buyer expectations
selling prices. However, as the price of fuel directly impacts        (grading, packaging, labeling) for crops. Technological
the cost of transportation, imported suppliers could be forced        infrastructure also impacts crops; for example, hydrocooling
to increase the cost of their crops, which would bring the            can greatly extend crop shelf life and is efficiently utilized
price gap between local and imported producers closer.                within the mainstream food system.
The Agricultural Land Reserve (ALR), which recognizes                 The local food system lacks effective linkages with value
agriculture as a priority use in dedicated zones, supports            chain partners, who inherently favour the mainstream
local food production in British Columbia. Compared with              system because of its simple, uncomplicated and established
imported produce picked before ripeness and shipped long              structure. Supermarkets, restaurants, and institutional
distances to Metro Vancouver, horticultural products from             buyers acknowledge that greater support of local producers
the ALR are shipped short distances when ripe. As a result,           will add layers of complexity to their operations because
efficiently distributed local production reduces greenhouse           of increased administration costs and concerns over food
gas emissions (GHG), and reduces the cost of transportation           safety. Thus, a general lack of enthusiasm to support local
and the ‘real cost’ of carbon to the environment.                     producers is present. Additionally, a parallel ethnic food
Consumer demand for locally produced food is best evidenced           system that is heavily influenced by an established Asian
through the strong financial performance of Vancouver                 network contributes to a segregated food system within
Farmers’ Markets. In recent years, vendor receipts have               Metro Vancouver. Barriers in language and cultural practice
grown to create over $10 million of economic activity for the         reinforce a ‘business as usual’ approach, which continues
local economy. Secondary rounds of spending because of                to favour existing supply connections. Overall, connections
the markets are shown to benefit employment (jobs, wages)             between local producers and large-scale local sales
as well as adjacent business revenues. From a producer                opportunities need to be improved, though some progress
perspective, farmers’ markets provide an opportunity to sell          is being made in this respect through the Local Food First
direct to consumers and can provide better financial returns.         network.
Contract crop production, like Community or Restaurant                Portland, Oregon, a region known for its commitment to
Supported Agriculture (CSA/RSA) is another form of direct             local food, is a good benchmark for a successful local
marketing, but is slow to be adopted. The success of farmers’         food system. Much like the City of Vancouver and the ALR,
markets has been achieved despite facing challenges in                Portland has an urban growth boundary that outlines specific
operational capacity and restrictive regulations.                     areas for agriculture production. Coupled with a greater
Farmers’ markets and retailers have also benefited from               ability to produce year-round and strong consumer demand,
increasing consumer demand of value-added or ‘artisanal’              food entrepreneurs have formed crucial connections and
type products, which typically have higher margins than               linkages that influence food policy for the region today. These
minimally processed crops. However, in recent years, food-            linkages have created effective infrastructure that enable
processing activities within Metro Vancouver have deteriorated        food system actors to efficiently operate within a locally

                                                                  3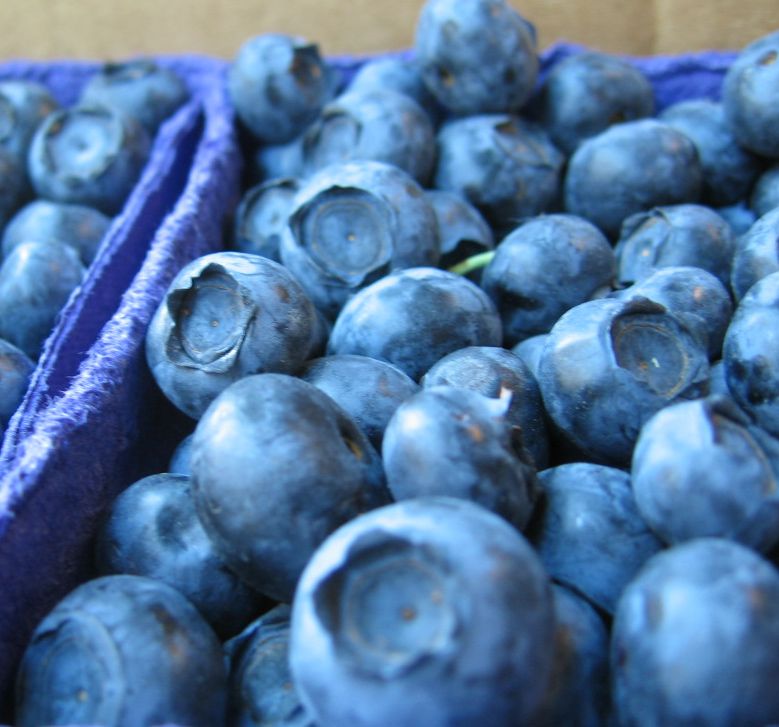
INDUSTRY PROFILE » GREEN TECH

demanding marketplace. Through dedicated investment,                       distributors
non-governmental organizations and local advocacy groups                      ›› Create storage facilities to store crops and extend the
provide institutional buyers with incentives to procure local,                   selling season
which limits economic leakage to other regions. Many of                 ›› Utilize web resources to connect buyers and sellers real
these value chain actors also seek to reduce their impact                  time
on the environment by embracing sustainability as a core                ›› Assist local producers with investments in technology that
principle to their operative structure.                                    lengthen product shelf life
Similarly, Vancouver’s Granville Island is a model where                ›› Create database that maps all value chain members and
a supportive local food infrastructure showcases the                       their respective needs
abundant food offerings to over 12 million annual visitors. Its       Farmers’ Markets (FM)
management supports local producers by providing space to
                                                                      Fewer restrictions and market permanence are central to
sell unique, high quality crops that increases local demand,
                                                                      fostering growth for farmers’ markets in Vancouver. The City
builds production capacity and creates additional customer
                                                                      of Vancouver, the Parks Board, the Vancouver School Board
traffic. Granville Island is successful in part, because of its
                                                                      and Your Local Farmers’ Market Society need to partner
infrastructure and profile, which advances the local food trade
                                                                      and cooperate to make markets an integral part of a livable,
and provides strength to the city’s international acclaim.
                                                                      sustainable city.
Despite some of its weaknesses, the food system in Metro
Vancouver is beginning to display strengths similar to that of          ›› Reduce restrictive regulations that constrain farmers’
Portland. Consumer demand is driving food buyers to make                   market (FM) operations (signage, access to electricity) and
incremental changes in favour of local food procurement.                   create permissive bylaws based on specific FM needs
The distribution network is starting to work with producers             ›› Provide longer-term leases to establish markets and avoid
to mutually benefit operations, which also provides benefit                high switching costs
to the environment as it redirects supply away from distant             ›› Expand network to downtown location during the work week
growing regions. Local advocacy groups are taking greater               ›› Provide tax breaks to businesses that assist farmers’
leadership in advancing the local food trade through                       markets (parking, storage)
effective partnerships with public and private entities. For            ›› (Along with Local Food first partners) develop hub concept,
example, Local Food First is championing the connection of                 including a resilient business plan, strong partnerships, and
neighbourhoods through a food ‘hub’, which is envisioned to                long-term capital campaign
include a permanent farmers’ market, distribution/storage               ›› Capitalize on economic benefits of farmers’ markets
centre and food processing capacity. The hub will also foster              and strategically locate markets to meet the needs of
an exchange of ideas between local food actors to create a                 underserved areas in Vancouver
more robust local food economy. The Vancouver Food Policy               ›› Build relationships with retailers/restaurants to jointly
Council also directly contributes in this space as it works                promote local supply
directly with the City of Vancouver on food-related issues and          ›› Create a market sponsorship strategy to strengthen
initiatives.                                                               operations
                                                                        ›› Link community organizations with farmers’ markets to
Recommendations                                                            support health
Many different parties will need to cooperate to achieve              Restaurants & Food Retailers
a more profitable and sustainable local food system that              Retailers and restaurants can create partnerships local
makes better use of existing production by ensuring more              producers by promoting their products within their operations,
of it reaches local shelves. Public institutions can assist           building on a successful value proposition from other
producers and farmers’ markets by easing regulatory barriers          jurisdictions.
and starting procurement initiatives. The private sector
will determine success, and it remains to be seen whether               ›› Partner with farmers to create joint promotions that feature
Vancouver farmers, restaurants, retailers and others can                   local products
build the linkages and partnerships that have been critical             ›› Build partnerships with farmers to build local capacity
to success in regions such as Portland. The Local Food First               through improved Restaurant-Sponsored Agriculture (RSA)
network has begun the work of filling gaps and building                    adoption
linkages, but will need widespread support across the value             ›› Create an alternative RSA / CSA (Community supported
chain to build a strong local food system.                                 Agriculture) design to share up-front costs and improve
                                                                           cash flow
Distribution
                                                                        ›› Partner with farmers’ markets to build local capacity and
Stronger distribution linkages are the key requirement in                  make them central to the selling proposition, as is common
getting local food to market. This can be achieved if the                  practice in Portland
private sector (building on the work of Local Food First) can           ›› Feature local producers within the restaurant / retail
open up existing or create new distribution channels.                      communications – build local brand
  ›› Provide access for local farmers to intermediaries and
                                                                  4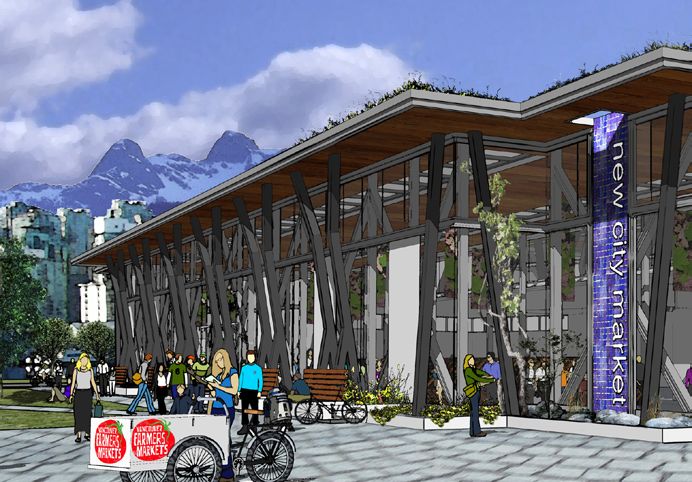
INDUSTRY PROFILE » GREEN TECH

Institutional Buying
Large public institutions can improve their supply of healthy
local food through procurement initiatives that build local
capacity and build on existing institutional resources such
as warehousing facilities. Vancouver Coastal Health, the
Vancouver School Board, the City of Vancouver and the
University of British Columbia are candidate institutions.

  ›› Communicate with distributors and wholesalers to improve
     local sourcing

                                                                                                          PHOTO: GEA REFRIGERATION
  ›› Specify a certain percentage of supply to come from local
     producers
  ›› Connect with other institutional buyers to increase scale and
     lower individual cost of the two above recommendations
  ›› Link institutional purchase managers with alternative
     suppliers such as farmers’ markets
  ›› Introduce local food requirements for public institutions
     and encourage private institutions to change procurement
     policies
  ›› Increasingly coordinate schools with local farms to educate
     children and supply farmers with access to direct sales
Food Processing
Linkages between producers and processors are critical to
rebuilding the area’s processing infrastructure, building on
work underway through the Local Food First network.

  ›› Better utilize existing processing infrastructure (i.e.,
     kitchens) to reduce waste and retain local investment
  ›› Connect with producers and encourage contract crop
     production for processing that can be used with 2nd grade
     products
  ›› Provide incentives for primary and value added
     entrepreneurs through grants
Producers
Farmers will need to better educate themselves about local
sales and partnership opportunities in order to access the
higher-value local market.

  ›› Provide financial and educational support for local farms to
     build capacity and enter the mainstream supply chain
  ›› Ensure knowledge exists across the industry on processing,
     packaging, grading, traceability, health and safety, and other
     requirements of large-scale production
  ›› Connect with local food processors to utilize 2nd grade field
     crops
  ›› Create incentives for distributors and wholesalers to serve
     the local, independent market, and support a dedicated
     agent to manage local growers
  ›› Create farm partnerships to share in packaging and
     transportation costs

                                                                      5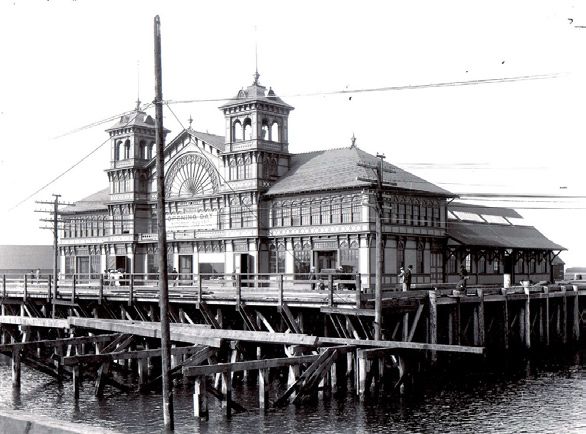
INDUSTRY PROFILE » GREEN TECH

1. Introduction                                                                          same ratevi, which will create opportunities to improve the
                                                                                         food system.
The Vancouver Economic Development Commission, as part                                   Current Food System Design: Retail Structure
of its efforts to develop an Economic Development Strategy
for the City of Vancouver, has commissioned research into                                The current retail supply structure is designed to meet
the economics of the local food system that will inform its                              consumer demand through a web of interconnected market
recommendations to Vancouver City Council. The following                                 actors that balances local and international supply. With
is a brief summary of the major issues in the current                                    respect to local distribution of vegetables, wholesalers
system, along with recommendations to strengthen the                                     have limited options to serve the retail food sector. Local
system through a more effective utilization of local food and                            seasonality of specialized production creates a valuable
entrepreneurial spirit.                                                                  export market, which utilizes imports to supply remaining
                                                                                         product demand. Thus, approximately 20% of locally
1.1 The Food System in Vancouver                                                         consumed vegetables come from local sources.vii
The food system in Vancouver, comprised of food production,                              In 2005, retail food sales in British Columbia accounted for
processing, distribution, consumption and waste management                               60% of total commercial food sales.viii The B.C. food supply
activities, has the responsibility to feed nearly 615,000 people                         chain, as illustrated in Figure A, is simplified to show the
within Vancouver and another 1.7 million in the communities                              relative impact of growers from outside of and within British
that encompass Metro Vancouver.i The main components of                                  Columbia.
this system are concentrated among large companies that
control market share and in turn, the greater proportion of                                    Figure A: Producer to Retailer Supply Chain Overview
wealth. Consumer demand, annual growing limitations in                                                                in B.C.
Metro Vancouver and profit incentives have formed a system
reliant on imported commodities and has reduced self-                                            Mainstream Food Supply                       British Columbia
sufficiency for the region and British Columbia (B.C.) as a                                        (Imported Products)                             Growers
whole.
Due to seasonal production, an estimated annual gap of                                       Packers/
1.3 million tonnes exists between total food consumption                                    Processors
and local food production capabilities in Metro Vancouver.                                                                                             Brokers
Consumer demand for worldwide horticultural products has
made B.C. approximately 48% self reliant among major food                                           Shippers
groupsii and further places the local food system at risk.
Sudden closure of the border would leave the region with
just three days of fresh fruit and vegetables, affecting public                                                         Wholesalers
health and economic investment.
The Agriculture Land Reserve (ALR)1 also impacts B.C.
food production, which restricts residential, commercial
and industrial development and encourages agricultural                                                  Jobbers
production in designated regions. Most employable
agriculture land in the ALR is actively farmed, although
an estimated 6% (6,000 to 7,000 acres) is idle or unused.                                                  British Columbia Food Retailers
iii
    Products grown within the ALR are highly associated with
quality because they are picked when fully ripe and delivered
quicker than products from imported regions. While imports                               Adapted from: Novacorp Consulting Inc. 2006. Guidelines for BC Food Producers
                                                                                           & Processors on Selling to Food Service Distributors. Report prepared for the
are also perceived as high quality, they are picked far before                            BC Ministry of Agriculture and Lands. http://www.al.gov.bc.ca/foodprocessing/
reaching a ripe stage and are transported over 2,000 km                                      documents/foodservice_market/final_fsd_marketing_sales_manual.pdf
before it can be consumed.iv With the population in Metro
Vancouver expected to rise from 2.2 million in 2006 to 3.3
                                                                                         Most of the Lower Mainland’s horticultural production (69%)
million in 2040v, demand for food will increase at roughly the
                                                                                         passes through wholesalers, where it is, at the very least,
1 The Agriculture Land Reserve (ALR) is a provincial zone in which agriculture           graded and packaged.ix Wholesale distribution centres
is recognized as its priority use. Farming is encouraged, and non- agricultural          are either owned by large retail chains (Overwaitea Food
uses are controlled. The ALR covers approximately 4.7 million hectares, and it           Group, Safeway, IGA) or by other large, private companies
includes private and public lands that may be farmed or forested, as well as
                                                                                         without direct retail ownership presence. Many of these
vacant land. It comprises those lands within British Columbia that have the
potential for agricultural production. Source: Anthony Brunetti. RE-LOCALIZING           wholesalers are located in East Vancouver, concentrated
HORTICULTURAL SUPPLY CHAINS IN LOWER MAINLAND, BRITISH COLUMBIA,                         along Malkin Avenue. It is estimated that large retail chains
CANADA: AN EXPLORATORY STUDY OF MARKET BARRIERS AND OPPORTUNITIES.                       control 65% of supply, while other wholesalers direct
Doctoral Thesis; University of British Columbia. February 2009. (B.C. Agricultural       the balance. Depending on the capacity and needs of the
Land Commission 2004).
                                                                                     6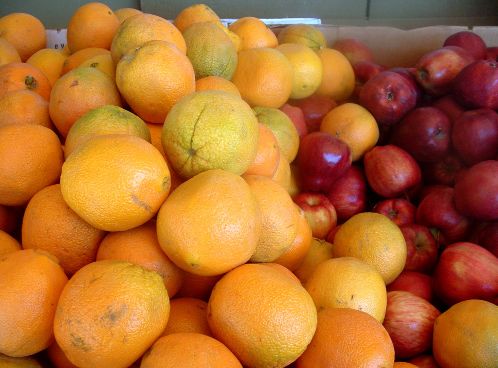
INDUSTRY PROFILE » GREEN TECH

producer, wholesaler or retailer, other supporting firms may
become involved. Brokers, shippers, processors, packers
and jobbers collaborate to efficiently move the aggregated
mix of commodities. Many of the supporting firms are well
established and utilize specialized equipment to prepare
goods for the retail market. While Figure A depicts a well
functioning supply chain, it also illustrates B.C.’s reliance on
imported regions (California and Mexico) to meet consumer
demand.x
Current Food System Design: Hotel and Restaurant Structure

                                                                                                                                                                            PHOTO: B NICHO PRODUCE
As nearly two-thirds of commercial food sales (60%) came
from retailers in 2005, food service establishments accounted
for the remaining 40%. The bulk of food service sales (90%)
xi
   are concentrated among Food Service Distributors (FSD’s)
that source directly from farms or value added producers.
Similar enterprises that support wholesalers in the retail
stream (processors, packers and shippers) also assist FSD’s
to deliver goods to restaurants and hotels. Two large FSD’s,
Sysco and Gordon Food Services (Neptune), command                                       consumption after losses have been adjusted for.2 On average,
between 60 and 65% market share. The network is illustrated                             it is estimated that 50% or 1,645,430 tonnes (2005) of fresh
in Figure B and shows relative market shares between local                              food disappears within Metro Vancouver before it reaches the
and imported food supplies.                                                             consumer.xii Food waste is calculated on a federal basis and
                                                                                        is not measured provincially. Therefore, it is assumed that
            Figure B: Producer to Restaurant Supply Chain                               B.C. and Metro Vancouver are representative of Canadian
                           Overview in B.C.                                             statistics. It should be noted, however, that estimates are
                                                                                        used to determine food availability figures, which makes data
    Mainstream Food Supply                                                              experimental. Regardless, the magnitude of food waste is
                                            British Columbia Growers                    important, as even slight reductions could yield significant
      (Imported Products)
                                                                                        economic benefits.

      Packers/                                                                          Figure C illustrates vegetable disappearance by category,
     Processors                                                                         derived from a report by Statistics Canada. The greatest
                                                                                        opportunity to reduce waste is within the fresh vegetable
                                                        Brokers
                                                                                        category, as over 90% of total disappearance comes from this
             Shippers                                                                   group.
                                                                                              Figure C: Food Availability - Vegetables by Major Group
                                                                                                                    Annual Kilograms per Person

              Wholesalers                                                                                                                                          Fresh/
                                                                                                        Fresh     Canned       Frozen       Juice      *Total
                                                                                                                                                                    Total
                                                                                         Total        137.62      12.8        5.71        1.33        178.21
                                                                                         Available
                                Food Service                                             Adjusted     67.72       10.83       4.46        1.13        101.5
                                 Disributors                                             after Loss
                                                                                         Loss         69.9        1.97        1.25        0.2         76.71       91.12%
                                                                                         Amount
               British Columbia Hotels & Restaurants                                     Loss %       50.79%      15.39%      21.89%      15.04%      43.04%
                                                                                         * In fresh, equivalent weight. Source: Statistics Canada, Food Statistics 2007 –
  Adapted from: Novacorp Consulting Inc. 2006. Guidelines for BC Food Producers          Catalogue no. 21-020-X
    & Processors on Selling to Food Service Distributors. Report prepared for the
   BC Ministry of Agriculture and Lands. http://www.al.gov.bc.ca/foodprocessing/        Furthermore, the report specified major fresh vegetable
      documents/foodservice_market/final_fsd_marketing_sales_manual.pdf                 availability per capita in Canada; with the top five illustrated
                                                                                        in Figure D on the next page. Potatoes represent the
Food Waste
                                                                                        2 Food available for consumption and is derived residually using supply-
Given the perishable nature of food, waste is inevitably                                disposition tables. All components of supply are added together and all uses
generated - most of which occurs at the producer level.                                 (disposition) other than human consumption are deducted. The resulting amount
Statistics Canada categorizes waste as ‘disappearance’ and                              is assumed to be available for human consumption. Loss of food at the retail and
                                                                                        household level is not calculated in the measure. Source: Statistics Canada Food
tracks ‘food availability’, which refers to food fit for human                          Statistics 2007.
                                                                                    7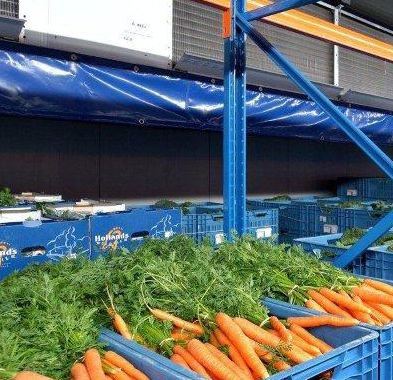
INDUSTRY PROFILE » GREEN TECH
greatest amount of estimated loss at 57% (36.85 million kg). Distribution Relationships
Adapting these figures among the top five commodities for Many large California and Mexico producers will not supply
the City of Vancouver translates to an estimated, aggregated Vancouver distributors on a seasonal basis and instead
disappearance of 31 million kilograms, with 72% of this demand year-round purchases that further solidify the food
coming from potatoes.3 Attempts to better understand specific system’s inflexible nature.xv Moreover, it is estimated that
value chain needs could reduce waste and provide better less than one-third of ingredients sold by large FSD’s are
fresh and processed food sales opportunities. from B.C.xvi – and approximately 25% for retail wholesalers.4
Figure D: Five Most Available Fresh Vegetables in Canada However, large distributors, such as Neptune and Sysco, are
(Annual kilograms per person) making incremental changes to their procurement policies
as a response to customer demand. For example, Neptune
100% is working with five area farms to reduce costs, guarantee
supply and meet demand for local products.
80% 2.74 2.93
4.3 4.21 Asian Networks
36.85
60% Alongside the mainstream distribution and wholesale
network, a parallel ethnic supply chain thrives in Metro
40% Vancouver, which reinforces the system’s rigid design.
4.61 5.24 Dominated by Asian wholesalers, the system is characterized
5.79
20%
4.47 28.22 by strong business relationships between inclusive members.
Many producers lack the ability to speak English that provides
language savvy wholesalers with a constant pipeline of supply
0%
Carrots Lettuce Onions Potatoes Tomatoes - to be distributed to buyers that demand niche or specialty
COMMODITY TYPE crop products.
Loss Total Available Food Processing
Source: Statistics Canada, Food Statistics 2007 - Catalogue no. 21-020-X
Producers of any size are subject to the same regulations
As mentioned earlier, the City of Vancouver and surrounding regarding market access of their primary processed
municipalities are forecast to experience significant growth commodity or value added product. Over time, large
by the year 2040. This growth will demand greater flexibility producers have been able to invest in infrastructure and
and functioning of current systems that must contend with equipment assets that create market-ready products.
land availability, seasonal growing capacity and consumer Conversely, many small producers and non-sophisticated
demands. Effective local land utilization and food waste suppliers lack the ability to efficiently and consistently grade,
management represent opportunities to increase food package and prepare products for market sales.
security and provide better economic returns to food system For crops determined to be cosmetically inferior or second
actors in Metro Vancouver. grade, access to processing options are few. Farmers are
1.2. Distribution either not aware of, or have not made attempts to connect
with horticultural processors in Metro Vancouver. Select
Distribution activities are central to maintaining a robust food processors have operational capacity and could create value
economy that provides consistent supply to meet consumer added products for the market, while also reducing food
demand. The current mainstream distribution network, waste.
while fragmented and complicated, is also rigid in its design.
Education
Large established networks operate independently from one
another, with long-established supplier relationships based Lack of producer education partly explains market access
on low cost, large volumes and consistent quality. Therefore, barriers and food waste. One small organic distributor in
small producers are faced with high barriers to entry and Vancouver, Discovery Organics, is educating small producers
must build relationships with distributors and wholesalers to with a manual that details buyer requirements.xvii The manual
gain market access. contains specific information to prepare goods for final sale,
An alternative distribution network also serves the market, such as grading, packaging and safety requirements. Thus,
but lacks scale advantages and consistent supply that producers can also plan better for direct sales opportunities
the mainstream system enjoys. Producers connect with like farmers’ markets and community or restaurant
consumers at venues like farmers’ marketsxiii, a direct supported agriculture (CSA / RSA’s).5 A study based out
marketing system that competing wholesalers perceive
4 Malkin Avenue Wholesaler – estimated 25% local, year-round supply.
as a limited threat to their business.xiv Issues that affect
Wholesaler would be willing to procure more local if price and quality improved.
distribution are relationships, processing, education, safety, May 15, 2009.
logistics and transportation. 5 CSA/RSA’s offer seasonal supply of fresh, reasonably-priced produce (often
grown using organic methods); direct relationship with the farmer growing their
3 Individual commodity loss per capita was multiplied by the number of people
food; an opportunity to learn about agriculture and local ecosystems; and a
in the City of Vancouver and aggregated among the five commodity types.
community-building connection with farmers, neighbors and landscapes. Source:
Vancouver population: 615,473. Source: http://www.bcstats.gov.bc.ca/DATA/pop/
http://www.leopold.iastate.edu/pubs/staff/files/csa_0105.pdf
pop/estspop.asp#totpop
8
INDUSTRY PROFILE » GREEN TECH

                                                                                                     border delays and equipment malfunctioning. Because of this,
                                                                                                     large wholesalers contend that imported products on average,
                                                                                                     have a shelf life of seven to eight days while local products
                                                                                                     have just two to five days.xx
                                                                                                     While technology enhances product shelf life and profitability,
                                                                                                     transportation costs are explicitly tied to the price of fuel
                                                                                                     and can negatively impact financial gains. For a typical
                                                                                                     35,000-pound shipment, trucking costs run $5000, which
                                                                                                     amounts to roughly 7 cents per pound.xxi Greenhouse gas
                                                                                                     emissions (GHG’s) further add to transportation costs by
                                                                                                     articulating a ‘real cost’ to society. Environmental externalities
                                                                                                     add 3% to the cost of local-organic food and 16.3% to the cost
                                                                                                     of conventional-global food.xxii Despite transportation cost
                                                                                                     disadvantages, large-scale farm production provides higher
                                                                                                     margins that continue to foster imported supply dominance.
                                                                                                     Summary

                                                                                photo: ATUL666
                                                                                                     Actors within the distribution system face a myriad of issues
                                                                                                     when supplying the complex marketplace in Metro Vancouver.
                                                                                                     Large international farms and seasonal domestic growing
                                                                                                     conditions heavily influence the mainstream supply chain,
                                                                                                     which makes imported supply the central source of fresh
of the Midwestern United States revealed that contracts,                                             fruit and vegetables. Local producers face financial obstacles
which require up front payment, provided CSA farmers with                                            to effectively compete and a select few are beneficiaries of
an average net return of $2,467 per acre.xviii This figure is                                        growing support from wholesalers and distributors. These
very high when compared with an average net return per                                               educational and economic investment mechanisms are
acre of $114.89 (same study) and would allow producers an                                            key for producers to build capacity and gain access in the
opportunity to invest in their business and build capacity for                                       sophisticated market.
further market sales. Corporate policy can also influence
local support. For example, the Happy Planet juice company                                           1.3 Farmers’ Markets
has a policy to procure 60% of its ingredients from local                                            Farmers’ Markets in the City of Vancouver have been
sources.                                                                                             widely supported by the general public over the last four
Food Safety                                                                                          years, enjoying 30 – 35% annual growth. These markets
                                                                                                     provide a crucial linkage between producers (60% must
Food safety issues underpin fresh and processed food sales.
                                                                                                     be agriculturally based)xxiii and consumers that promote
Appropriate washing and handling procedures, unbroken
                                                                                                     awareness of, and appetite for, local food. The markets also
cold chain activities and product traceability steps must be
                                                                                                     offer niche, value added products that represent ingenuity
followed to help mitigate public health issues like the spinach
                                                                                                     from the farmer and heighten the consumer experience. At
e-coli incident of 2006. The event caused 22 illnesses at Taco
                                                                                                     peak times, farmers’ markets operating under Your Local
Bell restaurants and forced the temporary closure of eight
                                                                                                     Farmers Market Society (YLFMS)7 receive over 10,000 visitors
restaurants. This resulted in substantial lost revenue and
                                                                                                     per week, which equated to vendor sales of nearly $4 million
public uncertainty of the Taco Bell brand.xix
                                                                                                     in 2008 – an increase of $1.1 million from the previous year.
Storage Facilities                                                                                   A recent study analyzing the impact of this sales revenue
Cold and dry storage facilities can provide producers with                                           reveals an overall impact of $10 million to the local and
access to market opportunities that extend the selling season,                                       regional economies.xxiv
such as refrigerated / frozen sales. However, the cost of storage                                    Vancouver based studies point to nearly three quarters of the
facilities can provide disincentives for local producers to expand                                   population that are willing to pay a premium for Canadian
operations, which allows existing, mainstream value chain                                            grown products, if they knew the premium would go to
members to maintain influence and market share.                                                      Canadian farmers.xxv Whether organic or local, consumers
Transportation, Logistics and Technology                                                             are willing to pay a price premium that often commands 25%
                                                                                                     more than conventionally grown produce.xxvi The markets
Similar to storage infrastructure, other technology can provide                                      create vibrant neighbourhood centres and influence other
benefits to the life of a product. Hydrocooling6 can lengthen                                        channels in the value chain by stimulating demand for
product shelf life and provide valuable, additional time in the                                      local goods. Current conditions of the network are strong,
transportation cycle for unintended transportation issues like                                       however future success is dependent on improving market
6 Hydrocooling is a technique where the vegetable is cooled by direct contact                        permanence, capacity, locations and operational regulations.
with cold water flowing through the packed containers and absorbing heat
directly from the produce.                                                                           7 YLFMS is also known as Vancouver Farmers’ Markets (VFM).
                                                                                                 9
INDUSTRY PROFILE » GREEN TECH

Market Permanence                                                             chain stores and restaurants that source outside of the local
Farmers’ markets, when held in public spaces, are subject                     market and leak revenues back to head offices locations.
to re-location risk. Market space could be withdrawn by the                   The following cases illustrate the effect that farmers’ market
city to fulfill municipal obligations or provide opportunities                spending has on the local economy.
that run counter to farmers’ market success. All market                       Farmers’ Market Case Studies
locations must apply for annual leases, which is unlike other
                                                                              > Case Study 1: UNBC Consumer Focusxxvii
municipalities in the province. Lack of market permanence
also prevents long term planning and the ability to attract                   A University of Northern British Columbia (UNBC) study
quality farmers. As a result, the Executive Director spends                   attempted to quantify the impact of farmers’ markets in B.C.
50% of their time applying for market licenses and permits,                   The study analyzed consumer surveys to estimate benefits
each year. At the same time, leases from private landholders                  of markets and forecast economic benefits to adjacent
can lapse and place the society at risk for future operations.                businesses from increased pedestrian traffic at the farmers’
When a market is forced to re-locate, YLFMS faces costs                       market.
between $25,000 and 35,000 due to increased advertising,                      Results: Farmers’ markets were found to create total
labor and administration expenses.                                            province wide activity of $65.3 million (based on direct
Market Capacity and Locations                                                 spending of $32.63 million and a multiplier of 2.0.)8 Equally
                                                                              important is the effect that farmers’ market traffic has
Successful farmers’ markets have created more demand
                                                                              on adjacent business. On average, consumers spent an
from vendors than can be accommodated at market locations,
                                                                              additional $19.22 at businesses located near the markets for
which is stifling growth opportunities. In addition, areas within
                                                                              a total of $53.3 million. The study also revealed that nearly
the city are underserved, in part because of reliance on the
                                                                              80% of market visitors came to the area because of the
existing system and in part of extensive city regulations that
                                                                              markets.
limit permissible farmers’ market zones. In future, locating
farmers’ markets closer to neighborhood-level retail and                      > Case Study 2: Vendor Focus
Business Improvement Association zones would create more                      The US-based Project for Public Spaces’ report, Estimating
synergies with local retailers (see below) and create vibrant                 the Economic Impact of Public Marketsxxviii, considers
neighborhood hubs. Vancouver’s Summer Spaces program                          examined economic impacts from the perspective of a
and neighborhood street closures are providing an opportunity                 market purveyor (fresh food or prepared). American farmers’
to test this in Vancouver’s Gastown neighborhood.                             markets were assigned to categories based on population
Operational Regulations                                                       and analyzed according to purveyor expenditures. According
                                                                              to the study, Vancouver would be considered a large city
The regulatory framework is complicated, given three
                                                                              (greater than 1 million inhabitants) and therefore, highlights
separate levels of government involved with authorizing and
                                                                              are selected based on that criterion. Figure E explains
regulating public markets. The Vancouver School Board, City
                                                                              average annual expenditures per vendor type and the related
of Vancouver Planning / Engineering Department and the
                                                                              effects of those expenditures in the local area.
Vancouver Board of Parks and Recreation all can play a role
in affecting operations of current markets
                                                                             Figure E: Large City Market Information
and locations of future markets.                                                              Large City Market
Restrictions based on signage are one
                                                                                                                               Large City
of the biggest operational barriers that        Vendor Type
                                                                             Number of  Average               Market
                                                                                                                             Vendor Impact        Total Impact
the farmers’ markets face. Rather than                                        Vendors Expenditures            Spend
                                                                                                                               Multiplier
providing YLFMS with signage consent,           Producers                       20            $1,252          $25,040             0.11                $2,754
city officials ‘turn a blind eye’ to this       Non-producers                    5             n/a              n/a                 n/a                n/a
advertising method, which re-enforces
                                                Prepared Food Vendors            8          $128,382        $1,027,056             1.61            $1,653,560
market uncertainty. Parking, public health
& safety issues also impact the markets’        Other types                     13           $55,548         $722,124              0.68             $491,044
ability to attract customers and provide        Vendor Total                    46                          $1,774,220                             $2,147,359
sales opportunities to vendors. Permissive      Market Management                                            $100,000              2.27             $227,000
bylaws around locations and signage             Market Total                                                                                       $2,374,359
would enable YLFMS to better serve the
community and all stakeholders involved
                                                                              Result: The overall impact of one large city farmers’ market
with the farmers’ markets.
                                                                              is estimated to amount to over $2.3 million per year – which
Farmers’ Market Economic Impact
Farmers’ markets provide the local economy with many                          8 Provincial market spend was $32.63 million. Researchers estimated the
                                                                              multiplier to be 2.0 based on other research reports and are experimental.
functional and emotional benefits. Numerous studies (see
                                                                              Multiplier refers to the amount of extra investment in the community from an
below) illustrate how the local economy benefits from direct                  initial spend. E.g. a multiplier of 2.0 denotes that for every dollar spent in a market,
and indirect spending at markets, rather than supporting                      an extra dollar is re-spent within the community.
                                                                        10
INDUSTRY PROFILE » GREEN TECH
includes direct, indirect and induced spending resulting from
vendor involvement. This is close to the amount generated by
Vancouver’s Trout Lake Market.9
> Case Study 3: Growing Portland Farmers’ Marketsxxix
A Portland study measured the impact of five farmers’
markets in terms of direct, indirect and induced activities.10
The total economic impact from spending at these five
farmers’ markets in Portland was $11.2 million – illustrated
in Figure F. Thus, the result of $7.7 million in direct spending
at these five markets spawned an additional $3.5 million of
indirect and induced purchases. Figure F also relates the
markets’ impact on employment for the region, supporting 95
employees earning nearly $2 million in wages.
photo: QUSIC
Figure F: Total Impact at Five Prototypical Portland Markets (2007)
5 ‘Typical’ Portland Markets: Hillsdale, Hollywood, Lents, Motaville, PSU
Direct Indirect Induced Total Impact
Output ($) 7,702,434 2,144,381 1,350,409 11,197,224
1.4 Value Added Production
Employment 69.20 14.80 11.60 95.60
(FT & PT employees) Value added products are the result of further processing to
primary processed ingredients. Consumers are increasingly
The study also analyzed the impact of a dollar spent on purchasing local value added products because of their
imported products at a traditional grocery store11 compared health benefits (less commercialized production) and quality.
with a farmers’ market. Most of the farmer’s economic Recognition of quality value added products translates to
impact is not retained locally and is ‘leaked’ outside of the higher willingness to pay. At the same time, producers and
local economy. Through the utilization of IMPLANxxx , it is entrepreneurs are enjoying higher economic returns as they
estimated that the direct impact of spending at traditional create more artisanal type products that respond to consumer
grocery stores is $3.4 million instead of $11.2 million from demand. Farmers’ market expansion over the last few years
farmers’ market spending. As noted above, this is similar to has helped niche producers gain market access to sell their
the numbers for Vancouver.12 value added goods directly, instead of through wholesalers
and distributors where margins are not as lucrative.
Summary
While many niche producers are enjoying success in British
Farmers’ markets in the City of Vancouver provide many Columbia, they are a clear minority. Large internationally
social, environmental and economic benefits. Popularity of based processors dominate the local market, as their low cost
the markets has never been higher, which has translated inputs and expansive manufacturing scale provide a distinct
to record attendance and vendor revenues. Consumers advantage for their products.xxxi These large processors
are willing to support and pay more to local farmers and have moved to areas with lower labour costs that provide
artisans for their high quality, fresh and value added better profitability despite the higher transportation costs
products. Economic studies demonstrate the impact of to bring products to the Vancouver market. Subsequently,
farmers’ markets. However, for farmers’ markets to continue Metro Vancouver and Lower Mainland producers are left with
to flourish, official recognition of markets and permissive relatively few options to introduce processed local goods to
regulations are required from relevant bodies, which would the market, especially given high start up capital costs for
allow the markets to operate more efficiently and to better processors. This cost structure leads to ‘boutique’ products,
supply underserved areas. which are most frequently purchased by consumers with a
9 YLFMS’ 2008 annual report shows that market management had expenses high willingness to pay.
of $285,117. If the same multiplier (2.27) from Figure E is used, and purchases are Despite existing market challenges, strong consumer demand
made within the city, the local impact for Vancouver is estimated to be nearly
$650,000. provides incentives for producers to enter the value added
10 Direct (first round) spending represents customer purchases; Indirect
product market. Vista d’Oro Farms, a local producer from
spending defines subsequent round spending as a result of the farmers’ market Langley, has built a strong value added component to their
and farming activities – seed and equipment; Induced spending is the re-spending business. Partnerships with buyers have allowed the farm to
of wages paid in the direct and indirect category – personal spending by market re-invest by adding storage facilities and processing features
workers or farmers. to the farm. A partnership with Vij’s restaurant provided
11 ‘Traditional’ grocery store assumes ownership and products procured outside Vista d’Oro with sales of its entire tomato crop and Vij’s with
of the local region
a quality, local ingredient for the restaurant’s menu. This
12 B.C. Farmers’ Markets generated $125 million to the economy in 2008. Of partnership has minimized food waste and has also created
that, 8% is attributed to Vancouver, which equates to a $10 million impact. Source:
Vancouver Farmers Markets Breakfast Briefing, June 11, 2009. a higher economic multiplier from restaurant spending in the
11INDUSTRY PROFILE » GREEN TECH
local economy. Further, Vista d’Oro’s investments in value face challenges bringing their products to market because
added products have created differentiated, high quality of requirements from chain retailers and food service
preserves that are now sold in Whole Foods Markets. distributors. Distribution companies like Biovia and Discovery
Summary Organics are seeking ways to outfit local producers with
necessary skills to supply buyers with their specific needs.
Lack of processing facilities in Metro Vancouver hinders the As a result, retailers and restaurants are including locally
development and introduction of local, value added products differentiated products in their product mixes or menus, as
to the economy. However, with the correct equipment, illustrated by the Vista d’Oro farms/Vij’s example above.
resources and entrepreneurial spirit, local producers can
Buyer Inertia
take advantage of high consumer willingness to pay and
can compete against mainstream producers in the local Few supermarkets and restaurants source significantly from
market. The introduction of a shared production facility or small farmers and local value added producers. Many vendor
partnerships could leverage further strategic investments for relationships have been built over time and some restaurants
the local economy. and retailers are reluctant to change procurement patterns.
Large wholesalers have the capacity, flexibility and resources
1.5 Demand Drivers: Supermarkets & Restaurants to supply buyers with whatever their needs are. Restaurants
As the main market buyers for fresh and prepared food, and retailers remain loyal to suppliers to save time. Unless
supermarkets and restaurants have significant influence major policy changes occur from purchasing directors or
over the origin of their supply. Successful operations head chef / restaurant proprietors, supply procurement
are committed to strong partnerships that ensure safe, generally remains ‘business as usual’.
consistent, high quality supplies of food that benefit the Contracts
buyer as well as the grower. Not surprisingly, locally owned
restaurants and supermarkets more frequently support local Food production contracts at the local level, whether CSA in
producers when compared with their non-local counterparts. design or not, are an important mechanism to generate and
For example, Bishop’s restaurant actively supports local retain wealth in the local economy. At minimum, contracts
producers by sourcing local as much as possible. While costs provide producers with a guaranteed market for their goods
are ‘painfully higher’ at 3–6%, local product of high quality and allow buyers to receive guaranteed supply (weather
is a main differentiating factor for the restaurant.xxxii This permitting). As stated earlier, CSA and RSA agreements
commitment can create higher brand value, as was realized provide buyers and sellers the opportunity to share risk
in a study of Switzerland McDonald’s restaurant. Among and reward in seasonal crop production. These agreements
locals and non-locals, the study revealed that featuring local are starting to take hold, but many buyers cite cash flow
products is being an effective way to improve brand value. challenges (payment must be made in advance) and storage
xxxiii
Like that of Bishop’s, local food costs were higher, but the of crops as being two main reasons for lack of uptake –
company witnessed more frequent visits and thus, greater especially from restaurants.xxxvi Further, crop uncertainty and
sales revenue. quality issues are barriers for contract adoption.
Summary
At the same time, food costs support the driving rationale
for restaurants not supporting local; it all comes down to Restaurants and supermarkets have the opportunity to
economics in a highly competitive industry with razor thin effectively ‘pull’ ingredients through the supply chain.
margins.xxxiv The same can be said for supermarkets and Senior management and owners are central to this shift.
food retailers, unless costs remain low to stay competitive in Engaging in this practice requires a detailed assessment of
their peer groups, imported food will continue to be featured. the firm’s activities and can be used as a part of their selling
Factors that impact both supermarkets and restaurants proposition, in order to efficiently overcome the many barriers
are administrative support, supply factors, communication that exist to changing ‘business as usual’ practices.
practices, education, buyer inertia and contracts.
1.6 Institutional Buying
Administration & Supply
Public institutions such as schools and hospitals require
Many large purchasers have consolidated buying practices significant supply to feed students and patients respectively.
for ease of delivery, food safety issues, traceability of product Large distribution networks supply consistent, processed
and streamlined bookkeeping. Dealing with many different product sourced from industrial producers in the United
local producers is time consuming and costly. One large States and Mexico. As stated earlier, institutional farms
chain supermarket manager stated that for small producers require wholesalers and distributors (who supply institutions)
to be considered a supplier, they must be able to meet chain to purchase product throughout the year, which can impact
demand from all of its 70-plus stores in British Columbia.xxxv local producers seeking to supply the market in peak season.
Communication & Education
Established relationships between institutions and
Successful relationships between buyers and producers distributors meet cost efficiency needs and ingredient
create synergies to enhance local investment through requirements of the system (e.g. washed, peeled carrots).
market access and improved capacity. Small producers These requirements act as barriers for small-scale producers
12INDUSTRY PROFILE » GREEN TECH
with limited resources.xxxvii The publicly funded Vancouver system keeps costs high. Seasonal land utilization also
School Board (VSB), which has a food service contract with hinders the ability to attract capital investment to a region
Neptune Food Services, could request a greater local food where land costs are already high and makes profitable
component in its supply that would create economic benefits farming difficult. The system also lacks effective collaboration
to the local economy. For example, public institutional buyers and support facilities to build producer knowledge, growing
in other regions have recognized the impact of undertaking capacity and differentiated products.
favourable local purchasing requirements13 that stimulate
From buyer and seller perspectives further along the value
investment into local capacity.
chain, market and regulations limit the ability for local goods
The Vancouver Convention and Exhibition Centre (VCEC) has to reach consumers on a large scale. With the exception of a
made local purchasing a requirement for its operations. The few, buyers of all types (retail, restaurant, institutional) lack
institution purchases local ingredients wherever possible, enthusiasm to support local producers. Thus, gaps in support
including 12,000 heads of hothouse butter lettuce, 18,000 activities (processing, storage, education) along with sales
bottles of B.C. wine and over a ton of local mushrooms on opportunities (underserved areas, food service flexibility)
an annual basis. The VCEC has higher margins than most persist in Metro Vancouver. This structure continues to
competitors, which provides room for higher costs sometimes support the mainstream system where investment returns to
associated with local food.xxxviii Further, relative to the protein international company headquarters, instead of remaining in
portion, vegetable and starch portions impact final costs to a the local economy.
lesser extent.
The Director of Food and Beverage of the VCEC believes that
local purchasing is the ‘right thing to do’ to both celebrate 2. Case Studies
B.C.’s horticultural abundance and ensure long-term
sustainability of supply. The VCEC prepares meals through In order to look at how barriers have been overcome in this
its ‘scratch kitchen’, which features fresh local food and and other jurisdictions, case studies of the Granville Island
requires skill to prepare, instead of offering processed dishes Public Market and Portland, Oregon have been undertaken.
that require little preparation. This commitment reduces 2.1 Case Study: Granville Island Public Market
product packaging and energy costs normally associated
with preparing processed food. More importantly, the The Granville Island Public Market provides locals with a
focus on skill development provides the VCEC with lower prime location for food and entertainment and is celebrated
employee turnover, which saves the company in training and as one of the major tourist draws for B.C. The market is
recruitment costs. visited over 12 million times annually, which is estimated to
be 70% local and 30% tourist traffic. Granville Island serves as
Summary a useful benchmark because of its strong retail composition,
Institutional purchases could benefit the local economy operational structure and sound relationships with value
significantly. Because of the sector’s scale, institutions that added purveyors.
buy locally could redirect tens of millions of dollars in direct, Granville Island management supports the local food
indirect and induced spending back into the local economy. A movement and further diversifies its product mix by providing
movement in this direction would also allow local producers use of day tables one day a week to local producers and value
to scale up fresh, local supply that responds to market access added purveyors. Overall, retailers within the market respond
and opportunities. positively to day table competitors because of the increased
interest and traffic they provide.
1.7 Summary: Barriers & Gaps Within the Vancouver Food System
Cold Storage Study
This section has identified many barriers and gaps in the
current food system in Metro Vancouver. International supply For many food retailers, cold storage is necessary
conglomerates control relationships with buyers because infrastructure. Therefore, it is useful to understand how much
of their need for constant demand and British Columbia’s cold storage is required for certain business’ operations.
geographic inability to provide consistent, year-round supply. Granville Island Public Market tenants pay for cold storage
Seasonal growing conditions underpinned by static demand as a blended cost with their rent and some tenants pay
and family farm origins, provide disincentives for producers for additional storage on an as-needed basis. Appendix
to align and reach a critical growing mass. This fragmented 1 illustrates cold storage square feet and is detailed per
tenant and category, which consists of tenant display
13 Food to Campus project in Conway, Arkansas (1987) saw a redistribution space, supporting cold storage (refrigerators and freezers)
of $200,000 back into the local economy, citing food procurement changes: and communal cold storage spaces. Overall, cold storage
President’s Council on Sustainable Development (PCSD) (1997) Sustainable
Communities Task Force Report, Available on-line: represents 12.2% of the public market footprint, out of a total
President’s Council on Sustainable Development (PCSD) (1997) Sustainable 41,339 Square Feet (sq. ft.). The full breakdown can be found
Communities Task Force in Figure G.
Report, Available on-line: http://clinton2.nara.gov/PCSD/Publications/suscomm/
suscoc-am.html Granville Island management separates its tenants into nine
C/o Vancouver Food System Assessment (2005) Barbolet et al. categories: Bakeries, Butchers and Poultry, Seafood, Produce,
13You can also read