The Effect of Fair-trade on Customer Loyalty - Fair-trade in the Fashion Industry
←
→
Page content transcription
If your browser does not render page correctly, please read the page content below
Fair-trade in the Fashion Industry

The Effect of Fair-trade on Customer
Loyalty

Deborah Duijndam
Faculty of Economics
Master in Marketing
Student number: 317167
Email: Deborah_Duijndam@hotmail.com

Supervisor: Drs. M.N.G. van Ginkel
Second reader:

                                      1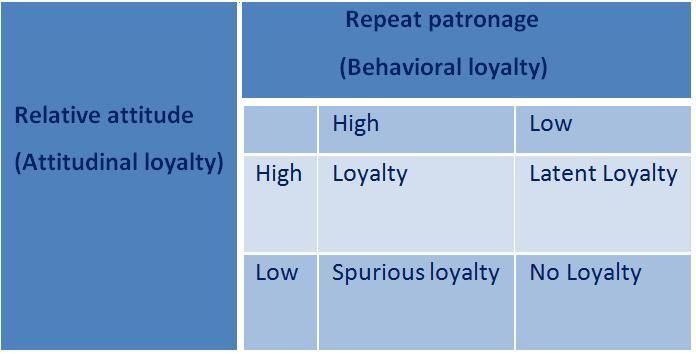
Acknowledgement

This thesis would not have been possible without the help of some people with both content and mental
support in stressful times. Therefore I would like to thank a number of people.

First I am heartily thankful to my supervisor, Mirjam N.G. van Ginkel, whose encouragement, guidance and
support from the initial to the final level enabled me to develop this report. I really appreciate that she gave me
the chance and the confidence to investigate a subject that had my personal interest.

Furthermore I am very grateful to Carlos J.S. Lourenco for the help that he offered me to understand the
necessary statistical methods and for the special support of Eilien Monsma. She helped me not only by
discussing the data, but also by giving moral support. Without her support I would not have managed to write
this thesis like I have done.

Subsequently I want to thank Yvonne Beyer for her support with writing in English.

Lastly, I offer my regards and blessings to all of those who supported me in any respect during the completion
of the project. In special I want to thank my parents Ans en Bart, my sisters Corina and Joyce, my friends
Marscha, Liset, Rianne, Marion, Sanne and my boyfriend Denis and last but not least all my roommates of the
Koornmarkt.

Deborah Duijndam
10 December 2010

                                                                                                                 2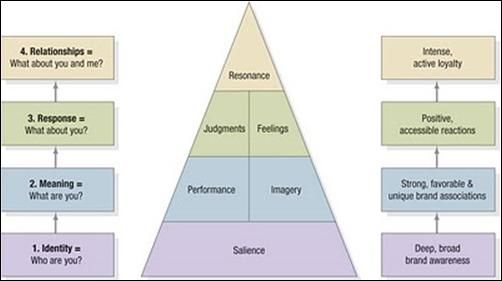
Table of Contents

Chapter 1       Introduction                         5

Chapter 2       Loyalty                              7
  2.1           Introduction to loyalty              7
  2.2           Behavioral and attitudinal loyalty   7
  2.3           How loyalty arises                   9
  2.4           Non-attitudinal sources              10
  2.5           How to measure loyalty               12
  2.6           Conclusion                           15

Chapter 3       Fair-trade & Fashion Industry        17
  3.1           Introduction                         17
  3.2           Fair-trade in general                17
  3.3           Distribution channels                18
  3.4           Made-By                              18
  3.5           Quality mark                         19
  3.6           Scorecard                            19
  3.7           Brands                               20
  3.8           Recent facts & figures               21
  3.9           Conclusion                           22

Chapter 4     Hypotheses and Methodology             23
  4.1         Introduction                           23
  4.2         Part 1: Behavioral loyalty             23
   4.2.1      Hypotheses                             23
   4.2.2      Methodology                            25
      4.2.2.1 Retailer                               25
      4.2.2.2 Brands                                 25
      4.2.2.3 Variables                              25
      4.2.2.4 Statistical tests                      27
  4.3 Part 2: Attitudinal loyalty                    28
   4.3.1      Hypotheses                             28
   4.3.2      Methodology                            30
      4.3.2.1 Respondents                            30
      4.3.2.2 Variables                              30
      4.3.2.3 Statistical tests                      32
  4.4         Conclusion                             32

Chapter 5       Investigation part 1                 33
  5.1           Introduction                         33
  5.2           Part (a) Repurchases                 33
   5.2.1        Repurchases continuously             33
      5.2.1.1   General findings                     33
      5.2.1.2   Chi Square test                      34

                                                          3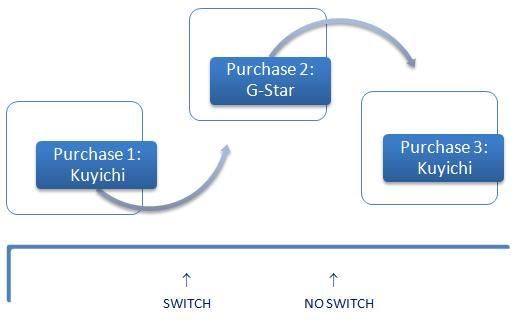
5.2.1.3   Distribution of repurchases discontinuously              36
   5.2.2        Repurchases discontinuously                              37
      5.2.2.1   General findings                                         37
      5.2.2.2   T-Test within one group                                  38
      5.2.2.3   Distribution of repurchases discontinuously              39
  5.3           Part (b) Retention rate                                  40
   5.3.1        General findings                                         41
   5.3.2        Chi Square test                                          41
   5.3.3        Distribution of switches                                 42
   5.3.4        Limitation variable switch                               43
   5.3.5        Single purchases                                         43
  5.4           Conclusion behavioral loyalty                            44

Chapter 6       Investigation part 2                                     46
  6.1           Introduction                                             46
  6.2           Brand knowledge                                          46
   6.2.1        Level of passive knowledge                               46
   6.2.2        Level of active knowledge                                47
   6.2.3        Conclusion                                               49
  6.3           Brand attitude                                           49
   6.3.1        Attitude strength                                        49
   6.3.2        Attitudinal differentiation                              51
   6.3.3        Relative attitude                                        54
  6.4           Word of mouth intensity                                  56
   6.4.1        Number of recommendations                                57
   6.4.2        Net-promoter rate                                        57
  6.5           Conclusion attitudinal loyalty                           58

Chapter 7                                                                61
  7.1           Introduction                                             61
  7.2           Important findings                                       62
  7.3           Managerial implications                                  63
   7.3.1        Managerial implications fair-trade in fashion industry   63
   7.3.2        Managerial implications Kuyichi                          64
  7.4           Further research                                         67
  7.5           Conclusion                                               69

Chapter 8       Limitations                                              70

Chapter 9       References                                               73

Chapter 10      Exhibits                                                 78

                                                                              4
Chapter 1           Introduction

The literature of today has mostly considered loyalty as a notion of consumers being exclusively loyal to one
single brand. However, with the disproportionate growth in the number of competing product alternatives in
the last decade, a clear decrease is observed in the number of loyal customer who purchase one brand only
(Yim, Kannan, 1998). Many consumers have more than one favorite brand, which results in a division of loyalty
among a few brands. Still, even when loyalty is more difficult, and therefore also more expensive to achieve,
                                                         1
loyal customers ensure the existence of the company . The Pareto principle, which it is still not proved untrue,
states that 80% of sales is generated by 20% of the customers. This shows how important loyal customers are.
Companies need to find out who are those 20% of loyal customers? But even more important, what drives this
20% to be loyal to my brand?

Fair-trade has been in existence for more than 40 years and has become a very successful niche market. But in
recent decades, a significant growth in the number of ethically aware consumers has caused a strong demand
for socially and ecologically sustainable products, not only in the niche markets, but also among the masses
(Barrientos, Conroy & Jones, 2007). Therefore you would expect that significant marketing research has been
done on fair-trade products, but unfortunately the opposite is true. The written literature is limited and mainly
focused on the production processes and price sensibility. Subsequently the greater part of the research is based
on the food industry and other products and industries are barely discussed. This is most likely caused by the
fact that limited marketing data is available, which arises from the fact that the mainstream market is buying
fair-trade only since the last decade.

The combination of the difficulty and the importance of retaining customers, with the upcoming fair-trade
market, seems like a big opportunity. Since there is less competition in the fair-trade market it can be easier to
distinguish from other brands. Secondly, because of the fact that it is a ‘social responsible good’ with a
different production process, a higher level of consumer commitment can be formed. Information about the
brand can be provided what leads to higher knowledge levels, hence better-informed and considered choices.
Having said all this, it can be expected that in fashion industry, fair-trade can be the solution to achieve higher
loyalty levels.

The goal of this thesis is to determine whether there is a positive connection between the customer loyalty
level and fair-trade. This will be done in a few steps. First the literature of loyalty will be discussed, what will be
followed up by discussing the fair-trade market in general and later also with regard to the fashion industry.
The combination of both research areas will be the base of this thesis.

1
    Loyalty has a positive effect on market share and relative price (A. Chaudhuri & M. B. Holbrook, 2001)

                                                                                                                     5
When the research framework is composed by means of the previous discussed, the second part of this thesis
will start. To determine whether fair-trade leads to higher loyalty levels, two investigations will be done. This
research structure is derived from the theory earlier discussed. In these investigations two brands will be
compared: a fair-trade brand (Kuyichi) versus a normal produced brand (G-Star).

Having done both investigations, the thesis will end by concluding whether fair-trade can be used to achieve
higher customer value by increasing the customer loyalty level. The conclusion will be based on the results of
both investigations. Subsequently recommendations will be drawn. Those will be directed to the fair-trade
market in general, but also specific to the fair-trade brand itself. Both with the aim to increase the current
loyalty levels by adapting the fair-trade trend. Subsequently suggestions for further research will be given.

                                                                                                                6
Chapter 2         Loyalty

This thesis investigates a possible connection between fair-trade and brand loyalty. Therefore, this chapter
extensively discusses the theory of loyalty, which will be the basis for the analysis in the following chapters of
this thesis.

2.1      Introduction to loyalty
The ultimate goal of many corporate initiatives is to maximize profitability. Customer loyalty is one of the
means to achieve that. True loyal customers are customers who feel so strongly that the company can best
meet his or her relevant needs that the competition is virtually excluded from the consideration set: these
customers buy almost exclusively from the company (Shoemaker and Lewis, 1999). This definition implies that
‘true’ customer loyalty is more than just customer behavior. It is difficult to build, and most important, to
sustain without including the underlying attitudinal aspects of the customer that drive customer behavior. This
is why customer loyalty will be divided in two parts: attitudinal and behavioral loyalty (George and Wensley,
1998). Both are important elements of the total loyalty level to a brand. This chapter will further explain the
underlying theory of both attitudinal and behavioral loyalty. Further, it will discuss the process of how to
develop loyalty, the external influences on that process and it will discuss several methods to measure loyalty.

2.2      Behavioral versus attitudinal loyalty
As discussed before the theory of loyalty makes a very important distinction between attitudinal and
behavioral loyalty. Firstly, the definitions of loyalty and its two varieties are given to clarify these terms.

         True loyalty is the preferential attitudinal and behavioral response toward one or more brands in a
         product category expressed over a period of time by a consumer (Engel and Blackwell, 1982 ).

         An attitude is an association between an object and an evaluation. The extremity of the attitude
         reflects the position of the object along a continuum of favorability (Ajzen and Fishbein, 1980).

         Behavior is the manner in which one behaves, the actions or reactions of a person or animal in
         response to external or internal stimuli (http://www.thefreedictionary.com/behavior, Dec 2010).

These definitions show that the two kinds of loyalty are very dissimilar. Whereas attitudinal loyalty represents a
higher-order, or long term, commitment of a customer to the brand, behavioral loyalty of a customer focuses
on the profitability of the customer to the brand, which is translated in purchases behavior. The problem of
behavioral loyalty is the fact that differences in behavior are not necessarily caused by the level of loyalty, but
can also be caused by habits or promotion activities. This is exactly the reason why only measuring and
increasing the level of behavioral loyalty is not comprehensive enough. So in order to achieve ‘true’ loyalty,

                                                                                                                   7
firms should simultaneously focus on building both behavioral and attitudinal loyalty (Engel And Blackwell,
1982).

The two kinds of loyalty also have different goals. Behavioral loyalty is important to companies for generating
profitability, whereas attitudinal loyalty helps companies to build an invisible exit barrier for their customer.
The invisible exit barrier is especially important for non-contractual situations where switching costs are low.
To measure both levels of loyalty, different indicators are used. Behavioral loyalty is mostly measured in
purchase behavior, which gives direct and tangible returns to the firm. In contrast, attitudinal loyalty is far
more difficult to determine because quantifying the positive attitude strength of a customer is difficult.
Secondly, it needs to be complemented with high attitude differentiation (Ajzen and Fishbein, 1980). This is
necessary because by only determining the attitude strength, it is not possible to conclude anything about
potential loyalty level since the consumer can have this (for example positive) attitude towards all brands. To
combat this, comparisons between brands should be made:

          A comparison of brands that are viewed by consumers to be relevant in a given consumption context is
          called a relative attitude (Ajzen and Fishbein, 1980).

Incorporate relative attitude in a loyalty-model is a better way to indicate repeat patronages than just the
single brand attitude in isolation. Namely, by doing this the loyalty level will be directly compared to competing
brands, which will lead to better and more realistic understanding of the attitudinal level. To measure this
properly, an attitudinal differentiation matrix is made (Kumar and Shah, 2004), see exhibit 1. This matrix can be
filled in per customer for each product, which will allow for the measurement of the level of relative attitude.
(The matrix is also shown on the next page.)

As is shown in the matrix on the right, the
relative attitude is highest when the target
entity is associated with a strong attitude
and is clearly differentiated in the
consumer’s mind from the other brands
with weak attitude. In other words, the
relative attitude is the highest when both
the      attitude     strength     and       the
differentiation     are   high   (red    circle).
Furthermore, it is noteworthy that loyalty
may be achieved at both low and high
levels of attitude strengths, especially
when target consumers perceive differences in competing brands. A weak but positively differentiated attitude
may lead to higher loyalty than a very positive but undifferentiated attitude. Therefore, using the relative

                                                                                                                8
attitudes of customers will increase the ability to predict their loyalty. This theory forms an important basis in
this thesis for how to determine the attitudinal loyalty.
In exhibit 1 the second figure (1.2) shows the different levels of relative loyalty (Dick and Basu, 1994). The
figure first shows the same distribution as Kumar and Shah used, but is expanded with a matrix that is made to
determine the overall loyalty level. These theories do not conflict and can therefore coexist.
2.3 How loyalty arises
In the previous part, the division of loyalty in behavioral and attitudinal is extensively explained and discussed.
This distinction will be the starting point of how to create sustainable loyalty and hence higher profitability
(Kumar and Shah, 2004). This is an important consequence, since by determining and increasing both levels of
loyalty, companies to accomplish better results.
Kumar and Shah created a conceptual framework that gives some insight in the way sustainable loyalty can be
achieved and measured. They use three steps (see exhibit 2):
1. Building and enhancing behavioral loyalty
2. Cultivating attitudinal loyalty
3. Linking loyalty to profitability
The first part of the model that is shown below (the red square in exhibit 2) will be the base of the analyses
that is included in this thesis. As is shown in the model, two analyses will be used. The behavioral loyalty will be
determined by analyzing purchase behavior and a survey will be done to measure the attitudinal loyalty. Part of
the model is shown below to clarify this.
The outcomes can give us some insight into the loyalty level. To classify the results, the second part of the
model will be used (shown on the next page and in the blue square in exhibit 2). This is done by implementing
the results in both matrices.
9The previous will be followed up by some recommendations on how to improve these levels in the future.
These recommendations will be based on the third part of the model (shown below and also the light blue
circle in exhibit 2).
The above figure shows that based on the results, recommendations can be given to navigate the customers to
the appropriate box with a reward. This will be the box with both a high relative attitude and a high repeat
patronage (so the box with the highest loyalty level). When this is the case, sustainable profitability will be
3
achieved .
2.4 Non-attitudinal sources
An important goal for a company is to create and enhance the loyalty level of its customers. This sounds easy,
but building a sustainable and loyal customer does not occur overnight, but is a lengthy and continuous process
(Dick and Basu, 2004). The process of creating and maintaining loyalty is
described in the framework that is included in exhibit 3. This framework
is based on the assumption that loyalty is the relationship between an
individual relative attitude and repeat patronage, which makes this
theory consistent with the previous models discussed in this thesis. The
difference between this model and the previously discussed ones is the
fact that this model is extended with social norms and situational
influences. The social norms and the situational influence can be seen as
moderators (see figure on the right).
3
The total framework is shown in exhibit 2
104
There are two different but related kinds of social norms :
Behavioral norms (also known as descriptive norms) refer to the most common actions or behaviors
actually exhibited in a social group. Thus, the behavioral norm is what most individuals of a social
group actually do (applicable for behavioral loyalty).
Attitudinal norms (also known as injunctive norms) refer to the most widely shared beliefs or
expectations in a social group about how people in general or members of the group ought to behave
in various circumstances (applicable for attitudinal loyalty).
Situational influences can be described as:
Situational factors consist of temporary environmental factors that form the context within which a
consumer activity occurs at a particular place and time. Think of: physical surroundings, social
surroundings, time, task definition and antecedent states (Belk, 1974).
The previous states that moderators, such as situational factors and social norms, will influence the
relationship between a customer’s attitude and his/her behavior. This is because perceived behavioral norms
or role requirements, if contrary to an attitude, might render it unrelated to behavior (Wicker and Ehrlich,
1969). This means that consumers might behave differently than they wanted because of decisions influentials.
Secondly, several situational factors may impact on loyalty, for example stock outs and price promotions of
competing brands. How large the influence is, depends on the relative attitude. The stronger the relative
attitude towards a brand, the more likely the individual is to overcome countervailing social norms and/or
situational influences. Although this sounds logical, it is important to assess the characteristics of a market in
terms of the influence of relative attitude on one hand and situation/social factors on the other. This insight
allows marketers or managers to determine an appropriate focus for actions.
It can be stated that the one with the lowest influence on non-attitudinal sources (so social norms and
6
situational influences) is ‘Loyalty ’, and therefore the preferred one. The highest concern for marketers is
‘latent loyalty’. This level has a high relative loyalty but a low level of repeated patronage. It implies that the
situational effects are at least equal if not more influential than attitudes in determining patronage behavior.
This is difficult to control, and therefore in this case the company should focus its marketing efforts on
situational influences (Dick and Basu, 1994). It is assumed that for every market and product different
situations may arise. Dick and Basu (1994) already made such a matrix that shows its own appropriate strategy
for each outcome (Exhibit 4).
4
NSNI, National Social Norms Institute at the University of Virginia
6
Loyalty is the box with a high repeat patronage and high relative attitude, see red circle in exhibit 1.2
11It can be concluded that the relative attitude as well as the social norms, and the situational influences, have an
impact on the repeat patronage. To get a good insight in the impact of each factor separately, several different
type of analyses can be done. The relative attitude can be determined by means of a survey (this method is
already discussed in exhibit 2). But also the effect of trends can be measured in this way, for example the
emerging sustainable trend. Simultaneously the situational factors and the social norms can also be analyzed
by means of purchase data. It is possible to measure the impact of those factors on purchases, which will be
discussed in more detail in section 2.5.
2.5 How to measure loyalty
The previous sections shed light on how loyalty arises, how it is divided in two varieties and which factors can
influence it. However, the previous sections do not give any concrete measurements. This section will discuss
the methods and questions that can be used to determine both attitudinal and behavioral loyalty.
More than 80% of companies use satisfaction scores to monitor customer loyalty, even though there is no
evidence that this is a good way of measuring the loyalty level (Naravandas, 2005). Naravandas (2005) claims
that this indicator measures scores that are based on past experiences, and loyalty is about future behavior.
Therefore, measuring the satisfaction level will not suffice. In contrast, companies should use recommendation
scores and re-purchase rates to measure the loyalty rate (Naravandas, 2005). This theory partly agrees with the
theories of Dick and Basu (1994) and Kumar & Shah (2004), which were discussed above. Both theories claim
that behavioral loyalty can better be determined by purchase data, but they disagree on how to measure
attitudinal loyalty. The earlier discussed theory of Kumar and Shah (2004) stated that the attitudinal loyalty
should be measured by using the relative attitude. Naravandas (2005) claims it should be measured by means
of the recommendations. Although this seems very different, both methods have large similarities. These will
be further discussed in the next part (attitudinal loyalty), but first how to measure behavioral loyalty will be
discussed.
Behavioral loyalty
It is not only important that customers say that they are loyal, but they should also act loyal. As mentioned
before, to determine the level of behavioral loyalty purchase data should be analyzed. Kumar and Reinartz
(2004) propose several methods to measure the loyalty level, see exhibit 6. Table 1 shows the two most
7
interesting ways of measuring the behavioral loyalty for this thesis : (1) purchase frequency acceleration, and
(2) increased retention rate. The method that will be used to determine the attitudinal loyalty is also included.
7
The reason for not choosing the other methods is also shown in exhibit 6.
128
Table 1 Methods to measure loyalty (Kumar and Reinartz)
Methods Part of loyalty
Purchase frequency acceleration Behavioral loyalty
Increased retention rate Behavioral loyalty
9
Increase in positive word-of Mouth communication (WoM) Attitudinal loyalty
Behavioral brand loyalty has mostly considered loyalty as a notion of consumers being exclusively loyal to a
single brand (Yim and Kannan, 1999). With the unprecedented increase in the number of competing product
alternatives in the present decade, there has been a clear decrease in the number of such loyal consumers who
purchase a brand exclusively. Many consumers have started to embrace more than one favorite brand, thus
exhibiting divided loyalties among a few brands. Therefore in this investigation two types of behavior loyalty
will be used:
Repurchases Continuously (without any interruptions) which describes hard-core loyalty, when
consumers exclusively repeat purchase one brand
Repurchases Discontinuously which describes reinforcing loyalty, when consumers may switch among
brands, but predominantly repeat purchase one or more brands to a significant extent (Yim and
Kannan, 1998).
Attitudinal loyalty
The level of attitudinal loyalty can be determined by
means of the attitudinal differentiation matrix (Dick
and Basu, 1994) and the CBBE matrix (Keller, 1993)
see exhibit 5. Before going any further, the theory of
Level 2.
the CBBE matrix will be briefly explained.
Brand response
CBBE is defined as the differential effect of brand
knowledge on consumer response to the marketing of
the brand. Level 1.
This model clarifies the steps a consumer makes by Brand
becoming a loyal customer: he/she goes from brand knowledge
knowledge (first two levels), to brand response (last
two levels), see figure at the right and exhibit 5.1.
8
These three options are the most appropriate methods to use in this investigation. Exhibit 6 shows all the
other options of Kumar and Reinartz with a brief explanation. The options that are chosen correspond to the
literature that is discussed in this chapter. The reason of not choosing the other methods is also explained in
exhibit 6.
9
The Word of Mouth (WoM) communication is similar to the discussed recommendation level.
13This insight in development of loyalty is important in this investigation because it shows that if there is no
knowledge of a brand, loyalty can never be achieved. Subsequently, the CBBE model uses a matrix with the
different levels of loyalty that can be achieved (exhibit 5.3). Those levels are similar to the ones shown in
exhibit 1.2, so the theories of Keller (2001) and the theory of Dick and Basu (1994) do not conflict with each
other.
As is shown in the CBBE matrix, the attitude arises from knowledge. Therefore the survey will start with
determining the level of knowledge. If there is no knowledge, there can’t be any attitude towards the brand. If
there is knowledge of the brand, the attitude will be simply estimated by asking the attitude strength towards
the brand. Subsequently the attitude differentiation will be measured by asking their preferred brand. In this
way the relative attitude can be determined. By means of this method the level of attitude can be determined
in all the different layers in the ‘CBBE stairs’.
In contrast, the theory of Narvandas (2005) claims that the attitudinal loyalty can be measured by means of the
recommendation level. This method will also be used in this thesis, but in combination with the CBBE matrix.
This is because the recommendation level only measures the highest step of the CBBE matrix. So by only using
that method, there is no insight in how this loyalty level has evolved. Therefore a combination of both theories
will be used (see exhibit 5.2). To determine the level of the different ‘steps’ the CBBE model will be used.
Complementary to measure the overall attitudinal loyalty level, the recommendation level will be used.
The recommendation level is also discussed in the theory of Frederick F. Reichheld (2003). He claims that there
is only one question that should be asked to determine the level of loyalty, namely: Would you recommend this
product to your friends and or colleagues? This method also includes the satisfaction level since if you didn’t
like the product, you would not recommend it. Secondly by recommending a product a person puts his own
image on the line Therefore it should be a highly committed and satisfied customer.
The level of recommendation for a company could be measured by the net-promoter rate (Reichheld, 2003):
Promoters are those who say they are extremely likely to recommend the brand to a friend or
colleague.
The net-promoter is calculated by subtracting the percentage of customers who say they are unlikely to
make a recommendation (detractors) from the percentage who say they are extremely likely to do so:
Promoters – Detractors = Net-promoter rate
The outcome of this formula shows the relative number of loyal customers per brand: the higher the number,
the better. Besides this outcome, the formula also shows that a company should not only strive to the highest
level of promoters, but it should also try to minimize the number of detractors. Namely if the number of
detractors is very high, the loyalty level will also be low, despite what the promoters level will be.
14Non-attitudinal sources
As exhibit 3 shows, besides the attitudinal loyalty, the non attitudinal sources also have influence on the overall
loyalty level. Therefore measuring the influence of the situational influences in combination with the social
norms, will give marketers some extra insight in which factors influence customer loyalty. This gives them the
opportunity to encourage or distress certain aspects. It is very important to include this non-attitudinal sources
into the research, because in this way unexpected influences can be discovered. (This can be seen as thinking
out of the box.) These factors can also be measured by means of the data that was collected to determine the
attitudinal loyalty and the behavioral loyalty.
2.6 Conclusion
Loyalty can be separated in two parts: attitudinal and behavioral. Attitudinal loyalty represents a higher-order,
or long term, commitment of a customer to the brand. Behavioral loyalty focuses on the value of the customer
to the brand, which is translated in purchase behavior. Therefore it could be stated that to achieve better
results, it is important for a brand or company to manage the level of loyalty.
The behavioral loyalty level can be measured by purchase acceleration and the retention rate. These indicators
will be used during this investigation. However, purchase acceleration will be split up in high committed hard
core loyalty (Repurchases Continuously) and less intensive reinforcing loyalty (Repurchases Discontinuously)
(Yim, Kannan, 1998). By mapping the behavioral loyalty by means of these indicators and comparing the results
of a fair-trade brand versus a normal production, the effect of fair-trade on behavioral loyalty can be
established.
Attitudinal loyalty will be measured by means of the relative-attitude-matrix, which is determined by the
interaction between attitude strength and attitude differentiation. Secondly, the different stages of loyalty will
be determined by means of the CBBE matrix, and the highest level of loyalty will be determined by means of
the recommendation level. The combination of all results gives a good insight into the attitudinal loyalty level
of the investigated brands, and hence whether fair-trade influences the outcome.
When both levels are determined, so both the repeat patronage (behavioral loyalty) and the relative attitude
(attitudinal loyalty), the overall level of loyalty can be determined by combining both results. While doing this it
is important to keep in mind that there are some moderators that can influence this relationship, like the non-
attitudinal-factors as situational influences and social norms. The influence of these factors should also be
determined, with the aim to recommend which external influences the brand should try to encourage or
weaken.
All theories that are used, are incorporated in a new figure, that is shown below. At the end of this thesis this
figure should be completed for both the fair-trade brand and the normal produced brand. By doing this, it will
be very clear where the differences between both types of brands occur.
15Figure 1 Mapping Loyalty in fashion (Deborah Duijndam, 2010)
Loyalty
Behavioral loyalty:
Purchase acceleration &
Retention Rate
Social
norms
Attitudinal loyalty: +
Latent
Loyalty
CBBE matrix & Loyalty
Recommendation
level
Situational Spurious No
influences loyalty loyalty -
+ -
When the level of loyalty is determined, and the non attitudinal factors are mapped, it is possible to create
some strategies that will influence and manage the level of loyalty (see exhibit 4). By doing so, the overall
target can be set and recommendations on brand level can be given, which is the goal of this report.
16Chapter 3 Fair-trade and Fashion Industry
In the previous chapter the theory of loyalty is discussed. This chapter gives some background information
about fair-trade in general and fair-trade in the fashion industry. Both chapters will be used as a basis for
further research described later in this thesis.
3.1 Introduction
Fair-trade has been in existence for more than forty years and has become a very successful niche market. But
in recent decades, a significant growth in the number of ethically aware consumers has caused a strong
demand for socially and ecologically sustainable products, not only in the niche markets, but also among the
masses (Barrientos, Conroy & Jones, 2007). Therefore it would be expected that a lot of research is done
concerning fair-trade, but unfortunately the opposite is true. The written literature is limited and mainly
focused on the production processes, its challenges and price sensibility. Secondly the greater part of the
information is based on the food industry and other industries are barely discussed. Moreover, information
about fair-trade-consumer behavior is also lacking. This is most likely caused by the fact that limited data is
available which arises from the fact that the mainstream market has been buying fair-trade only since the last
decade.
In this chapter general information and guidelines about fair-trade and previous findings will be discussed. The
fashion industry and the fair-trade movement within the fashion industry will be described and discussed.
Nowadays it is very difficult to retain customers. Since there is less competition in the fair-trade market,
consumers can get additional information about the production process, which will lead to greater knowledge
and hence better-informed choices. All these reasons will create the feeling that in fashion industry, fair-trade
can lead to higher attitude levels.
3.2 Fair-trade in general
Over the history of fair-trade, several definitions of fair-trade are given. The most general definition is given by
10
FINE and is given below.
Fair-trade is a trading partnership, based on dialogue, transparency and respect, which seeks greater equity in
international trade. It contributes to sustainable development by offering better trading conditions to, and
securing the rights of, marginalized producers and workers especially in the South. Fair-trade organizations
(backed by consumers) are engaged actively in supporting producers, awareness raising and in campaigning for
changes in the rules and practice of conventional international trade. (FINE, 2001)
10
FINE is an informal network that involves the fair-trade Labeling Organization International (FLO), the
International Federation for Alternative Trade (IFAT), the Network of European Shops (NEWS!) and the
European Fair-trade Association (EFTA). (Sixty years of fair-trade, 2006))
173.3 Distribution channels
Fair-trade products are sold through three main channels: the dedicated retail outlets, supermarkets and via
mail orders. In addition to these three main channels there are other retail channels such as solidarity groups,
whole food shops, and independent commercial stores. In Europe there are approximately 2700 ‘world shops’,
and 43,000 supermarkets were fair-trade products are sold. So the number of fair-trade offering supermarkets
in Europe is quite high, which cannot be said about the US market where there are merely 7,000 fair-trade
offering supermarkets. This lead to the conclusion that fair-trade is further developed in Europe compared to
the United States.
The discussed distribution channels can be divided into four main groups:
1. First there are the producer organizations in developing or Southern countries.
2. Second there are the buying organizations in developed or Northern countries, which act as importers,
wholesalers and retailers of the products purchased from the Southern producer organizations.
3. Third there are the umbrella bodies which consist of the following six organizations: IFAT, FLO, NEWS!,
EFTA, fair-trade Federation and Shared Interest. These are mainly focused on the fair-trade process but
there are also a lot of organization that support sustainable production (what is a more broadly approach).
When looking at the fashion industry, there are some umbrella organization that will only focus on the
distribution in fashion, like MADE-BY. Instead of offering a 100% fair-trade production, they offer less strict
alternatives.
4. Fourth there are a wide range of mostly conventional organizations that engage in some way in fair-trade.
Think of supermarkets, retailers or brands that want to communicate a sustainable message.
This research will mainly focus on distribution channels in the fashion industry. The most important (and
discussed later in this chapter) distribution channels are the second and third level. Kuyichi, the second level, is
the brand which imports its clothes from the producer organizations. The umbrella organization MADE-BY (the
third level) helps making connections with the manufacturers hence controls for the fair process. As mentioned
before this is not a fair-trade organization, but it provides information about a sustainable production process.
However the fourth party will not be discussed extensively, it is included in this thesis because the data is
derived from a retail store. All these parties will be discussed in the following paragraphs.
3.4 MADE-BY
MADE-BY is an independent label for brands and retailers in the fashion industry that wants to improve the
social, economic and ecological environmental factors in their production chain while making the process more
transparent. Their mission is: Wouldn’t it be fantastic if the clothes of your favorite brand were made with
11
respect to people and environment .
11
MADE-BY. MADE-BY Missie.
18MADE-BY has contact with the consumers, the brand as well as the manufacturers. Contact with consumers is
important for giving them the certainty that the brand puts all its effort in making the circumstances as good as
possible in respect to people and environment. Contact with the brand is important for giving them the
assistance in improving their social, economical and ecological circumstances in their whole production
process. Contact with manufactures is important for helping them to obtain social and environmental
certification and the purchase of durable materials such as organic cotton through the MADE-BY network of
farmers, spinners and fabric manufactures.
12
In practice MADE-BY uses three target points to achieve the above : Blue Button, Global Network and
Transparency. These points are extensively described in exhibit 7.
3.5 Quality mark
The quality mark of MADE-BY is the blue button, but considering the above you can imagine the use of a quality
stamps can be confusing. This is partly caused by the fact that for each market different requirements are set.
Secondly it has to do with the fact that these products are produced in different ways, countries and by
different production chains. The longer the chain, the more difficult it is to control all the requirements in every
link. Subsequently it is difficult to set one quality stamp for these different environments and requirements.
Nevertheless FLO and IFAT try to do so. Social, economic and environmental developments are central to the
fair-trade production process. These elements will be the basis of the detailed requirements for each separate
market. The standards are extensively described in exhibit 8.
MADE-BY does not guarantee the discussed standards, because it cannot guarantee that all rules are complied
during the production processes they support. Therefore they do not use the fair-trade quality stamp, but as
already mentioned before they use their own quality stamp: the Blue Button. Companies that have this stamp
have as a goal to produce their clothes in the most sustainable way possible. A large difference between the
fair-Trade quality stamps like Max Havelaar and the Blue button is that the fair-Trade stamps are given for their
past results and the Blue Button is given for past and future results. The Blue Button stands for a long time
commitment and the goal to improve the production process of the brand. A 100% guarantee that the
production process already is totally fair-trade is not addressed. The process of becoming more sustainable is
shown on the website (Scorecard) and therefore very transparent. In this way consumers can see the
improvement of the brand over time.
3.6 Scorecard
As is discussed in the previous part, to show this developments clearly MADE-BY has made an overview that is
13
called the scorecard. This is made for each brand that participates and is shown on their website . In exhibit 10
12
MADE-BY. MADE-BY In het kort
13
MADE-BY. MADE-BY Resultaten
19the score card of Kuyichi is shown. There you can see that only 5% of the total production is socially certified.
The fact that the fashion industry is made up of so many levels causes that it is almost impossible to achieve a
100% fair-trade proof chain. Although this seems like a small percentage, the total effect that MADE-BY has on
sustainable production is quite large and is growing rapidly, which is shown in exhibit 9.
3.7 Brands
To show the impact of fair-trade on loyalty, two brands will be compared: Kuyichi (fair-trade) and G-Star
(normal produced).
Kuyichi
14
The brand Kuyichi is the first fashion label that proved that being fair-trade and fashionable can go together .
The organization Solidaridad founded Kuyichi in 2002 as a result of an action against the bad image (and reality)
of the fashion industry, specifically that the working environment is bad, while not even speaking about the
damage to the natural environment. It attempted to prove that a brand can become successful because of the
fair-trade production process instead of despite of it. Fortunately they proved to be right, because Kuyichi is
currently a successful and trendy jeans brand. Overtime many other brands have followed Kuyichi by starting a
collaboration with MADE-BY, that was founded as a result of the success of Kuyichi to support other brands to
do the same. This investigation will shed its light on the brand Kuyichi and compare it with another Dutch brand
G-Star.
G-STAR
G-Star is the market leader of The Netherlands concerning jeans and casual clothing. In general, it can be stated
that every Dutch fashion brand that wants to join the real market, compares their sales, product development
and marketing activities with G-Star. This is the reason that in this report G-Star is used to set the bar. The
similarities and differences between G-Star and Kuyichi are shown in table 1 below.
Table 1 G-Star versus Kuyichi
G-Star Kuyichi
Range of products Jeans, shirts, coats, accessories, Same except for shoes, but fewer
shoes products per category
Price A-brand price setting for mass- A brand price setting for mass-
market market (low for FT and organic)
Position in market Market leader in jeans Pioneer in fair-trade jeans
Core Values (short) Trendy, innovative, denim, Trendy, organic (good quality),
skilled pure, denim
14
KUYICHI. Kuyichi Love the World
203.8 Recent facts & figures
As mentioned in section 3.1 the information about the fair-trade market is limited. This is caused by the lack of
an overarching trade body and secondly because the subject does not (did not) have the attention of market
intelligence agencies. Fortunately some figures are available.
During the last five years the sales of fair-trade certified products have been growing on an average of almost
40% on yearly base. In 2008, consumers spent 2.9 billion Euros on fair-trade products globally. This means that
despite the global recession, worldwide sales of fair-trade products grew by an impressive 22% in 2008. This
15
makes the fair-trade certified products one of the most successful products of this decade .
Subsequently Hudson and Hudson cited evidence that in 1999 only 50% of the worldwide production of fair-
trade coffee was sold through fair-trade channels and the remaining 50% was sold on the regular market
(Renard, 2003). This shows that the mainstream market has been reached and fair-trade is no longer only sold
to ‘alternative people’.
Retailing & Fashion market
The two tables below show the developments in the retailing of the last 3.5 years (so also non fair-trade). It is
quite evident that the year 2009 was a very difficult year. The positive thing is that the losses decreased in
2010, but unfortunately still occur. Therefore it is expected that the facts and figures of both brands show
disappointing results due to the overall economic decline.
Table 2 Retail in the Netherlands
2.1 Retail 2.2 Non food retail
Table 3 Purchases over time retail store
This investigation will analyze the data of one particular Purchases in
pieces Kuyichi total G-Star total Others
retail store. In this retail store, the overall sales of G-star
2005 189 1929 3820
(13899 pieces) was about 5 times higher than Kuyichi 2006 393 2435 4118
2007 759 3168 4564
(3215 pieces) during the last five and a half years, see
2008 748 2563 3903
table 3. 2009 726 2380 1521
2010 400 1424 668
TOTAL 3215 13899 18594
15
Fair-trade. Fair-trade Labelling Organizations International (FLO)
21Table 4 Growth rates retail store
16
However, when comparing the growth rates , it is very Purchases in Growth rate Growth rate Growth rate
pieces Kuyichi G-Star Others
obvious that Kuyichi showed the largest rates, see table 4.
2006 107,94% 26,23% 7,80%
The growth rates and purchases are also illustrated in 2007 93,13% 30,10% 10,83%
2008 -1,45% -19,10% -14,48%
exhibit 11.2.
2009 -2,94% -7,14% -61,03%
( D ub b le) 2010 10,19% 19,66% -12,16%
TOTAL 41,37% 9,95% -13,81%
The market share of G-Star in the retail shop is also much
higher than that of Kuyichi, namely 38% versus 9% (see exhibit 11.1). However, when looking at the growth
rates, Kuyichi’s market share has quadrupled in the last five years. The market share of G-Star has also grown
rapidly, from 31% to 38%. So both brands are doing well, and especially when comparing with the other brands
(Others). Those brands have, unlike G-Star and Kuyichi, lost market share over the last five years.
Even though the number of purchases of both brands show large differences, they are still comparable. This
because the investigation focuses on individual purchase behavior. The total number of purchases will be
corrected with the total number of consumer per brand. In this way the proportion of loyal customers of each
brands will be determined, which makes it possible to compare them.
3.9 Conclusion
In short it can be concluded that the fair-trade market is an emerging market with many opportunities. Yet it is
still uncertain whether this is also true in the fashion industry. The brand Kuyichi is designed to prove the
opposite, namely that also in fashion fair-trade brands can become successful hence profitable. The greatest
challenge is to influence all links within the production chain. Therefore, to overcome this problem, an
alternative has been formed: the label MADE-BY. This label gives an alternative with less stringent
requirements and with its main goal to encourage sustainable entrepreneurship.
To show the consumers that the brand is sustainable a quality stamp was made: the Blue Button. In the
following chapters the effect of communicating this sustainable production process will be investigated. It will
be investigated whether the consumer will act more loyal, since it is assumed that the purchases are done with
more knowledge and therefore with more commitment to the brand.
16
Since the data of 2010 was only available for the first six months of the year, the data for 2010 was doubled
to estimate the growth rate for the whole year.
22Chapter 4 Hypotheses and Methodology
The previous chapters (2 and 3) have discussed the research framework that will be used as the base for this
thesis. This chapter will discuss the hypotheses which are derived from the theory. Secondly it will discuss the
methods how these hypotheses should be tested.
4.1 Introduction
The aim of this thesis is to determine the level of the ‘total’ customer loyalty. Because loyalty can be divided in
behavioral and attitudinal loyalty, this investigation splits up the analysis in two separate parts. In the first part,
retail data will be analyzed to determine the level of behavioral loyalty. The second part will focus on
determining the attitudinal loyalty by analyzing the results of a survey. The combination of the two parts will
give a complete picture of the level of both
elements of loyalty (see figure at the right). By
doing so, possible gaps and/or similarities
between both levels of loyalty can arise. Because,
as discussed in the literature, both types of loyalty
are strongly related, but arise in different ways.
Therefore it is important that recommendations
should be given at the overall loyalty level but also
separately for each type of loyalty.
4.2 Part 1: Behavioral loyalty
In this part the behavioral loyalty will be determined by investigating whether the behavior of customers of
fair-trade products is different from the behavior of customers of ‘normally produced’ products. This survey
will be based on the theory that behavioral loyalty is mostly measured in purchase behavior, which is discussed
in chapter 2 and shown in exhibit 2. Based on this, the main question that should be answered in this first part
will be:
H1: “Using a fair-trade production process leads to a customer with a significantly higher level of behavioral
loyalty”.
4.2.1 Hypotheses
Behavioral loyalty exists of different elements and therefore can be measured in several ways. So subsequently
to estimate the level correctly, tangible elements to compare should be included. These elements where
already discussed in chapter 2 as ways to measure behavioral loyalty, namely the purchase frequency
2317
acceleration and the retention rate (Mellink, 2005). Based on these methods the following sub hypotheses
arise (see below):
H1.1 “Using a fair-trade production process leads to a customer with a significant higher number of
repurchases”.
H1.1.1 “If a customer buys a fair-trade brand, it is significantly more likely that he/she will
consecutively repurchase the fair-trade brand instead of purchasing another brand”.
H1.1.2 “If a customer buys a fair-trade brand, it is significantly more likely that he/she will not
consecutively repurchase the fair-trade brand instead of purchasing another brand”.
18
H1.2 “Using a fair-trade production process leads to a customer with a significantly higher ‘retention rate’ ”.
H1.2.1 “If a customer buys a fair-trade brand, it is significantly less likely that he/she will consecutively
switch to another brand”.
A large disadvantage of the variable “number of switches” is that it includes all switches that were made by the
customer. This may sound strange because in fact those switches are made, but it is crucial to realize that in
some situations the switch back is part of the first switch. In this case, the consumer can be said to go back to
the preferred (original) brand after a switch rather than making a switch to another brand (this is illustrated in
figure 2).
Figure 2 Double Switch
17
All possible ways to measure loyalty are described in exhibit X.
18
Total number of purchases (%) – the number of ‘churns’(%) = Retention rate (%) [100% - X% = Retention rate]
24Having said this, an extra analysis will be included. It will analyze the switches back that will be measured by
means of ‘single purchases’. The single purchase will not be tested but described by means of the descriptives.
The above hypotheses establish the level of behavioral loyalty for both brands, hence possible differences will
be discussed.
4.2.2 Methodology
In this section the retailer, data, variables and testing methods will be discussed to give some insights to this
investigation.
4.2.2.1 Retailer
The data that is used for this investigation is collected from a representative fashion store. This fashion store is
privately-owned, consists of one store on an AA location in Delft, is well known for its high service level and
exists for more than 30 years. The target market are young up to mid-age people, men and women, with an
above average income. It offers on average between six to eight A-brands. G-Star is the most popular brand in
this shop and has been in their portfolio for the last 15 years. They started selling Kuyichi around seven years
ago.
The data is acquired by means of a loyalty card that is used in this retail store. Regular customers can get this
card in exchange for a small discount. The data consist of all the purchases of these cardholders during the last
five years. This period of time is chosen because sales of Kuyichi started to become measureable as of 2005.
The data consists of 35708 purchases of which 3215 were Kuyichi purchases and 13899 were G-Star’s. All of
these purchases were done by a total of 5423 customers.
4.2.2.2 Brands
As mentioned in chapter 3, the analysis will shed its light on two Dutch fashion brands, that operate in the
same segment with similar products of the same price level. The main difference between both brands (besides
fair-trade and normal production) is that Kuyichi is in the growth phase and G-Star is already a mature brand.
It is important to mention that both brands offer the same kind of products, but the availability of different
20
products is about 50% higher for G-Star compared to Kuyichi. This is a limitation to the investigation, however
it is still considered to be a fair comparison as both brands offer enough products to make a conscious choice.
In addition, the purchases of all other brands will also be included because they will give information about the
repurchases and the switching behavior of the customers. These brands will be aggregated in a new variable as
‘OTHERS’. The analysis and recommendations will only be done for the brands G-Star and Kuyichi.
20
LIMITATION 2: The coincidence factor of choosing a G-Star product is higher considering the difference in
supply quantity.
254.2.2.3 Variables
To determine the loyalty level, it is very important to measure the individual purchase behavior. Analysis of the
overall purchases gives insight into trends and strengths of a brand, but it does not provide insight in the
21
loyalty level of the individual customer . For this purpose the data retrieved from the cardholders will be
analyzed. The information includes: client number, product information such as brand and kind of product,
date of purchase, price and when appropriate the discount. As discussed in chapter 2, the repurchases and the
retention rate will be used to establish the behavioral loyalty level. The quality of these variables is shown in
exhibit 12.
To answer the different hypotheses that were outlined in section 4.2.1, several new dummy variables are
included. These dummy variables are: Purchase Kuyichi, Purchases G-Star, Purchases Others, Repurchases
Kuyichi (continuously and discontinuously), Repurchases G-Star (continuously and discontinuously), Switch
Kuyichi, Switch G-Star, Discount Kuyichi, Discount G-Star, Discount Others. Additional information on how these
variables were made, and how they can be interpreted, can be found in exhibit 13.
Brand loyalty mostly implies being exclusively loyal to a single alternative despite any situational factors. As
discussed in chapter 2 (page 12), many consumers have started to embrace more than one alternative as their
favorite brand. Therefore it can be stated that the meaning of loyalty has changed and consumer loyalty can be
divided among brands. To include this market shift, loyalty will be defined in two ways (Yim and Kannan, 1998):
Hard core loyalty: continuously repurchases,
Reinforcing loyalty: discontinuously repurchases.
Continuously and discontinuously repurchases
Continuous repurchase: if the customer purchases the same brand on two consecutive occasions , it is called a
continuous repurchase. All other cases will be covered under discontinuously repurchases. This variable
provides important customer information and changes over time can be analyzed. This makes it possible to
determine for how long the customer has purchased the brand, if the number of purchases has grown over
time, and whether the customer purchases other brands on occasion. This is important information for the
management of the brand. For example, if a new Kuyichi customers is detected, he/she should be approached
in a certain way. In contrast, an existing Kuyichi customer who switches to a competitor should be regained.
But he/she should be approached in a very different way than in the first scenario. In short this variable shows
the behavior of a customer over time. In other words whether the customer becomes more or less loyal to the
brand.
21
LIMITATION 3: Unfortunately the loyalty card is sometimes used by more than one person. This may skew the
research results and therefore this limitation must be considered in the evaluation of the results.
26Discontinuous repurchase: the variable repurchases discontinuously does not contain all the previous discussed
information. This variable shows the total repurchases that were done by one individual customer and the
effect of time is not included. Therefore the variable does not show if these purchases were made with
interruption or without. This implies that important information is lost as it is impossible to determine whether
a customer is loyal or not. Secondly, this variable cannot show whether a new customer is concerned or an
existing customer that has changed his/her behavior over time. This is a major omission of this variable for the
management of the brand. However, it still has been decided to include this variable, since it gives a high level
view of the intensity of purchases per customer, which is also a good indicator of loyal behavior.
Since it is difficult to achieve high loyal behavior in the fashion industry the combination of both variables
(continuous and discontinuous repurchases) is chosen. The first variable measures behavioral loyalty very
strictly (without interruptions) but it gives only insight into a very small percentage of the total customer group
(very loyal customers). The second variable (discontinuous repurchase) measures loyalty on a more general
level and therefore gives insight into a larger percentage of the customer group. The combination of both
variables gives the most realistic view of the loyalty level.
4.2.2.4 Statistical tests
In order to test the hypotheses in section 4.2.1, the following two variables will be used: continuous and
discontinuous repurchases. The goal of this investigation is to find out whether there are any differences
between customers who purchase Kuyichi and G-Star. To reach this goal, the repurchases and switching scores
of both brands will be compared. The methods used will differ slightly for both of the variables. These
differences are dedicated to the characteristics of each variable. A short summary of these dissimilarities are
shown in the table below.
Table 5 shows that a distinction can be made between the categorical dummy variables (1 or 0) and the ratio
variable. For the categorical dummy variables the Chi Square test should be used. In contrast, the aggregated
purchases ( the ratio variable) should be tested by means of the t-test within one group. The Chi Square test
will show the differences between the two customer groups (Kuyichi- and G-Star customers), whereas the T-
test measures the dissimilarities within the whole customer group. Figure 3 provides a visual outline of the two
methods.
Table 5 Summary of the most important variables
Groups Variable Repurchases Variable Repurchases Variable Switch
Continuously Discontinuously
G-Star = 1 CATEGORICAL VARIABLE RATIO VARIABLE CATEGORICAL VARIABLE
Kuyichi = 2 1 = repurchase 0, < = sum repurchases 1 = switch
Others = 0 0 = not a repurchase 0 = no switch
27You can also read