The Effect of Over-the-Top Media Services on Piracy Search: Evidence from a Natural Experiment
←
→
Page content transcription
If your browser does not render page correctly, please read the page content below
The Effect of Over-the-Top Media Services on Piracy Search:
 Evidence from a Natural Experiment

 Shijie Lu
 Assistant Professor of Marketing
 Bauer College of Business
 University of Houston
 slu@bauer.uh.edu

 Koushyar Rajavi
 Assistant Professor of Marketing
 Scheller College of Business
 Georgia Institute of Technology
 krajavi3@gatech.edu

 Isaac Dinner
 Director of Econometric Modeling
 Indeed
 isaac@isaacdinner.com
Abstract

The rise of over-the-top (OTT) video streaming services has raised the question of how this new form of
digital media affects consumer search for pirated content. We address this question by using Netflix’s
unexpected announcement of a global market expansion in January 2016 and the subsequent block by the
primary telecommunications firm in Indonesia as an exogenous shock to the supply of OTT services in
that country. Using synthetic control methods, we compare the change in piracy search between Indonesia
and 40 Asian countries where Netflix simultaneously entered and remained available. Netflix’s failure to
launch in Indonesia leads to a 19.7% increase in search for pirated movies and TV shows in Indonesia,
relative to the other countries, suggesting a net substitution of piracy for OTT services. Comparison of
treatment effects between exclusive and nonexclusive content shows that the treatment effect is driven by
both a combination of an expansion of the market for piracy and a substitution between piracy and OTT
services. We also find that the treatment effect is stronger for less dialogue-oriented content, which is
consistent with the greater appeal of dialogue-light content to non-English-speaking consumers.

Keywords: piracy, over-the-top service, video streaming, synthetic control, natural experiment

 1
1. Introduction

In 2018, the Video Advertising Bureau estimated that 71% of U.S. households accessed media through an

over-the-top (OTT) media service and that the number of U.S. households that solely use OTT services

rapidly increased from 5 million in 2013 to more than 14 million in 2017. The growing popularity of OTT

services in the United States also coincides with an increasingly large number of OTT service providers

globally. While U.S. consumers are likely most familiar with Netflix, Hulu, and Amazon Prime, there

exist a substantial number of international options at widely affordable price points: Spuul is popular in

India, Showmax in South Africa, and Viaplay in Finland. There are also growing niche players focused

on specific genres such as horror (Shudder) or cinematic classics (Mubi). The popular press speculates

that the introduction of these high value, low cost, media services can help bring down global piracy

(ZDNet 2016). However, these arguments are largely correlational and have not been supported by

rigorous empirical evidence.

 Theoretically, OTT media services may affect piracy in two opposing ways. First, the introduction of

a reasonably priced on-demand substitute may be so attractive that many consumers will discontinue

consuming pirated content in favor of the OTT service. It is therefore possible that the introduction of

OTT services will induce the piracy market to shrink, suggesting a substitution effect. Prior research

suggests that consumers may turn from piracy to legal channels for any number of reasons. For example,

unlike piracy channels, which often require consumers to proactively search for desired content, legal

digital distribution channels significantly lower the search cost (Hennig-Thurau et al. 2007). Other

possible reasons include the guaranteed high-quality video content available on OTT platforms and the

lack of legal, moral, or technical risks typically associated with pirated content (Hennig-Thurau et al.

2007, Danaher et al. 2010, Smith and Telang 2016). Second, the market for pirated content may increase

as a result of OTT services. In particular, word of mouth (WOM) and promotional activities may spread

product information associated with OTT services, leading consumers to search for alternative outlets.

For example, an article about female inmates in the New York Times, during the promotion of the show

Orange Is the New Black (Deziel 2014), may have triggered consumers’ awareness of and interest in the

 2
show and consequently driven some consumers to watch the show from piracy sites instead of Netflix.

This suggests a market expansion effect of OTT services on piracy. Because both substitution and market

expansion effects may occur, whether the introduction of an OTT service will lead to a decrease or an

increase in the demand for piracy is not clear.

 The main goal of this research is to quantify the effect of OTT services on consumer search for piracy

by examining a unique natural experiment. On January 6, 2016, Netflix announced that it would

immediately become available in 130 new countries (41 in Asia), including Indonesia (Minaya and

Sharma 2016). However, on January 27, 2016, the dominant telecommunications provider in Indonesia

blocked the Netflix service due to governmental concerns (Yuniar 2016). In this natural experiment we

define the treatment to be Netflix’s failure to launch in Indonesia, which provided a natural shock to the

availability of OTT services in Indonesia. Accordingly, Indonesia is the only country in which Netflix

entered but was subsequently blocked and thus is the only treated unit. The remaining 40 countries in

Asia, where Netflix entered at the same time and remained available, constitute a control group.

 To investigate the effect of the treatment on piracy demand, we collected monthly piracy search data

from Google for a sample of 304 Netflix titles, including both movies and TV shows, in 41 Asian

countries (including Indonesia) between October 2014 and June 2016. We begin by considering a

difference-in-differences (DiD) model, which compares the relative change in search for pirated content

(hereafter called piracy search) between Indonesia and the 40 control countries before and after treatment.

The results show a significantly positive short-term effect of the treatment on piracy search in Indonesia

relative to the 40 control countries. Nevertheless, the path of piracy search in control countries does not

match well with Indonesia during the pretreatment period from October 2014 to December 2015. As such,

in the main analysis, we use a synthetic control method (Abadie et al. 2010, 2015), which Athey and

Imbens (2017, p. 9) call “arguably the most important innovation in the evaluation literature in the last 15

years.” The synthetic control method extends the DiD framework by allowing the effect of unobserved

confounders on the outcome to vary over time (Abadie et al. 2010). With this approach, we construct a

synthetic control country by allowing different potential control countries to have different weights. We

 3
then compare the change in search volume in Indonesia with that in the synthetic control country to

estimate the treatment effect.

 We find that Netflix’s failure to launch in Indonesia leads to a 19.7% increase in search for pirated

movies and TV shows in Indonesia relative to the other 40 countries where Netflix entered and remained

available, suggesting a net substitution effect of OTT services on piracy. Additional support comes from

the observation that the difference between Indonesia and these other countries disappears when

alternative OTT services became available in Indonesia. However, despite the net displacement between

OTT services and piracy, do OTT services also expand the piracy market?

 We provide evidence of the market expansion effect by investigating the differential effect of the

treatment between original content exclusively distributed by Netflix and nonoriginal content licensed by

Netflix, which is also available on other legal distribution channels. If the positive effect of Netflix’s

unavailability in Indonesia on piracy search is driven solely by substitution, we expect this effect to be

stronger for original content than for nonoriginal content. This is because nonoriginal content is available

on multiple legal distribution channels, while original content is exclusive to Netflix, implying a higher

level of substitution between Netflix and piracy for original content. Conversely, if the introduction of

OTT services also expands the piracy market, we expect the associated negative effect of Netflix’s

unavailability in Indonesia on piracy search to be stronger for original content than for nonoriginal

content because of increased WOM and a higher promotional effort for original content. In essence, the

existence of a substitution effect alone would indicate that Netflix’s failure to launch in Indonesia results

in a more positive effect on piracy search for original than nonoriginal content. Our finding of a less

positive treatment effect for original than nonoriginal content is consistent with the coexistence of both a

substitution and a market expansion effect rather than just a substitution effect.

 We also explore the moderating role of dialogue orientation in the effect of Netflix’s unavailability in

Indonesia on piracy search. Given that the majority of Netflix titles (96.7%) are not in the local languages

of the 41 Asian countries, less dialogue-oriented titles tend to be more appealing to Asian consumers

because of lower language barriers. As a result, we expect a stronger substitution effect of the availability

 4
of OTT service on piracy search for less dialogue-oriented titles. For each title, we measure the degree of

dialogue orientation using the average number of words per minute. We find a greater treatment effect for

less dialogue-oriented titles using multiple methods of classifying dialogue orientation, which offers

evidence of the hypothesized moderating effect of dialogue orientation.

 We contribute to the piracy literature by providing new evidence for the substitution of media

consumption between legitimate and illegitimate channels. Specifically, we show a positive effect of the

unavailability of an OTT service on the search for pirated content. Compared with previous studies, we

identify the effect based on an exogenous supply shock at the service, rather than content level, which

makes the control less likely to be affected by the shock and therefore provides a cleaner setting for

identification. We quantify the treatment effect using a synthetic control method, which extends the

commonly used DiD method by selecting the control in a more data-driven manner. We also examine the

moderating effects of content exclusivity and dialogue orientation, both of which are novel.

2. Related Literature

This article draws from the literature on digital piracy in marketing, economics, and information systems.

Early research on digital piracy primarily focused on the software and music industries, and generally

found displacement between legal and illegal sales (Givon et al. 1995, Rob and Waldfogel 2006, Zentner

2006). 1 More recent empirical studies on video piracy reveal mixed evidence on how piracy affects sales.

Rob and Waldfogel (2007) examine the effect of piracy on DVD purchases and find that video piracy has

a relatively higher rate of substitution but a more modest overall effect on sales than music piracy. Using

a longitudinal survey data of German consumers, Hennig-Thurau et al. (2007) also find that illegal

consumer file sharing significantly hurts theater visits, DVD rentals, and DVD purchases. Ma et al.

(2014) show that prerelease piracy negatively affects box office revenues. Danaher and Smith (2014) find

that the shutdown of a major piracy site positively affects digital sales and rentals of movies from major

1
 A notable exception is Oberholzer-Gee and Strumpf (2007), who find little evidence of a link between digital
music downloads and sales, though subsequent analysis of their data shows alternative results (Liebowitz 2016). For
a review of early research on piracy, see Danaher et al. (2014).

 5
studios, again suggesting a substitution of piracy for legal content consumption. By contrast, when

examining the relationship between DVD sales and the availability of a pirated copy during a broadcast

TV window after theatrical release, Smith and Telang (2009) find no evidence of the detrimental effects

of piracy. Peukert et al. (2017) find a negative effect of the shutdown of a popular piracy site on box

office revenues of an average movie and explain their findings by the WOM effect of online piracy. Lu et

al. (2020) find a positive relationship between postrelease piracy and box office revenues and show that

WOM drives this positive relationship. Following Peukert et al. (2017) and Lu et al. (2020), we theorize a

potential market expansion effect of the introduction of a legal distribution channel on illegal content

consumption through an increase in associated WOM and promotion.

 Previous research suggests that piracy consumption incurs multiple types of nonfinancial costs, even

though accessing content through piracy is generally considered “free” (Hennig-Thurau et al. 2007,

Danaher et al. 2010, Smith and Telang 2016). The most obvious cost is legal. In particular, there are file

sharing cases where individuals have been fined upwards of $675,000 (BBC 2012). There are also

nonfinancial costs which include learning how to use specific software to download content from torrent

sites. Technical costs may exist due to the possibility of downloading malware when using torrent

software, and time spent finding the online content creates a search cost. Finally, there are moral costs

about whether piracy is equivalent to theft. These costs provide the theoretical underpinnings for why the

introduction of a legal distribution channel, such as an OTT service, may decrease the demand for piracy

and thus have a substitution effect.

 Most previous piracy research focuses on how piracy affects demand for legal content and relatively

less attention has been devoted to examining how legal distribution channels affect the demand for piracy.

Three studies have made notable progress in this area. Danaher et al. (2010) use the removal of NBC

shows from the Apple iTunes store to identify the effect of a digital distribution channel on sales from

both physical channels and piracy channels. Their results show that the removal of NBC content led to an

11.4% increase in demand for NBC’s pirated content but no change in demand for NBC’s DVD content.

Danaher et al. (2015) use the addition of ABC shows to Hulu in 2008 as a natural shock and find that

 6
piracy decreased by 20% for the four weeks after the addition of ABC shows. De Matos et al. (2018)

examine the effect of OTT services on piracy consumption by randomly giving a sample of active cable

and BitTorrent users temporary access to a TV “cinema” package. They find that the provision of this TV

add-on increased TV viewing and decreased general Internet usage, but did not significantly decrease

BitTorrent downloads.

 Our research extends these three studies in several ways. First, we propose a new and relatively

cleaner identification strategy to examine the effect of an OTT service on piracy using the service-level

rather than content-level supply shock. A focus on the supply shock at the service level helps alleviate

concerns about spillover effects. That is, the treatment may affect the behavior of consumers in the

control group. For example, the removal of NBC content from iTunes (Danaher et al. 2010) may have

affected consumers’ viewing behavior of content produced by control channels. Second, we use a

synthetic control method, which extends the DiD method by selecting the control in a more data-driven

manner (Abadie et al. 2010, 2015). The synthetic control method is suitable for this empirical context

because of the relatively large donor pool (40 control countries). Research has also used this method to

assess the effect of TV advertising on online chatter (Tirunillai and Tellis 2017), the effect of opening a

physical showroom on sales (Li 2019), and the engagement and spillover effects of newspaper paywalls

(Pattabhiramaiah et al. 2019). Third, we explore the heterogeneity of the treatment effect by content

exclusivity and dialogue orientation.

3. Natural Experiment

3.1. Netflix and Its Global Market Expansion

Netflix was founded in the United States in August 1997 with an initial business model focused on DVD

rental by mail. In 2007, Netflix expanded its business by introducing streaming video on demand via the

Internet (Hardy 2007). With the growth in consumer demand for streaming content, Netflix began shifting

away from its initial core business of renting DVDs while investing heavily in the streaming platform.

After the market showed traction for streaming content, Netflix began slowly expanding into international

markets. In 2010, Canada became the first international market in which Netflix’s streaming services

 7
became available (Nowak 2010). In 2011, Netflix became available in Mexico, Central America, and the

Caribbean (Netflix 2011), followed by expansion to select European countries in 2012 (PR Newswire

2012). By the end of 2015, Netflix was available to 65 million members across 60 countries (Carter

2015). Despite the initial success of global market expansion, Netflix was still only available in less than

one-third of all potential global markets.

 On January 6, 2016, at the Consumer Electronics Show, Netflix announced that its service would be

immediately available to 130 additional countries around the world (Netflix 2016). 2 This was a major

market expansion of its services, as overnight it more than tripled the number of countries in which it

operated. As a result, Netflix became available globally in all countries except China, Crimea, North

Korea, and Syria (Stelter 2016).

3.2. Failure to Launch in Indonesia

Despite Netflix’s intention to remain available in 130 new countries, it failed to do so in Indonesia. On

January 27, 2016, Indonesia’s state-owned telecommunications provider, Telekomunikasi Indonesia (or

Telkom), blocked access to Netflix because Netflix did not have a permit to operate as a content provider

in Indonesia (Yuniar 2016). Telkom also shared the Indonesian Film Censorship Board’s concerns about

violent and adult content on Netflix. While other telecommunications options are available in Indonesia,

Telkom is clearly the dominant network. OTT services are most cost-effective for consumers on fixed

lines, and Telkom has a near monopoly of wired networks, commanding 85.7% market share as of 2016

(Frost 2018). The second player, Indosat, and other smaller providers, had a primary corporate focus on

voice and SMS instead of data, which make them a poor fit for OTT service usage. The block by Telkom

had a clear impact on Netflix’s availability in Indonesia and was not anticipated by Netflix. Using data

from Google Trends, we show in Figure 1 that searches for the term “Netflix” spiked on January 6, 2016,

and again at the end of January 2016, when Netflix was blocked in Indonesia. These spikes suggest that

neither Netflix’s intended introduction nor Telkom’s block was anticipated by Indonesian consumers.

2
 For the full list of countries where Netflix became available in January 2016, see Stelter (2016).

 8
After the block, searches for “Netflix” dropped considerably, nearly reverting to the preintroduction

levels when Netflix was not available in Indonesia.

 < Insert Figure 1 about here >

 Netflix’s failure to launch served as a natural shock to the availability of OTT services in Indonesia.

We therefore define the treatment as Netflix’s failure to launch in Indonesia. 3 Indonesia is the only

treated country where Netflix entered but was subsequently blocked. The remaining countries constitute

the control set in which Netflix both entered and remained available.

 Netflix remained largely unavailable in Indonesia until April 2017, when it reached an agreement

with Telkom (Cher 2017). Through this agreement, Telkom formed a strategic partnership with Netflix,

which resulted in the unblocking of Netflix’s content in Indonesia on April 12, 2017 (Maulani 2017). The

period between Netflix’s block in Indonesia on January 27, 2016, and unblock on April 12, 2017, creates

an appropriate posttreatment period for a natural experiment. However, Telkom allowed several local

competitors of Netflix to enter the Indonesian market between January 2016 and April 2017. The most

important entry was by iflix, a Malaysian streaming platform targeting emerging markets in Asia and, to a

lesser extent, Africa. Iflix entered Indonesia on June 16, 2016 (Piar Consulting 2016), suggesting that the

supply of OTT services increased after June 16, 2016. To avoid any confounding effects due to the

availability of other OTT services in Indonesia, we narrow the posttreatment window to the period

between January 27, 2016, and June 16, 2016, during which OTT services were largely unavailable in

Indonesia. We henceforth focus on a short-term rather than long-term treatment effect in this research.

4. Data

We collect data on multiple countries, titles, and measures. For countries, we compare piracy demand in

Indonesia with a broader set of Asian countries where Netflix entered and remained available. For video

3
 In comparative case studies it is conventional to call the single country where certain events or interventions
occurred as “treated” and the remaining countries as “controls” (Abadie et al. 2010). We follow previous synthetic
control literature and define the treatment as “Netflix’s failure to launch” rather than “Netflix’s availability,” given
our focus on the event occurring solely in Indonesia.

 9
content, we focus on Netflix titles that were widely available in these countries. For piracy demand, we

collect data on piracy search at the title–country–month level using multiple phrases.

4.1. Control Countries

While all other 129 countries in which Netflix entered and remained available could serve as a control

unit, to make the scope of data collection manageable, we focus on the 40 Asian countries in which

Netflix was introduced in January 2016 and remained available. The list includes 10 countries in

Southeast Asia (Brunei, Cambodia, Laos, Malaysia, Myanmar, the Philippines, Singapore, Thailand,

Timor-Leste, and Vietnam), five countries in East Asia (Hong Kong, Macau, Mongolia, South Korea, and

Taiwan), eight countries in South Asia (Afghanistan, Bangladesh, Bhutan, India, the Maldives, Nepal,

Pakistan, and Sri Lanka), 12 countries in West Asia (Armenia, Azerbaijan, Bahrain, Iraq, Kuwait, Oman,

Palestine, Qatar, Saudi Arabia, Turkey, United Arab Emirates, and Yemen), and five countries in Central

Asia (Kazakhstan, Kyrgyzstan, Tajikistan, Turkmenistan, and Uzbekistan). 4

 We calculate the number of Internet users for each country by collecting statistics of national

populations from the World Bank and Internet penetration rate from the International Telecommunication

Union. As of 2016, Indonesia was the third-largest country in Asia, with a population of 261 million and

an Internet penetration rate of 20.4%. This implies a total number of 53 million Internet users, which is a

country’s potential market size for piracy consumption. The number of Internet users in Indonesia is also

larger than that in other Southeast Asian countries: Vietnam has 49 million Internet users, the Philippines

has 45 million, Thailand has 29 million and Malaysia has 21 million.

4.2. Netflix Titles

We focus on Netflix titles that were available in Indonesia throughout the posttreatment period (January

27, 2016–June 16, 2016) to limit the scope of the study. We use the Wayback Machine on Finder.com’s

web pages to retrieve a list of 703 titles, including both movies and TV shows, available on Netflix in

Indonesia in January 2016. Because Netflix frequently updates its catalog, not all 703 titles may have

4
 Netflix was also available in Iran, but Google Ads, which we use to collect search data, is not available in Iran
(Prabhu 2011).

 10
been available throughout the entire posttreatment period. As the Wayback Machine does not provide a

full snapshot of Finder.com’s Netflix title lists in Indonesia after June 2016, we instead collect Netflix

titles that were available in Indonesia in March 2018 from an alternative source, JustWatch (2189 titles). 5

We find that 304 of the 703 titles remained in Netflix’s catalog in Indonesia as of March 2018. Online

Appendix A provides the names of all 304 Netflix titles. We assume that a title was available throughout

the posttreatment period if it appeared in Netflix’s catalog in both January 2016 and March 2018. For

these 304 titles, approximately one-third (109) are TV shows and two-thirds (195) are movies, and 16%

of the titles are Netflix originals (shows exclusively distributed by Netflix). 6

 We further check the availability of the 304 titles in the control countries. While similar retrieval of

Netflix titles across all 40 countries proved untenable, we do recover the list of titles for a small set of

countries neighboring Indonesia (India, the Philippines, Malaysia, and Vietnam) using the same method

as for Indonesia. We find that all 304 titles were available in at least one of these four countries, and

therefore focus on these titles in the main analysis. 7

4.3. Data on Piracy Search

Previous marketing and economics research has shown that keyword search frequency on online search

engines serves as a suitable proxy for (or a strong predictor of) consumer demand in contexts such as the

automotive market (Hu et al. 2014), movies and TV shows (Liu et al. 2016), news media (Lambrecht and

Misra 2017), recreational cannabis (Wang et al. 2019), and video games (Xiong and Bharadwaj 2014).

Studies in psychology, public heath, political science have also found that Google search data are highly

correlated with a variety of behaviors, such as suicides (Ma-Kellams et al. 2016), smoking cessation

(Ayers et al. 2014), voting decisions (Stephens-Davidowitz 2014), and drug-related crimes (Gamma et al.

2016). Following previous research, we use consumer search for piracy-related queries on Google as a

5
 We also used the Wayback Machine on JustWatch (https://www.justwatch.com/id/provider/netflix) to access
Indonesia’s Netflix catalog. The earliest record of JustWatch on the Wayback Machine was in June 2017. However,
the Wayback Machine only saved a subset of Netflix titles (60) in Indonesia.
6
 We treat TV shows with multiple seasons as one title.
7
 We show the robustness of the findings to the use of all 703 titles in Section 6.4.

 11
proxy for piracy demand. Specifically, we use Google Ads’ (formerly Google Adwords) keyword planner

to collect search data for each of the 304 Netflix titles in each country (the 40 control countries and

Indonesia). Google was the dominant search engine in Indonesia, accounting for 96.5% of all search in

2016 (Statcounter 2018). Google Ads reports monthly country-specific search volume for keywords. At

the time of our study, we were able to use Google Ads to collect search data from as early as October

2014 because Google Ads’ Keyword Planner only reports data for the past four years.

 We use Google Correlate and Google Trends to identify queries that consumers most frequently use

when trying to illegally download or stream movies and TV shows. To capture search for both streaming

piracy and methods requiring a download, such as torrents, for a title named X, we collect monthly search

volume for five keywords using the exact match method in Google Ads: “X torrent,” “watch X free,” “X

download,” “X free,” and “stream X free.” We then aggregate the search volume across these five

keywords as the monthly piracy search volume for each title–country combination from October 2014 to

June 2016. In some situations, titles overlap with terms that are not specific to the show of interest. This

occurs when the title, such as The Fall, is a phrase commonly used for another purpose, or that the title

refers to other downloadable products, such as video games (Star Trek), songs (Creep) or music albums

(Utopia). In these cases, we include additional words in the search keyword to ensure that we accurately

measure piracy activity for the exact movie or TV show in Netflix’s catalog. Specifically, we instead

collect data for “The Fall series,” “Star Trek movie,” “Creep movie,” and “Utopia series.” Despite this

collection filter, inspection of the search data indicated serious anomalies for two titles: Catch Me If You

Can and Piku; thus, we dropped these two titles and focused on the remaining 302 titles in subsequent

analyses. In Online Appendix B, we show the robustness of the findings to the inclusion of Catch Me If

You Can and Piku in sampled titles.

 During the data period (October 2014–June 2016), the monthly piracy search volume of an individual

title in Indonesia had a mean of 52.5 and a maximum of 4,000 searches, while the 40 control countries

had a mean of 15.2 and a maximum of 5,800 searches per title. This suggests that the mean of monthly

piracy search volume across all 302 titles is 52.5 × 302 = 15,855 in Indonesia and 15.2 × 302 = 4,590

 12
in the 40 control countries. Four of the top 10 titles with the highest piracy search volume in Indonesia

overlap with the highest search volume in the 40 control countries (The Lord of the Rings: The Fellowship

of the Ring, How to Train Your Dragon, Arrow, and Gravity), suggesting some discrepancy in the piracy

search interest between Indonesian consumers and representative consumers from the 40 control

countries.

 We also use Google Ads to collect several additional variables related to consumer search. These

variables include the monthly search volume of a title-associated keyword in each country, the monthly

search volume of the keyword “Netflix,” and the monthly search volume of keywords related to piracy

(“torrent,” “movie torrent,” “film torrent,” “TV show torrent,” and “TV series torrent”). To gauge the

search interest of the Netflix titles in the control countries, for each title we calculate the number of

control countries that have positive search volume of title-associated keywords during the data period.

Across the 302 titles, each title, on average, has positive search volume in 39 control countries (median =

40), suggesting the popularity of these titles in the control countries.

 To ensure that piracy search is a reasonable proxy for piracy demand, we collect additional data on

visits to piracy sites related to film or TV from MUSO, a leading piracy-tracking company. We check the

correlation of monthly country-specific piracy search volume from Google Ads with the piracy visit data

from MUSO. Here, piracy search volume refers to the total search volume of piracy-related keywords

used in the study (“torrent,” “download,” “watch free,” and “stream free”). As MUSO data are at the daily

level, we aggregate the piracy visit in each country to the monthly level to be comparable with the search

data. This correlation check is based on data from January 2017 (the first month in MUSO’s database) to

October 2019 (34 months) in all 41 Asian countries, which results in 1,394 observations in total. Piracy

search volume is strongly correlated with piracy visits related to film or TV (r = 0.651). The correlation

between search volume and piracy visits related to film or TV is also strong in Indonesia (r = 0.587).

These correlations provide empirical support for the use of piracy search volume as a proxy for piracy

demand. Unfortunately, MUSO’s piracy visit data cannot be used as the main dependent variable in this

 13
research because MUSO’s data begin in January 2017, whereas the posttreatment period in this study

ends in June 2016.

5. Empirical Analysis

We conduct two sets of empirical analyses to examine the effect of Netflix’s failure to launch and

subsequent unavailability in Indonesia on consumer search for piracy. We first present a DiD model, and

then relax the identifying assumptions of a DiD model by employing a synthetic control method. We

proceed by discussing the suitability of the synthetic control method to this empirical context,

highlighting identifying assumptions, and finally presenting estimation results.

5.1. DiD Analysis

To examine the effect of Netflix’s unavailability in Indonesia on piracy search, we first consider a DiD

model in which we use the 40 other Asian countries where Netflix simultaneously entered as individual

control markets. We consider the following specification:

 = + × + + , (1)

where represents aggregate normalized piracy search volume in country i ( ∈ [1, … ,41]) at month t

( ∈ [−15, … − 1,1, … 5]). We exclude observations in January 2016 ( = 0) to be consistent with the

definition of pretreatment period from October 2014 to December 2015.

 We calculate the normalized piracy search volume in two steps. First, we aggregate the piracy

search volume for each title k, denoted by , across the 302 titles to obtain country- and month-specific

raw piracy search volume denoted by . Second, we normalize the piracy search volume by dividing

by the level at the month of intervention ( = 0). In other words, = , where = ∑ . As the
 0

raw piracy search volume is generally greater in countries with larger populations such as India and

Indonesia, the normalized value allows the dependent variable and, thus, the estimated coefficient (effect

 14
size) to be comparable across countries. 8 For ease of exposition, we refer to as the “piracy search

volume” hereinafter.

 In Equation (1), is an indicator variable that takes the value of 1 for the posttreatment period

and 0 otherwise; stands for country fixed effects; and β captures the overall change in piracy search,

across all countries, after the treatment (Netflix’s failure to launch in Indonesia). The main parameter of

interest is , which captures the change of piracy search in Indonesia after the treatment relative to that in

the control countries. A positive would indicate that Netflix’s failure to launch in Indonesia led to an

increase in piracy search there compared with the control countries, averaged across the five

posttreatment months.

 We present the DiD estimation results in Table 1. Given the small number of treated units (one in this

setting), the typical asymptotic inference based on a large number of policy changes tends to bias the

estimates on standard errors (Conley and Taber 2011). We therefore follow the literature to report the p-

value of from permutation inference, in addition to the p-value from robust standard error. The results

show that Netflix’s unavailability led to a 17.9% increase in piracy search in Indonesia relative to the

control countries ( = 0.179, p < 0.10). We show in Online Appendix C that alternative variations of the

DiD model lead to qualitatively similar results.

 < Insert Table 1 about here >

 A critical identifying assumption for the DiD method is that, in the absence of intervention, control

and treatment groups will have parallel trends in average outcomes during the pretreatment period. If the

parallel trends assumption fails, the control group will not be a good counterfactual for Indonesia, and

therefore the DiD estimates will be biased. Although the parallel trends assumption is not directly

testable, researchers usually have more confidence in its validity when they find that the average

outcomes of the treated and control units follow a similar path in pretreatment periods. We follow

8
 Without normalization, the scales will not be comparable across countries. For example, the 1,591 increase in
monthly piracy search volume before and after the treatment is a moderate change for Indonesia (mean = 15,844),
but a gigantic change for a smaller country such as Bhutan (mean = 86.2).

 15
Danaher et al. (2010) and examine this pattern by plotting the predicted monthly piracy search volume in

Indonesia and the control countries using the following model specification:

 = ∑ =5 =5
 =−15 ℎ + ∑ =−15 ℎ × + + , (2)

where ℎ is an indicator variable for month t and the other variables are the same as in Equation (1).

If the parallel trends assumption holds, will be equal to 0 for each pretreatment month. We plot the

predicted monthly piracy search volume for Indonesia and the control countries in Figure 2, where piracy

levels in Indonesia are given by + + � ( ) and piracy levels in control countries are + � ( ).

Here, � ( ) and � ( ) are the average baseline piracy searches during the pretreatment period for the

treated and control countries. The patterns in Figure 2 do not strongly support the parallel trends

assumption because the trend of piracy search in the control countries deviates from the trend in Indonesia

before the treatment. We further test if = 0 for = −15, … , −1. Of the 15 tests, 13 are rejected at the

5% level. A Wald test of the null hypothesis that all { } =−1
 =−15 are jointly equal to 0 is also rejected at the

0.1% level.

 < Insert Figure 2 about here >

 The lack of strong evidence for a parallel trend in the DiD model using aggregate controls leaves two

options. We can either identify one or a few selected countries from the 40 countries that fit Indonesia

better before the treatment, or use a synthetic control method. We investigate the former option in Online

Appendix C, where we provide additional model-free evidence of the treatment effect using individual

control markets. However, this option of manually selecting control countries requires researchers to

make ad-hoc assumptions. For example, at what level of fit do we decide if a country is appropriate for

the control? Should we assign equal or different weights to those selected countries when forming the

control? If nonequal weights are preferred, how should we determine the weights? These ad hoc

assumptions rely on subjective criteria and therefore make the first option unappealing (Abadie et al.

2010). We therefore focus on the latter option, the synthetic control method.

5.2. Synthetic Control Method

 16
The synthetic control method extends the conventional DiD framework by allowing the effect of unobserved confounders on the outcome to vary over time (Abadie and Gardeazabal 2003, Abadie et al. 2010). By using matching methods conditioned on pretreatment covariates and outcomes, the synthetic control method helps balance the effect of potential time-varying confounders between the treated and control groups (Xu 2017). Whereas the DiD analysis assigns equal weights to all control countries, the synthetic control method estimates weights for each of the 40 countries in a data-driven manner so that the resulting synthetic Indonesia best approximates the actual Indonesia on stated features during the pretreatment period. After constructing the synthetic control country, we calculate the treatment effect as the average gap between the predicted piracy search volume in the synthetic control and the actual piracy search volume in Indonesia during the posttreatment period. 5.2.1. Model. Following Abadie et al. (2010, 2015), we define the synthetic control country as a weighted average of the J countries in the control group. Let = 1 represent the focal treated country (Indonesia) and ∈ [2, … , + 1] represent the potential control countries. The predicted outcome in the = +1 synthetic control is represented by ∑ =2 , where = � 2 , … , +1 � is a ( × 1) vector of +1 country-specific nonnegative weights ( ∈ [0,1] and ∑ =2 = 1). We select the optimal weights ( *) to minimize the difference between the pretreatment characteristics of the treated country and the synthetic control during the pretreatment period. Let 1 denote an ( × 1) vector of pretreatment characteristics for the treated country and 0 denote the corresponding ( × ) matrix of pretreatment characteristics for the J control countries. Then, we obtain the optimal weights * by minimizing ∑ 2 =1 ( 1 − 0 ) , (3) where 1 represents the value of mth pretreatment characteristic of the treated country, 0 is the corresponding vector of the same characteristic of the J control countries, and is a weight measuring the relative importance of each pretreatment characteristic in matching the treated unit and the synthetic control. According to Abadie et al. (2010, 2015), a pretreatment characteristic with greater prediction 17
power on the outcome should be assigned with a larger . Specifically, can be chosen by minimizing

the mean squared prediction error (MSPE) of the outcome variable in the pretreatment period.

 Given the optimal weights ( *) derived from minimizing Equation (3), the synthetic control

estimator for the treatment effect in posttreatment period t is given by

 = +1
 �1 = 1 − ∑ =2 ∗ , (4)

where �1 is the gap between the treated unit and the synthetic control.

 5.2.2. Matching Characteristics. Abadie et al. (2010, 2015) recommend using predictors of

posttreatment outcomes (piracy search volume of Netflix titles) as pretreatment characteristics. We

therefore include the following country-specific variables as pretreatment characteristics for constructing

the synthetic control: title search volume (monthly search volume for all sampled Netflix titles), interest

in Netflix (monthly search volume for the keyword “Netflix”), interest in general piracy (monthly search

volume for piracy-related keywords mentioned in Section 4.3), interest in competitors (monthly search

volume for keywords of Netflix’s major competitors 9), and Internet users (annual). Following Abadie et

al. (2010, 2015), we also include the pretreatment outcome (piracy search volume) in 0 and 1 . 10

 5.2.3. Identifying Assumptions. For the synthetic control method to yield valid results, four

identifying assumptions must be met. First, the treated and the synthetic control country should exhibit

similar patterns in the pretreatment period (Abadie et al. 2010). Subsequently, we provide evidence that

the gap in piracy search volume between Indonesia and the synthetic control country is close to zero

before the treatment.

 The second assumption is that only the treated unit (Indonesia) undergoes the treatment – Netflix’s

failure to launch – and any control country did not. An extensive search confirms that none of the 40

9
 We collect the search volume data for the following keywords of Netflix’s competitors: “Amazon Prime,”
“Catchplay,” “Fimplus,” “Genflex,” “HOOQ,” “Hulu,” “iflix,” “Tribe,” “Viki,” “Viu,” “Voot,” and “YuppTV.”
10
 We check the robustness of the results to adding additional economic factors (gross domestic product,
employment rate, and inflation rate) to pretreatment characteristics. The inclusion of these factors led to a worse
match of the pretreatment period (as indicated by larger MSPE). We therefore focus on a parsimonious model
without these economic factors.

 18
control countries in Asia experienced Netflix unavailability during the intervention period (February

2016–June 2016).

 Third, according to Abadie et al. (2010), the treatment that occurred in the focal country should not

affect the outcome in the control countries, and vice versa. In other words, there should be no spillover

effects of the treatment (or lack of the treatment). The spillover effect might occur if Indonesians used

Virtual Private Networks (VPNs) to access Netflix through the service in control countries after the block

of Netflix in the domestic market. However, cross-country access was unlikely during the period of

analysis because, in January 2016, Netflix expended substantial effort to prevent customers from

bypassing country lines using unblocking tools such as VPNs (Verge 2016). While we are unable to fully

verify this assumption, there is substantial evidence that Netflix’s failure to launch in Indonesia had little

influence on piracy demand in other countries because of language, cultural, and regulatory differences,

as well as Netflix’s increasing emphasis on setting virtual country restrictions. The spillover effect can

also occur if Indonesians tend to read news from foreign countries, which enables the news about Netflix

and its content in these foreign countries to affect Indonesians’ piracy behavior through WOM. We

investigate this issue in Online Appendix D and provide evidence that mitigates the concerns about

spillovers of WOM.

 The fourth assumption requires that there are no alternative changes to either the treated or control

countries during the posttreatment period. This implies that, at a minimum, no other alternative OTT

service providers should enter during this time period. If alternative events occur, the estimates would

actually measure the combined effects of the focal intervention and these alternative ones. As discussed in

Section 3.2, we choose a posttreatment window during which there were no significant events that might

affect piracy in Indonesia, so this assumption holds. In Section 5.3, we further verify this assumption for

the countries that contribute to the formation of the synthetic control country. The price charged by

Netflix may also be heterogenous across countries, although as shown in Online Appendix D, that does

not appear to be the case.

5.3. Results

 19
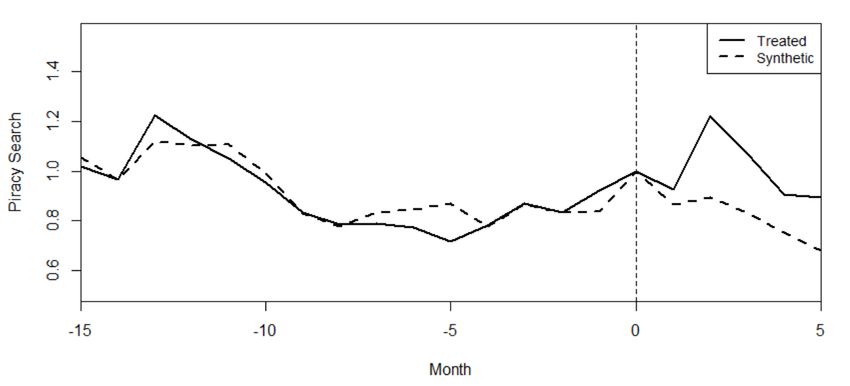
We construct the synthetic control country for Indonesia from a collection of 40 Asian countries by

matching pretreatment characteristics from October 2014 to December 2015 (15 months). Table 2 shows

the full list of potential control countries and associated weights ( ∗ ) in the synthetic Indonesia. The

weighting algorithm identifies a synthetic control country that puts substantial weights on four countries:

Thailand (0.43), Palestine (0.38), the Philippines (0.12), and India (0.08). These countries appear to be

reasonable proxies for Indonesia. For example, Thailand and the Philippines are geographic neighbors of

Indonesia. In addition, Indonesia has a large Muslim population, which aligns with the characteristics of

Palestine. While these control countries appear to have high external validity, there exists other countries,

such as Malaysia, which are not members of this group. In Online Appendix D, we provide further detail

on why some countries that seem similar to Indonesia, may not be selected by the synthetic control

method. Finally, we also search for notable demand shocks in the four control countries during the

posttreatment period as an additional check of the fourth assumption in Section 5.2.3.

 < Insert Table 2 about here >

 Table 3 presents the means of pretreatment characteristics for Indonesia, the synthetic control

country, and the 40 control countries. As this table shows, the synthetic control country is more similar to

Indonesia than the control with equal weights – which is the control used in the DiD analysis. For

example, before the intervention, the total search volume of Netflix titles in an average control country

was only 43% of the level in Indonesia. By contrast, the search volume of Netflix titles in the synthetic

Indonesia achieves a much better match (94%).

 < Insert Table 3 and Figure 3 about here >

 Figure 3 depicts the trajectory of piracy search volume of Netflix titles in Indonesia (solid) and its

synthetic counterpart (dashed) over the period of analysis. First, the synthetic control country fits

Indonesia reasonably well during the pretreatment period ( < 0), providing support for the first

assumption in Section 5.2.3. Second, there is a statistically significant downward trend in piracy search

volume during the pretreatment period (Indonesia: slope = –0.021, p = 0.007; synthetic control country:

slope = –0.021, p = 0.001). However, after Netflix’s entry into the control countries at = 0, the piracy

 20
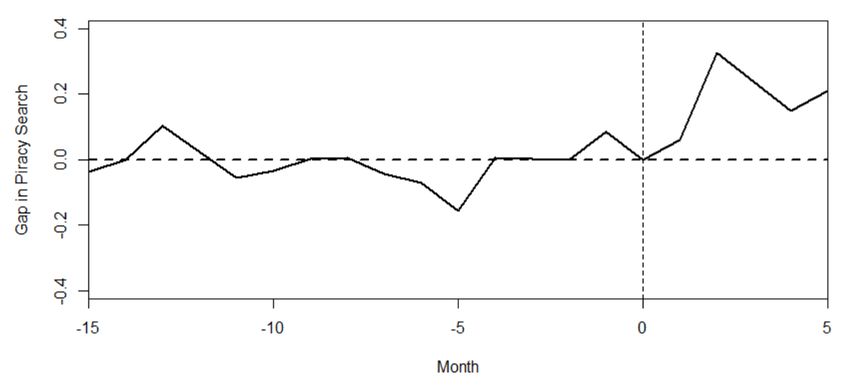
search volume in the synthetic control country moves further downward and is always below the piracy

search volume in Indonesia, which suggests an increase in piracy search volume in Indonesia relative to

the synthetic control country after the treatment. Such a divergence in piracy search volume between

Indonesia and the synthetic control country is also apparent in the difference in trends after the treatment.

The downward trend of piracy search volume in Indonesia is similar before and after the treatment,

although the posttreatment slope is not statistically significant (slope = –0.021, p = 0.541). The downward

trend in piracy search volume in the synthetic control country is steeper after the treatment (slope = –

0.057, p = 0.003) than beforehand.

 The gap plot in Figure 4 illustrates the magnitude of the effect of Netflix’s unavailability in Indonesia

on piracy search. The relatively small gap in the first month after the treatment ( = 1) suggests that the

effect is not strong initially. However, from March 2016 ( = 2) onward, the effect becomes more

pronounced, perhaps because consumers came to realize that the block was not temporary and therefore

began seeking piracy to substitute the OTT service. The average gap in piracy search volume between the

actual and the synthetic Indonesia totals 0.197 over the five months following Indonesia’s Netflix block,

which suggests that Netflix’s unavailability is associated with a 19.7% increase in piracy search in

Indonesia relative to the other 40 countries where Netflix entered and remained available. This effect size

is comparable to the 20% decrease in piracy of ABC’s content after that content was added to Hulu

(Danaher et al. 2015). This comparison is notable despite substantial differences between Hulu and

Netflix at the time of each study; Hulu was a free service with only licensed content in 2008, whereas

Netflix in 2016 was a paid service with both licensed and original content. In contrast, Danaher et al.

(2010) found that the removal of NBC shows from iTunes led to an 11.4% increase in demand for pirated

content. This lower magnitude might have occurred because iTunes is merely an a la carte service.

 There are at least two possibilities that might lead to an overestimation of the treatment effect. One, if

the three-week availability of Netflix in Indonesia in January 2016 generated some demand for content,

the gap estimates using data from the five posttreatment months can be a combined effect of Netflix’s

unavailability from February to June and the short-term operation of Netflix in January. Second, the spike

 21
in piracy search in Indonesia in March 2016 may be an outlier, the inclusion of which may result in an

overestimated treatment effect. We consider these two possibilities in Online Appendix D and present

empirical evidence that neither of them is likely to hold, which suggests that the estimated treatment

effect is unlikely to be biased.

 < Insert Figure 4 about here >

 We follow the synthetic control literature by using permutation inference to assess the significance of

treatment effect (Abadie et al. 2010, 2015, Tirunillai and Tellis 2017). 11 For each country j in the control

group ( = 2, … , 41), we iteratively estimate the average posttreatment gap in piracy search volume

relative to that of the synthetic control of this country. We then use the distribution of these placebo

treatment effects to measure the significance of the actual treatment effect.

 Two measures are often used to evaluate the significance of the treatment effect obtained from the

synthetic control method. The first measure is the ratio of post-/pretreatment MSPE obtained from

placebo runs across countries (Abadie et al. 2010, 2015, Tirunillai and Tellis 2017). The main advantage

of this method is that it does not require choosing a cutoff to determine the inclusion of well-fit placebo

tests. In other words, it uses information from all placebo runs. If the post-/pretreatment MSPE ratio is

greater for Indonesia than for the other countries, we can confidently reject the null hypothesis that

Netflix’s failure to launch in Indonesia has no effect on piracy search. The pretreatment MSPE of piracy

search in Indonesia is 0.003, while the mean and median of pretreatment MSPE among the 40 other

countries are 0.072 and 0.012. As Figure 5 shows, Indonesia has a greater post-/pretreatment MSPE ratio

than any of the other 40 countries; thus, the probability of obtaining a post-/pretreatment MSPE ratio as

large as Indonesia’s is 1/41 = 0.024, if the event randomly occurred in one of the 41 Asian countries.

 < Insert Figure 5 about here >

 The second measure is to simply compare the size of gaps across all countries. The downside of this

test is that it may be biased by countries lacking a suitable synthetic control, which typically have a poor

11
 Recent studies such as Xu 2017 and Li 2019 have developed inferential theories for extended versions of the
synthetic control method. An inferential theory for the standard synthetic control method is still lacking.

 22
pretreatment fit. Figure 6 shows the results from the placebo tests. The gray lines in panel (a) depict the

estimated gaps for each of the placebo tests of the 40 control countries, and the black line represents the

estimated gap for Indonesia. The figure suggests that, for many countries, the synthetic control method

does not provide a good fit for piracy search during the pretreatment period. As Abadie et al. (2010) note,

placebo tests with poor pretreatment fit do not provide information to gauge the potential randomness of

observing a large posttreatment gap from a country with a good fit before the intervention. We follow

Abadie et al. (2010) and exclude countries that have a pretreatment MSPE beyond a certain level.

 We replot the placebo tests in panels (b) and (c) of Figure 6 by excluding countries with a

pretreatment MSPE of more than 10 times and two times the MSPE of Indonesia. Among the 31 countries

remaining in panel (b), the average posttreatment gap of Indonesia is the third-highest (after Myanmar

and Nepal), suggesting a probability of 3/31 = 0.097 of observing a gap of the magnitude that is equal to

or greater than the gap for Indonesia under a random assignment of the treatment in the data. The

significance of the positive gap for Indonesia becomes more visible in panel (c) when we lower the cutoff

on pretreatment fit to twice that of the MSPE of Indonesia. The average gap for Indonesia is the highest

among the 12 countries, suggesting a 1/12 = 0.083 chance of observing the same gap as Indonesia’s if the

treatment were randomly assigned to a country.

 < Insert Figure 6 about here >

5.4. Heterogeneous Effects of the Treatment

5.4.1. Moderating Role of Content Exclusivity. We examine the moderating role of content exclusivity

to better understand whether the main positive treatment effect of Netflix’s unavailability in Indonesia on

piracy search is driven solely by the substitution effect, or by a combination of the substitution effect and

the market expansion effect. If the main effect is driven solely by substitution, we expect the positive

treatment effect to be stronger for Netflix originals. Unlike nonoriginal content, which is available from

multiple legitimate sources, original content is exclusively broadcast on Netflix. Therefore, it is

impossible for consumers to find the same show from other legitimate sources if Netflix becomes

unavailable. This argument suggests a higher level of substitution between the OTT service and piracy for

 23
original content than for nonoriginal content. 12 Let and denote the positive substitution effect of

Netflix’s unavailability in Indonesia on piracy search for original and nonoriginal content, respectively.

Given the previous reasoning, we expect > > 0, where the superscript “S” stands for substitution,

the subscript “O” stands for original content, and the subscript “N” stands for nonoriginal content.

 Theoretically, it is also possible that an OTT service increases demand for piracy because of the

increase in WOM and promotion associated with the introduction of the OTT service, which may drive

consumers to seek out the same content provided by the OTT platform through piracy. Since such a

market expansion effect is usually more pronounced for the introduction of new products than existing

products (Chen et al. 2005), we expect the market expansion mechanism to lead to a more negative effect

of Netflix’s unavailability in Indonesia on piracy search for original content than nonoriginal content.

Formally, we expect < < 0, where and denote the potential negative market expansion

effects of Netflix’s unavailability in Indonesia on piracy search for original and nonoriginal content,

respectively, and the superscript “E” stands for expansion.

 This discussion suggests that if only a substitution effect is present, the net effect of the treatment for

original content will be stronger than that for nonoriginal content (Δ = Δ = − > 0). However,

if both effects exist, the net effect for Netflix originals will be either positive or negative, depending on

the relative strength of the two effects. Let = + ( = + ) denote the net effect for

original (nonoriginal) content. When both substitution and market expansion effects exist, the difference

in the net effect of treatment between original and nonoriginal content is the same as the difference

between the change in piracy substitution and the change in piracy expansion: Δ = − = Δ −

Δ , where Δ = − > 0 and Δ = − > 0. If the magnitude of the market expansion

effect for original content relative to nonoriginal content (Δ ) outweighs the magnitude of the

substitution effect for original content relative to nonoriginal content (Δ ), we expect to observe a

weaker net effect of treatment on piracy search for original content than nonoriginal content (Δ < 0).

12
 We provide more details and empirical support for this argument in Online Appendix C.

 24
You can also read