The effects of a solar eclipse on photo-oxidants in different areas of China
←
→
Page content transcription
If your browser does not render page correctly, please read the page content below
Atmos. Chem. Phys., 11, 8075–8085, 2011
www.atmos-chem-phys.net/11/8075/2011/                                                                     Atmospheric
doi:10.5194/acp-11-8075-2011                                                                                Chemistry
© Author(s) 2011. CC Attribution 3.0 License.                                                             and Physics

The effects of a solar eclipse on photo-oxidants in different areas of
China
J.-B. Wu1,5 , Z. F. Wang1 , W. Zhang2 , H. B. Dong1 , X. L. Pan1 , J. Li1 , C.-Y. Lin3 , and P. H. Xie4
1 StateKey Laboratory of Atmospheric Boundary Layer Physics and Atmospheric Chemistry (LAPC), Institute of
Atmospheric Physics, Chinese Academy of Science, Beijing 100029, China
2 Aviation Meteorological Center of China, Beijing 100122, China
3 Research Center for Environmental Changes, Academia Sinica, Taipei, Taiwan
4 Key Lab. of Environment Optics & Technology, Anhui Institute of Optics and Fine Mechanics, Chinese Academy of

Sciences, Hefei, China
5 Graduate University of Chinese Academy of Science, Beijing, China

Received: 31 December 2010 – Published in Atmos. Chem. Phys. Discuss.: 24 January 2011
Revised: 31 July 2011 – Accepted: 1 August 2011 – Published: 8 August 2011

Abstract. This study investigates the effects of the total so-    eas. The change in radical concentrations during the eclipse
lar eclipse of 22 July 2009 on surface ozone and other photo-     reveals that nighttime chemistry dominates in both clean and
oxidants over China. A box model was used to study the            polluted areas. As solar eclipses provide a natural oppor-
sensitivity of ozone to the limb darkening effect during an       tunity to test more thoroughly our understanding of atmo-
eclipse event, and to show that the impact on ozone is small      spheric chemistry, especially that governed by photolysis, a
(less than 0.5 %). In addition, the regional model WRF-           comprehensive experimental campaign during a future solar
Chem was applied to study the effects of the eclipse on me-       eclipse is highly desirable.
teorological and chemical parameters, focusing on different
regions in China. Chemical and meteorological observations
were used to validate the model and to show that it can cap-
ture the effects of the total solar eclipse well. Model calcu-    1   Introduction
lations show distinct differences in the spatial distributions
of meteorological and chemical parameters with and with-          Solar eclipses provide a rare and challenging opportunity to
out the eclipse. The maximum impacts of the eclipse occur         investigate how meteorological and photochemical processes
over the area of totality, where there is a decrease in sur-      respond to abrupt changes in incident solar radiation. Tem-
face temperature of 1.5 ◦ C and decrease in wind speed of         perature, solar irradiance, relative humidity, wind and cloudi-
1 m s−1 . The maximum impacts on atmospheric pollutants           ness within the surface layer are among the most common
occur over parts of north and east China where emissions are      meteorological parameters explored by previous studies of
greater, with an increase of 5 ppbv in NO2 and 25 ppbv in         solar eclipses (Fernandez et al., 1993, 1996; Hanna, 2000;
CO and a decrease of 10 ppbv in O3 and 4 ppbv in NO. This         Psiloglou and Kambezidis, 2007; Emde and Mayer, 2007;
study also demonstrates the effects of the solar eclipse on       Kazadzis et al., 2007). The drop in surface temperature dur-
surface photo-oxidants in different parts of China. Although      ing a solar eclipse is of broad interest and becomes noticeable
the sun was obscured to a smaller extent in polluted areas        when the sun is about half covered (Anderson, 1999). Most
than in clean areas, the impacts of the eclipse in polluted ar-   studies find similar patterns of temperature change, with the
eas are greater and last longer than they do in clean areas.      lowest values occurring a few minutes after maximum solar
In contrast, the change in radical concentrations (OH, HO2        coverage, but the reduction experienced may not be directly
and NO3 ) in clean areas is much larger than in polluted areas    determined by the magnitude of the eclipse, but by the sur-
mainly because of the limited source of radicals in these ar-     rounding environment and local conditions (Founda et al.,
                                                                  2007; Gerasopoulos et al., 2008). Recent research into the
                                                                  meteorological effects of solar eclipses reveals a decrease in
                    Correspondence to: Z. F. Wang                 mean wind speed during an eclipse, and this is attributed to
                    (zifawang@mail.iap.ac.cn)                     the combined effect of a decrease in the thermal gradient and

Published by Copernicus Publications on behalf of the European Geosciences Union.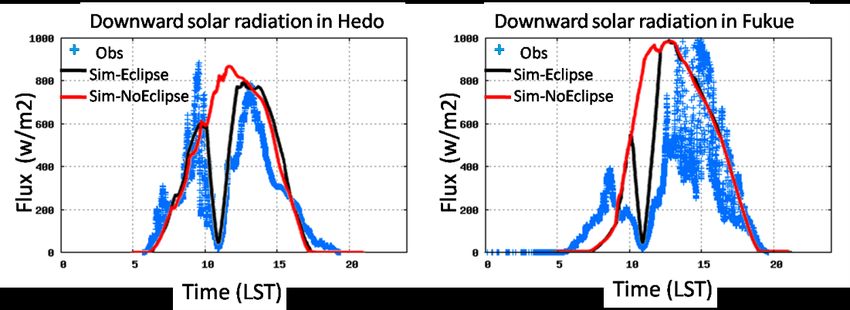
8076 J.-B. Wu et. al.: The effects of a solar eclipse on photo-oxidants
1
the stabilization of the surface layer due to the temperature
drop (Amiridis et al., 2007).
Solar eclipses also enable evaluation of the response of
(a)
the gas-phase chemistry of atmospheric photo-oxidants to
a large, short-term perturbation in solar radiation. Plausi-
ble variations in stratospheric composition caused by solar
eclipses have been addressed by earlier studies (Mims and
Mims, 1993; Zerefos et al., 2000; Gogosheva et al., 2002).
Previous studies have also focused on the effects on tropo-
spheric ozone and other photo-oxidants. A decrease in sur-
face ozone concentration was observed during a number of
solar eclipse events (Srivastava et al., 1982; Tzanis, 2005;
Zanis et al., 2001). In the solar eclipse of 11 August 1999,
there was a time lag between the maximum of the eclipse
and the maximum of the induced ozone decrease (Zerefos
et al., 2001). Abram et al. (2000) describe hydroxyl radi-
cal and ozone measurements during the solar eclipse of 1999
and show that the OH concentration was well correlated
(r = 0.88) to its rate of primary production from2 ozone pho-
tolysis. In the same event, the partitioning of NOx between
NO and NO2 was determined almost exclusively by varia-
tions in J NO2 (Fabian et al., 2001). More recently in the
total solar eclipse of 29 March 2006, observations and mod-
(b)
eling show that there was a significant decrease in O3 and NO
and an increase in NO2 at polluted sites, but no clear impact
on these pollutants at unpolluted sites (Zanis et al., 2007).
The decrease in the surface ozone concentration that was ob-
served after the beginning of the eclipse lasted two hours,
probably due to the decreased efficiency of photochemical
ozone formation (Tzanis et al., 2008).
Although the most important chemical mechanisms con-
trolling atmospheric composition have been identified and
studied, further investigation is necessary to 3explain the
complex interactions involving meteorological, topographic,
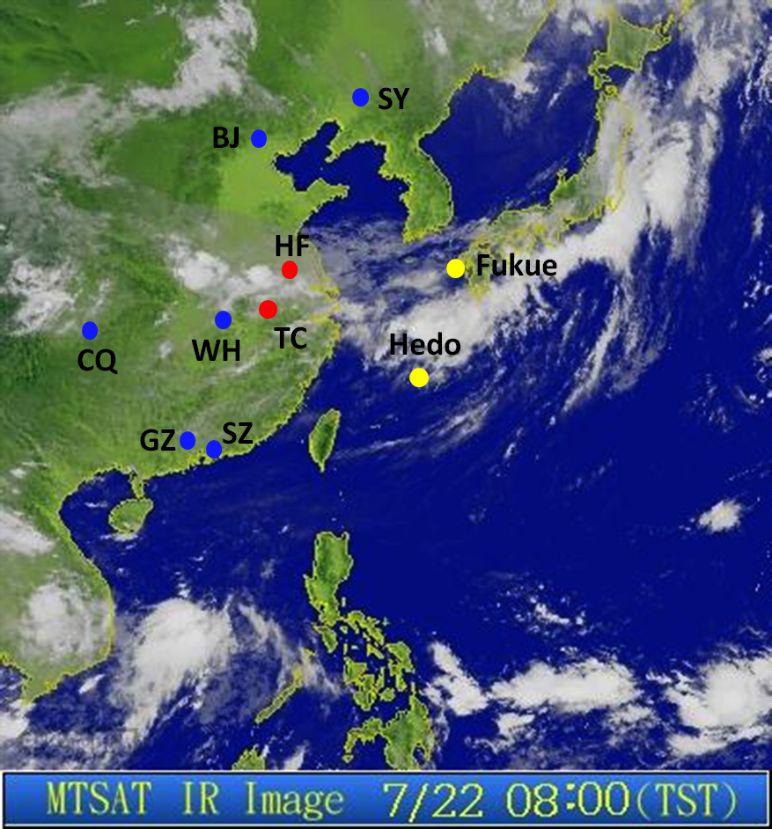
emission and chemical parameters (Varotsos, 1994, Fig. 1.In(a) Satellite
4 2005). Fig. 1. image at theimage
(a) Satellite beginning
at the of the solar
beginning of eclipse
the solar(08:00
eclipseBJT, 22 Jul
5
addition, solar eclipses are unique since they happen 2009); (08:00 BJT, 22 July 2009); blue points represent
in dif-blue points represent observation sites with 2-m temperature observation sites data, yellow
ferent seasons, at different times of day, in different with 2-m temperature data, yellow points represent sites with down-
6 locations
points represent sites with downward solar radiation data, and red points represen
and under different synoptic conditions. On 22 ward solar radiation data, and red points represent sites with at-
7 July 2009
sites with atmospheric pollutant
mospheric pollutant data;
data; (b) (b) domains
domains for WRF-Chem
for WRF-Chem simulation wit
simulation
a total solar eclipse was visible along a narrow8bandNO across
2 emission rates
with NO2(moles/s) from(moles
emission rates the SMOKE
s ) frommodel;
−1 the SMOKEthe red boxthe
model; represents tw
China from western Asia to the Pacific Ocean (Fig. 1b), while
9 areas with different emission two
red box represents levels,
areasandwiththe shadedemission
different zone shows
levels,the
andpath
the of the tota
a partial eclipse was seen within a much broader area along
10 solar eclipse shaded
across zone
China. Thethe
shows domain-averaged maximum
path of the total solar eclipse sun coverage
across China. is 74.1% i
the main axis which covered most of eastern Asia and the The domain-averaged maximum sun coverage is 74.1 % in the pol-
Pacific Ocean. After leaving mainland Asia, the 11
paththe polluted area and 96.8% in the clean area.
curved luted area and 96.8 % in the clean area.
southeastward across the Pacific Ocean. More details on
the path of this eclipse and its local circumstances can be
found at the NASA eclipse web site (http://eclipse.gsfc.nasa. The present study investigates the chemical changes oc-
gov/SEmono/TSE2009/TSE2009.html). The umbral shadow curring during the total solar eclipse of 22 July 2009, focus-
of this eclipse first touched down in China at 08:56 Beijing ing on surface ozone and other photo-oxidants in different 2
Time (BJT) and left the mainland at 11:04 BJT after more parts of China. A box model was first used to test the sen-
than 2 h over China, and this may have had a significant im- sitivity of ozone to the limb darkening effect, which is de-
pact on atmospheric composition. This eclipse provides a scribed in Sect. 2. In order to simulate the changes in both
natural perturbation to atmospheric chemistry that allows us meteorological and chemical variables during the eclipse,
to test our understanding more thoroughly. an online numerical approach was adopted using the WRF-
Chem model. A full description of the method used and val-
idation of the model is given in Sect. 3; Sect. 4 describes
Atmos. Chem. Phys., 11, 8075–8085, 2011 www.atmos-chem-phys.net/11/8075/2011/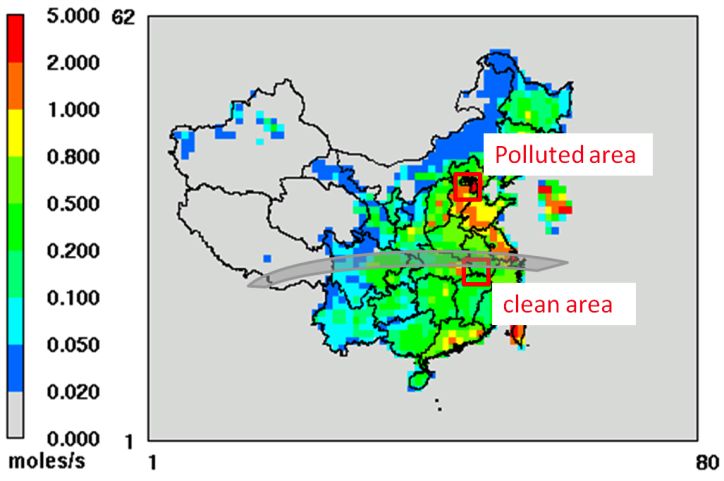
J.-B. Wu et. al.: The effects of a solar eclipse on photo-oxidants                                                                                     8077

the main results of the experiments and the conclusions are
                                                                                                             (a)                                          (b)
presented in Sect. 5.

2   Sensitivity analysis of the limb darkening effect

At different times during an eclipse, the disk of the moon
covers different parts of the limb and the center of the sun.
This limb darkening is spectrally dependent because radia-
tion from the limb of the solar disk is less intense than that       1
from the centre. Thus the spectral composition of the irradi-
                                                                     2   Fig. 2. (a) Normalized radiation as a function of X, the distance between the centers of
ance of the sun changes during the eclipse (Emde and Mayer,          3   Fig.
                                                                         the sun2. and
                                                                                     (a)moon,
                                                                                          Normalized
                                                                                               during the radiation
                                                                                                           eclipse for as  a function
                                                                                                                       different        of X,(b)the
                                                                                                                                 wavelengths;        distance
                                                                                                                                                  Effect of limb
2007; Kazantzidis et al., 2007; Koepke et al., 2001).                4   darkening asthe
                                                                         between        a function
                                                                                           centersof of
                                                                                                     X for
                                                                                                         thedifferent
                                                                                                               sun andwavelengths
                                                                                                                           moon, (calculated
                                                                                                                                   during the using equationfor
                                                                                                                                                 eclipse      E3
   Based on consideration of radiative transfer within the so-       5   in the text).wavelengths; (b) Effect of limb darkening as a function of
                                                                         different
lar atmosphere, the limb darkening can be expressed as a             6   X for different wavelengths (calculated using Eq. (3) in the text).
function of r, the relative distance from the centre of the solar
                                                                     7
disk (Waldmeier, 1941; Scheffler, 1974),
                 √                                                          Figure 2b presents the spectral dependence of solar radi-
          1 + βγ 1 − r 2                                                 ation during the eclipse compared to the case with no limb
0γ (r) =                                                      (1)
              1 − βγ                                                     darkening, which is calculated using:
where r = 0 represents the centre and r = 1 the limb of the              {Inorm (γ ) − Inorm (noLD)}/Inorm (γ ) × 100 %                                    (3)
sun. The limb darkening coefficient βγ is a function of wave-
length (Waldmeier, 1941):                                                It is clear that shorter wavelengths are affected more by the
                √ 4
                                                                         limb darkening effect. The reduction in radiation is more
      3·h·c· 2                                                           significant when close to the central part of the eclipse. When
βγ =                                                      (2)
      8 · k · γ · Ts                                                 8
                                                                         |X| > 0.9, Inorm (γ ) is reduced by more than 60 %, 30 % and
                                                                         10 % at 310 nm, 550 nm and              1500 nm respectively.
where γ is the wavelength in m, h is the PLANCK con-                 9   Fig. 3. Photolysis rate of ozone, JO1D, (a) and ozone concentration (b) in the three
stant (6.63 × 10⁻³⁴ J s−1 ), c is the speed of light (2.998 ×       10
                                                                            Therefore,      the
                                                                         sensitivity experiments.
                                                                                                  spectral   dependence      of radiation due to the
108 m s−1 ), k is the Boltzmann constant (1.38×10⁻²³ J K−1 )             limb darkening of the sun may be important during a solar
                                                                    11
and Ts is the temperature of the sun’s surface (5740 K).                 eclipse. It is necessary to investigate how this limb darkening
                                                                    12
   Using 0γ (r) from Eq. (1) and the mathematical approach               affects surface ozone. A CBM-Z chemical box model (Zeveri
described in Koepke et al. (2001), the normalized irradiance             et al., 1999) is used to carry out three sensitivity experiments,
Inorm during an eclipse can be calculated as the ratio between           which are listed in Table 1.
the irradiance of the remaining part of the sun and the irradi-             It is known that 310 nm is important for the photochemical
ance of the uncovered solar disk.                                        processing of O3 and NO2 , and photolysis rates are directly25
   Figure 2a shows the decrease in Inorm with decreasing ob-             influenced by solar radiation at this wavelength. There-
scuration of the sun by the moon, X. The bold grey line rep-             fore, the photolysis rate can be scaled by the reduction of
resents the normalized intensity of a hypothetical sun with-             Inorm (310 nm) shown in Fig. 2a. It should be noted that
out limb darkening (noLD). Inorm (γ ) is wavelength depen-               Fig. 2a shows only half of an eclipse event, and that the same
dent because of limb darkening. These wavelengths are cho-               occurs as the moon leaves the sun gradually. Figure 3a shows
sen to cover the spectral range of interest: 310 nm is impor-            the photolysis rate of ozone (J O1 D, s−1 ) in three sensitivity
tant for the photochemical processes of O3 and NO2 , 550 nm              experiments during a solar eclipse event. The J O1 D value in
is a standard wavelength for visible light, and 1500 nm is               the Non-Eclipse experiment displays a steady increase in the
representative of the infrared. Compared to conditions with              morning, while in the Eclipse-LD and Eclipse-noLD experi-
no limb darkening, the normalized radiation for each wave-               ments there is a reduction during the eclipse period. The dif-
length, Inorm (γ ), is enhanced when the distance between the            ference in J O1 D between Eclipse-LD and Eclipse-noLD is
centers of the sun and moon is larger than 0.5 (|X| > 0.5).              the same scale as the difference in Inorm (γ ) between 310 nm
During the time when the limb of the sun is covered by                   and noLD (Fig. 2a).
the moon, the brighter central region of the sun still emits                In Kazantzidis (2007), a radiative transfer model was used
a lot of radiation. When the central parts of the sun are ob-            for computation of a correction for the total ozone measure-
scured by the moon (|X| < 0.5), Inorm (γ ) at each wavelength            ments due to the limb darkening. This correction was found
is lower than in noLD because the radiation in these regions             to be too small (less than 0.01 %) to explain the large de-
is blocked.                                                              crease in total ozone column. Here we confirm this finding
                                                                         by considering the ozone concentration from the box model
                                                                         (Fig. 3). The ozone concentration in the Non-Eclipse run

www.atmos-chem-phys.net/11/8075/2011/                                                            Atmos. Chem. Phys., 11, 8075–8085, 2011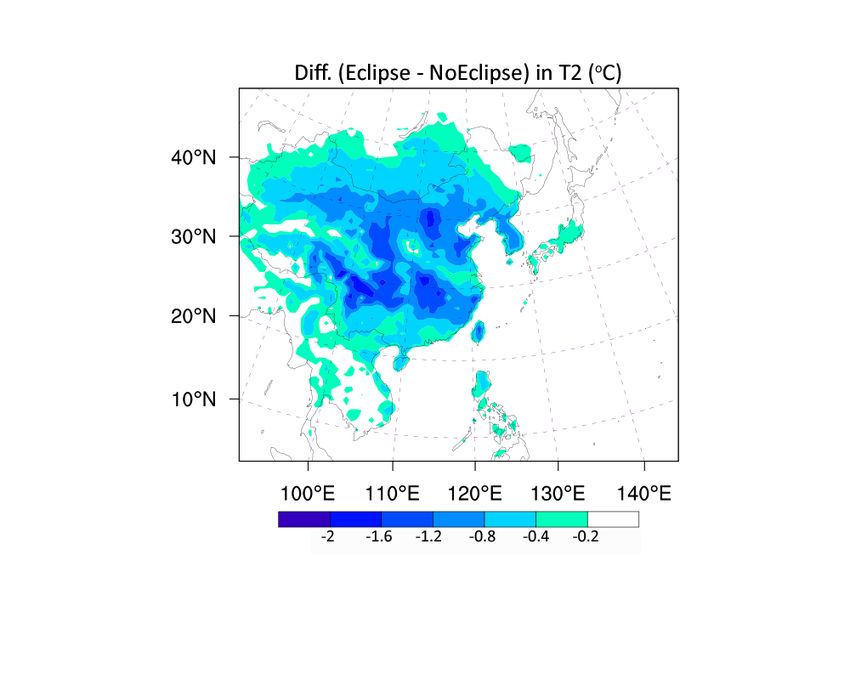
8078                                                                             J.-B. Wu et. al.: The effects of a solar eclipse on photo-oxidants

        Table 1. Sensitivity experiments performed with the box model.
 1

 2   Fig. 2. (a) Normalized radiation ascase
                                        a function of X, the description
                                                             distance between the centers of
 3   the sun and moon, during the eclipse for different wavelengths; (b) Effect of limb
                                        Non-Eclipse          Normal radiation according to solar zenith angle
 4   darkening as a function of X for different wavelengths (calculated using equation E3
                                        Eclipse-LD           Reduced radiation with limb darkening effect (black line in Fig. 2a)
 5   in the text).
                                       Eclipse-noLD        Reduced radiation without limb darkening effect (grey line in Fig. 2a)
 6

 7

                                                                                              al. (2005) and Fast et al. (2006), and more information can
                                                                                              be found at the website (http://ruc.noaa.gov/wrf/WG11/).
                                                                                                 The WRF-Chem model used in this study has a vertical
                                                                                              structure consisting of 27σ -levels extending from 1000 to
                                                                                              50 hPa, and a horizontal resolution of 81 km in the coarse
                                                                                              domain and 27 km in two nested domains (Fig. 1b). The fol-
                                                                                              lowing model parameterizations have been chosen to simu-
                                                                                              late atmospheric conditions:

                                                                                                – the Rapid Radiative Transfer Model, RRTM, (Mlawer,
 8                                                                                                1997) was used as the solver for long wave radiation and
 9   Fig.Fig.
          3. Photolysis rate ofrate
               3. Photolysis     ozone, JO1D, (a)
                                    of ozone,     1 D,ozone
                                              J Oand         concentration
                                                       (a) and             (b) in the three
                                                               ozone concentration                the Dudhia scheme (Dudhia, 1989) for the short wave.
10   sensitivity
         (b) in experiments.
                 the three sensitivity experiments.                                               In this study, the radiation modules were called every
11
                                                                                                  minute to account for the parameterization of the eclipse
12
                                                                                                  which was inserted into this module,
        shows a steady increase during the solar eclipse period, while
        Eclipse-LD and Eclipse-noLD results show a slight decrease.                             – the Mellor-Yamada-Janjic TKE scheme for turbulence
        It is worth noting that the Eclipse-LD and Eclipse-noLD re-                               in the PBL and in the free atmosphere (Janjic, 1994),
        sults are almost the same, with only a slightly greater de-
                                                                                                – the Lin microphysics scheme was used to simulate at-
        crease in the Eclipse-LD experiment. The effect of limb                          25
                                                                                                  mospheric microphysics,
        darkening on surface ozone is less than 0.5 %. Although the
        relative effect of limb darkening on shorter wavelengths is                             – the CBM-Z chemical mechanism (Zaveri et al., 1999)
        larger (Fig. 2b), the absolute difference in the reduction in                             and MOSAIC aerosol module (Zaveri et al., 2008) were
        solar radiation between short and long wavelength is small                                used to simulate the chemical conditions,
        (Fig. 2a). This small perturbation leads to little change in
        surface ozone between the Eclipse-LD and Eclipse-noLD ex-                               – the Fast-J photolysis scheme (Wild et al., 2000; Barnard
        periments. Therefore, we conclude that the effect of limb                                 et al., 2004) was used to calculate photolysis rates, and
        darkening on surface ozone is too small to explain the large                              the module was called every minute for consistency
        decrease in surface ozone during a solar eclipse event.                                   with the radiation schemes.

                                                                                              The Sparse Matrix Operator Kernel Emissions (SMOKE)
        3     Description and validation of the regional model                                model is applied to process the emissions and to provide grid-
                                                                                              ded emission data for the WRF-Chem model. Two emission
        3.1    Method                                                                         inventories are considered in this study: regional emissions
                                                                                              at 10 km resolution from the TRACE-P emission inventory
        Numerical simulations were carried out using the WRF-                                 (Streets et al., 2003) updated according to personal commu-
        Chem model, version 3.1.1. The WRF-Chem model is a                                    nications, and power plant emission data from INTEX-B at
        newly developed regional chemical transport model coupled                             a horizontal resolution of 0.5◦ ×0.5◦ (Zhang et al., 2009). To
        online with the Weather Research and Forecasting (WRF)                                obtain a better distribution of emissions, area emissions over
        model. The WRF model is a fully compressible, non-                                    East Asia have been spatially allocated based on related spa-
        hydrostatic model and a detailed description can be found                             tial factors such as population data from the Land Scan 2005
        on the WRF model website at http://www.wrf-model.org.                                 Global Population Database. The road dust emission is spa-
        The chemistry model is fully coupled with the WRF model,                              tially distributed according to road length.
        with the same vertical and horizontal coordinates, time step,                            There are two major obstacles in reproducing the solar
        transport scheme, and physical parameterization schemes.                              eclipse phenomenon and its effects on the atmosphere using
        A detailed description of WRF-Chem is given by Grell et                               a numerical model:

        Atmos. Chem. Phys., 11, 8075–8085, 2011                                                                 www.atmos-chem-phys.net/11/8075/2011/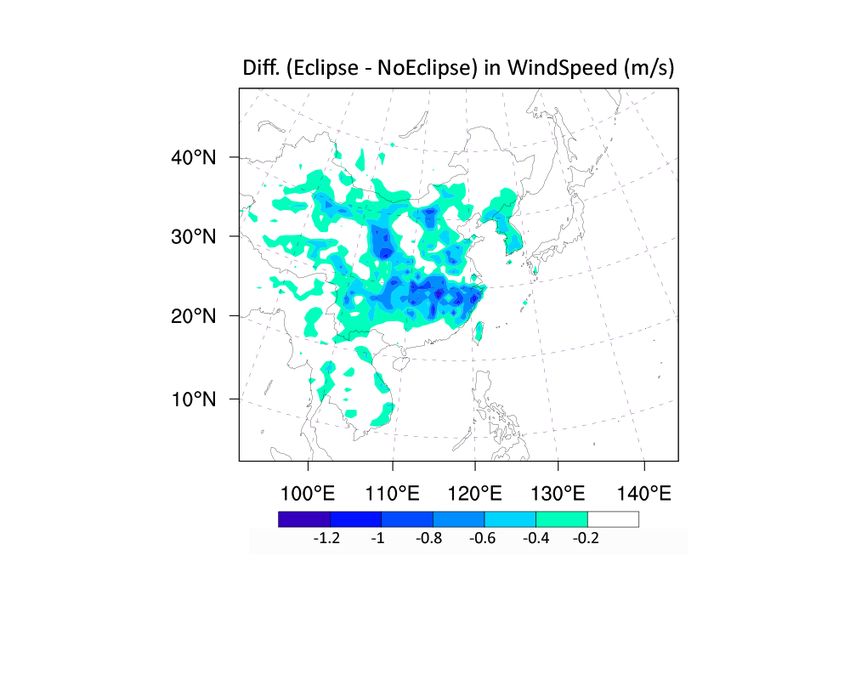
J.-B. Wu et. al.: The effects of a solar eclipse on photo-oxidants                                                                           8079

 1. Inserting the eclipse path (including total and partial
    eclipse) into the model, and following its progression                                              (a)                                     (b)
    across the Earth during the day.
 2. Calculating the percentage obscuration during the
    eclipse corresponding to the latitude and longitude of
    each grid point in the simulation domain every time-
    step.                                              1

                                                                  Fig. 4. Downward solar radiation flux (w/m2) during the day
Reproduction of the solar eclipse in the WRF-Chem model     2
                                                                       Fig. 4. Downward solar radiation flux (w m−2of) the         eclipse at (a) Hedo
                                                                                                                                during  the day of
was solved by varying the solar radiation and photolysis    3     (26.87N, 128.25E) and (b) Fukue (32.75N, 128.68E) which are shown as yellow
                                                            4
                                                                       the  eclipse
                                                                  points in Fig. 1a.
                                                                                     at (a) Hedo (26.87   N, 128.25   E) and  (b) Fukue  (32.75 N,
rates using a scaling factor. This scaling factor was deter-5         128.68 E) which are shown as yellow points in Fig. 1a.
mined by the solar coverage expressed as a function of lat-
itude, longitude, time and wavelength. For example, the
obscuration of the sun at each grid point is proportional             3.2.1     Downward solar radiation
to the distance from the center of the total eclipse at a
given time. The distance of each grid point to the cen-               The immediate effect of the solar eclipse is on solar radia-
ter of the total eclipse was calculated with a unified for-           tion. The variation in the downward solar radiation is ap-
mula referred to the path of the umbral shadow observed               proximately proportional to the obscuration of the sun. The
by NASA (http://eclipse.gsfc.nasa.gov/SEmono/TSE2009/                 temporal variation of the downward solar radiation (Fig. 4)
TSE2009tab/TSE2009-Table03.pdf). Since the moon’s um-                 shows a sharp decrease at Hedo and Fukue both in the ob-
bral shadow moved with a known velocity across the Earth,             servations and the Eclipse run, while in the NoEclipse run no
the obscuration at each grid point is rescaled at each time           reduction in radiation is seen. Clearly the Eclipse run is capa-
step. In addition, the limb darkening effect is introduced in         ble of reproducing the downward solar radiation well when
this scaling factor so that shorter wavelength radiation is re-       compared to measured data.
duced slightly more at a given obscuration (see Sect. 2). The
                                                                      3.2.2     Temperature at 2-m
variable Jecl during the eclipse is then calculated from the
original Jorig multiplied by the scaling factor:                      The time series of observed and simulated 2-m tempera-
Jecl = Jorig · factor (lat,lon,time,wavelength)            (4)        ture at different sites during the eclipse are shown in Fig. 5.
                                                                      Chongqing and Wuhan (Fig. 5c, d) lie in the path of the
This method was applied in the radiation and photoly-                 total solar eclipse, while other sites experienced a partial
sis scheme every minute during the eclipse period (08:55–             eclipse, with Beijing and Shenyang (Fig. 5a, b) lying approx-
12:15 BJT) to simulate the passage of the solar eclipse.              imately 10 degrees to the north and Guangzhou and Shen-
   In order to investigate the effects of the solar eclipse on        zhen (Fig. 5e, f) lying 7 degrees to the south. The percentages
meteorological and chemical parameters, the WRF-Chem                  in the figure represent the maximum solar coverage during
modeling system was run twice, once with the moving umbra             the eclipse period. The double arrows denote the maximum
of the Moon (Eclipse), and once without it (NoEclipse).               difference in temperature between the Eclipse and NoEclipse
                                                                                                                                          26
                                                                      runs. The temperature drop followed a similar, clear pattern
3.2   Validation experiment
                                                                      in both the observations and the Eclipse run at all stations,
Observation sites are shown in Fig. 1a, with yellow points            as shown in Fig. 5, while in the NoEclipse run the temper-
representing sites with downward solar radiation data, blue           ature generally increased without any drop. As well as the
points representing sites with 2-m temperature, and red               amplitude of the temperature drop, the timing of the simu-
points representing sites with atmospheric pollutant mea-             lated response is also consistent with the observations. The
surements. The downward solar radiation data is obtained              time of the minimum temperature occurrence at these sites
from SKYNET (http://atmos.cr.chiba-u.ac.jp/). The surface             is very close to the full phase of the solar eclipse. In addi-
air temperature data is collected from observations at airports       tion, the amplitudes of the temperature changes are differ-
with 1 min time resolution. Atmospheric pollutant data for            ent at each location. The maximum difference in tempera-
O3 and NO2 is obtained from local measurements in Hefei               ture between the Eclipse and NoEclipse run is 2.13 ◦ C and
and Tongcheng with 5 min time resolution. From the satellite          2.04 ◦ C in Chongqing and Wuhan respectively (under the to-
image (Fig. 1a), it can be seen that the sites at Wuhan (WH),         tal eclipse), larger than that at stations with the partial eclipse.
Tongcheng (TC), Hefei (HF), Hedo and Fukue are influenced             This is largely related to the different percentage of obscura-
by light cloud cover. However, there is no rain during the so-        tion. Generally, the results of the Eclipse run agree quite well
lar eclipse period according to the local observations. There-        with measured data during the eclipse.
fore the observation data is appropriate for comparison with
WRF-Chem simulations.

www.atmos-chem-phys.net/11/8075/2011/                                                       Atmos. Chem. Phys., 11, 8075–8085, 2011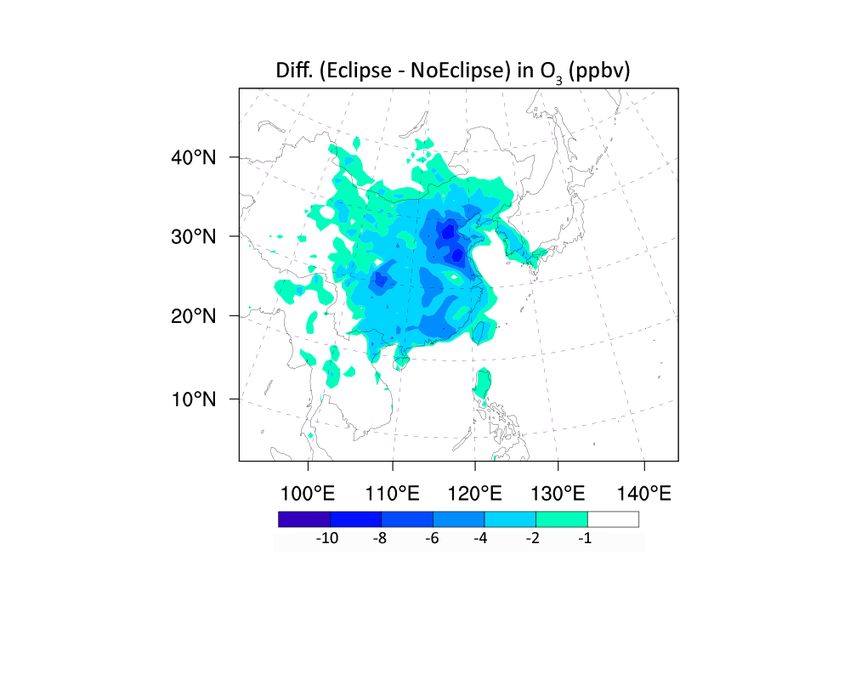
8080                                                                  J.-B. Wu et. al.: The effects of a solar eclipse on photo-oxidants

               (a)                               (b)

                                                                          1

               (c)                               (d)

                                                                          2

                                                                          3   Fig. 6. Temporal variation in O3 and NO2 during the eclipse in Hefei (a, c) and
                                                                                    Fig. 6. Temporal variation in O3 and NO2 during the eclipse in
               (e)                                                        4   Tongcheng (b, d). The locations of these two sites are shown as red points in Fig. 1a:
                                                 (f)                                Hefei (a, c) and Tongcheng (b, d). The locations of these two sites
                                                                          5   Hefei (HF, 31.51N, 117.16E) and Tongcheng (TC, 31.04N, 116.94E). The vertical
                                                                          6
                                                                                    are shown as red points in Fig. 1a: Hefei (HF, 31.51 N, 117.16 E)
                                                                              dashed lines denote the maximum in the eclipse at each station.
                                                                          7         and Tongcheng (TC, 31.04 N, 116.94 E). The vertical dashed lines
                                                                                    denote the maximum in the eclipse at each station.

                                                                                            This bias may be related to the coarse resolution of the
                                                                                            model, which may underestimate emissions at polluted sites.
                                                                                            At the relatively unpolluted site of Tongcheng (Fig. 6b, d),
Fig. 5. Temporal variation of 2-m temperature during the eclipse at the airports at (a)
           Fig. 5. Temporal variation of 2-m temperature during the eclipse at              the Eclipse run matched very well with observations both in
Beijing, (b) Shenyang, (c) Chongqing, (d) Wuhan, (e) Guangzhou, and (f) Shenzhen.
           the airports at (a) Beijing, (b) Shenyang, (c) Chongqing, (d) Wuhan,             magnitude and pattern. In general, the Eclipse experiment
The double (e) arrows   denote
                Guangzhou,    andthe
                                   (f) maximum
                                       Shenzhen. difference
                                                   The doubleinarrowstemperature     between the
                                                                            denote the      showed a very similar pattern in surface O3 and NO2 to that
Eclipse and   NoEclipse
           maximum          runs. The
                       difference       percentagebetween
                                   in temperature    in eachthetitle  represents
                                                                   Eclipse         the maximum
                                                                             and NoE-       observed, while the NoEclipse run showed steady increases
solar coverage
           clipseduring   the eclipse
                   runs. The           period.
                               percentage       The title
                                            in each  locations   of each
                                                          represents    the airport
                                                                            maximum are shown as
                                                                                            or decreases typical of normal conditions. The Eclipse run
blue points    in coverage
           solar   Fig. 1a: during
                              Beijingthe(BJ,  40.08N,
                                          eclipse       116.61E),
                                                  period.              Shenyang
                                                            The locations           (SY, 41.64N,
                                                                               of each
                                                                                            generally reproduces the main features of atmospheric pollu-
123.48E), airport
            Chongqing      (CQ,as29.72N,
                    are shown                106,64E),
                                   blue points            Wuhan
                                                in Fig. 1a:  Beijing (WH,(BJ, 30.37N,
                                                                              40.08 N, 114.20E),
                                                                                            tants observed during the solar eclipse.
Guangzhou    (GZ, E),
           116.61   23.39N,   113.31E),
                        Shenyang     (SY,Shenzhen
                                           41.64 N, (SZ,  22.64N,
                                                      123.48          113.80E). (CQ,
                                                             E), Chongqing
           29.72 N, 106,64 E), Wuhan (WH, 30.37 N, 114.20 E), Guangzhou                        In conclusion, based on the comparison between model
           (GZ, 23.39 N, 113.31 E), Shenzhen (SZ, 22.64 N, 113.80 E).                       simulations   and measurements above, the Eclipse experi-
                                                                                            ment captures the main characteristics of the solar eclipse
                                                                                            and its effects on atmospheric composition.
          3.2.3      NO2 and O3                                                                                                                                   28

                                                                                    4     Results of experiments
          The performance of the Eclipse experiment for atmospheric
          pollutants is demonstrated for surface O3 and NO2 at Hefei                4.1    Total effects of the solar eclipse
          and Tongcheng, which are located in the path of the total
          eclipse and are characterized by different air pollution lev-             The27effects of the solar eclipse over China as calculated with
          els. During the eclipse hours, observations of surface ozone              WRF-Chem are depicted in Fig. 7 which shows the differ-
          displayed a decrease of around 20 ppbv in Hefei, while at                 ence in 2-m temperature, surface wind speed, NO2 , CO, O3 ,
          the relatively unpolluted site of Tongcheng the decrease was              and NO between Eclipse and NoEclipse conditions for the
          much smaller. The measured NO2 showed an increase of                      lowest model level averaged over the time period 09:00–
          up to 10 and 3 ppbv in Hefei and Tongcheng respectively.                  10:00 BJT.
          At the polluted site (Hefei) the Eclipse experiment showed a                 The simulated temperature response (Fig. 7a) is dis-
          decrease in ozone similar to that observed but lower in mag-              tinct over mainland China with more pronounced anoma-
          nitude, with a maximum decrease of approximately 10 ppbv                  lies (about −1.5 ◦ C) over the totality areas in central China,
          (Fig. 6a). The maximum increase of NO2 at this site was                   while the effect of the eclipse is minimized by the sea due
          about 5 ppbv, half of the change in observed NO2 (Fig. 6c).               to its greater heat capacity. In addition, there is a zone with

          Atmos. Chem. Phys., 11, 8075–8085, 2011                                                        www.atmos-chem-phys.net/11/8075/2011/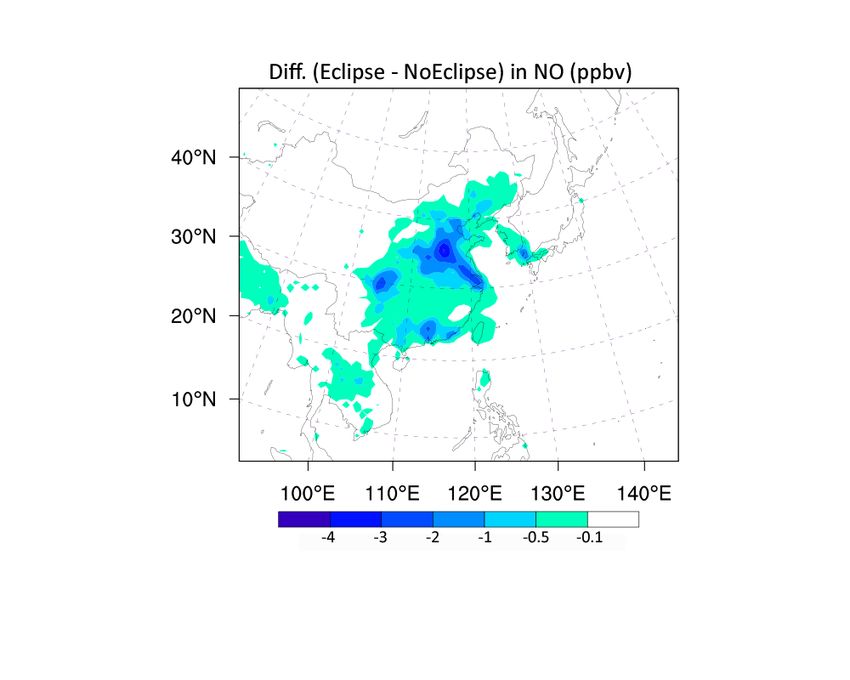
J.-B. Wu et. al.: The effects of a solar eclipse on photo-oxidants                                                                                    8081
1

                                                                                                   In contrast to the meteorological variables, the impacts of
                                                                                                the solar eclipse on atmospheric pollutants (Fig. 7c–f) are
                                                                                                greatest over parts of north and east China where the max-
                                                                                                imum emissions occur. We find an increase of 5 ppbv in
                                                                                                NO2 and 25 ppbv in CO, and a decrease of 10 ppbv in O3 and
                                                                                                4 ppbv in NO. Solar radiation changes during an eclipse may
                                                                                                affect tropospheric photo-oxidants in several ways on differ-
                                           (a)                                        (b)       ent timescales. A perturbation to the photo-stationary steady
                                                                                                state of O3 , NO and NO2 is induced immediately during a
2                                                                                               solar eclipse through Reactions (R1–R3):

                                                                                                NO2 + hv(λ < 424 nm) → O(3 P) + NO                          (R1)

                                                                                                O(3 P) + O2 + M → O3 + M                                    (R2)

                                                                                                NO + O3 → NO2 + O2                                          (R3)

                                                                                                As a direct consequence the primary pollutant NO destroys
                                           (c)                                        (d)
                                                                                                O3 through the titration Reaction (R3) without O3 being re-
                                                                                                formed through NO2 photolysis Reaction (R1). Therefore,
3
                                                                                                the photo-stationary steady state of O3 , NO and NO2 is very
                                                                                                susceptible to solar radiation changes during an eclipse, as
                                                                                                shown clearly in Fig. 7c–e. The increase of CO may be re-
                                                                                                lated to dynamical processes, as discussed below.
                                                                                                   During the eclipse period, it can be concluded that the
                                                                                                eclipse has clear impacts on atmospheric pollutants over
                                                                                                high-emission areas and on meteorological variables around
                                           (e)                                        (f)
                                                                                                the areas of totality.

                                                                                                4.2   Effects in different areas
4

5    Fig. 7. Differences in (a) temperature, (b) wind speed, (c) NO2, (d) CO, (e) O3, and (f)   The results discussed in the previous sections indicate that
6   Fig.
     NO 7.    Differences
          between Eclipse and in (a)   temperature,
                                 NoEclipse     conditions(b)
                                                           in wind  speed, (c)simulations
                                                              the WRF-Chem       NO2 ,
     averaged
                                                                                                the effects of the solar eclipse are significant. In particu-
7   (d) CO, over  the
              (e) O 3 ,time
                         andperiod
                             (f) NOof the eclipse, 09:00-10:00
                                        between     Eclipse andBJT NoEclipse
                                                                   (Beijing Time).
                                                                                condi-
    tions in the WRF-Chem simulations averaged over the time period                             lar, since the results of the Eclipse and NoEclipse experi-
    of the eclipse, 09:00–10:00 BJT (Beijing Time).                                    29       ments suggest that the eclipse can have a greater impact on
                                                                                                atmospheric pollutants in areas with higher emissions even
                                                                                                though solar obscuration is less, there is strong motivation
    reduced temperature differences between north and central                                   to investigate the effects of the eclipse in different areas fur-
    China resulting from cloud coverage, which greatly reduces                                  ther. For this purpose, we focus on surface photo-oxidants in
    the impact of the eclipse. The location of this zone is consis-                             two areas with different emission levels (Fig. 1b). The area
    tent with cloud cover in the satellite image (Fig. 1a), which                               in north China, referred to here as the “polluted area”, has a
    suggests that the simulation of the eclipse is reasonable. It                               higher emission level than the area in central China (termed
    can be concluded that the magnitude of the surface air tem-                                 the “clean area”). Furthermore, the maximum solar obscura-
    perature is not just dependent on solar obscuration induced                                 tion is different in these two areas, averaging 74.1 % in the
    by the eclipse but on a combination of several factors includ-                              polluted area and 96.8 % in the clean area. These two ar-
    ing solar obscuration, vegetation and local cloudiness.                                     eas are little affected by cloud (shown in the satellite image,
       The simulated wind speed response (Fig. 7b) shows a sim-                                 Fig. 1a) which could greatly reduce the effect of the eclipse.
    ilar pattern to temperature, with a decrease of approximately                               Based on the distinct characteristics in these two areas, we
    1 m s−1 over the area of totality. It is worth noting that the                              can gain a clear understanding of the effects of the eclipse.
    reduction in wind speed is larger when the air temperature                                     The average differences in O3 , NO2 and NO between
    over an area decreases by more than 1 ◦ C. This may result                                  Eclipse and NoEclipse conditions in the WRF-Chem simu-
    from the combined effect of a decrease in the thermal gradi-                                lations over the time period of the eclipse (08:00–13:00 BJT)
    ent and the stabilization of the surface layer induced by the                               are given in Table 2. In the polluted area, the WRF-Chem
    temperature drop.                                                                           simulations show an ozone decrease of 5.4 ppbv, almost
                                                                                                twice that in the clean area. Similarly the WRF-Chem sim-
                                                                                                ulations indicate small changes in NO and NO2 in the clean

    www.atmos-chem-phys.net/11/8075/2011/                                                                         Atmos. Chem. Phys., 11, 8075–8085, 2011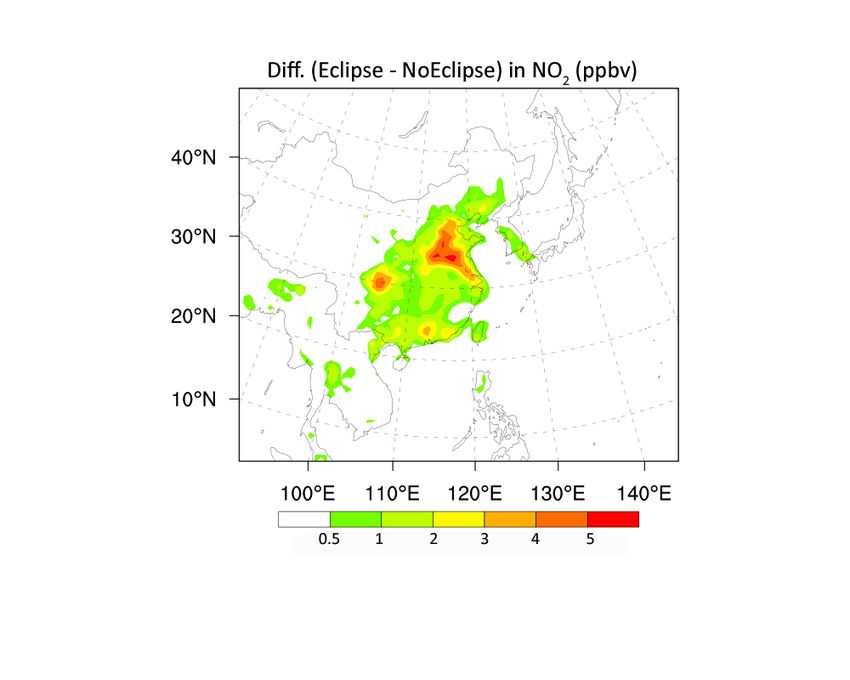
8082                                                                      J.-B. Wu et. al.: The effects of a solar eclipse on photo-oxidants

    Table 2. Average differences in O3 , NO2 and NO between Eclipse and NoEclipse conditions in WRF-Chem simulations over the time period
    of the eclipse 08:00–13:00 Beijing Time (BJT). The values in parentheses correspond to the differences at maximum solar coverage.

                                                      1O3 (ppbv)       1NO2 (ppbv)         1NO (ppbv)       1CO (ppbv)
                                    Polluted area     −5.4 (−7.6)            1.6 (3.4)     −0.3 (−1.6)        10.6 (13.1)
                                    Clean area        −2.7 (−4.5)            0.7 (1.7)    −0.01 (−0.8)          2.5 (3.6)

1
                                                                                    The altitude-time cross sections of the effects of the eclipse
         (a)                                (b)                                   on O3 , NO2 , and NO in the polluted and clean areas are
                                                                                  shown in Fig. 8. These show that:
                                                                                     – In the polluted area, the maximum responses of O3 ,
                                                                                       NO2 and NO induced by solar eclipse are of the order of
                                                                                       10 ppbv, 3 ppbv and −1.5 ppbv respectively, while the
                                                                                       corresponding values in the clean area are much smaller.
2                                                                                      Although the maximum solar obscuration is smaller in
         (c)
                                                                                       the polluted area than in clean area, the impacts of the
                                            (d)
                                                                                       eclipse in the polluted area are greater in magnitude, and
                                                                                       last longer than those in the clean area.
                                                                                     – There is an increase in NO after the initial sharp de-
                                                                                       crease at the beginning of eclipse. NO2 is accumulated
                                                                                       during the eclipse (see Fig. 8b), and photolysis of the
                                                                                       accumulated NO2 once the solar radiation starts to re-
3
                                                                                       cover generates extra NO, resulting in a sharp increase
         (e)                                (f)                                        in NO that starts during the partial eclipse period once
                                                                                       solar radiation reappears.
                                                                                     – The effect of the eclipse on atmospheric pollutants
                                                                                       is mainly within the planetary boundary layer (below
                                                                                       1500 m) as this is where the highest levels of atmo-
                                                                                       spheric pollutants occur.
4
                                                                                  It is interesting to find that there is reduced CO directly above
5    Fig. 8. Altitude-time cross sections of the differences between model simulations
                                                                                              the enhanced layer of surface CO (Fig. 9), with almost the
6   Fig.  8. –Altitude-time
     (Eclipse     NoEclipse) for cross     sections
                                     (a,b) O          of2,the
                                            3, (c,d) NO    anddifferences     between
                                                               (e,f) NO, averaged     over the
7    pollutedsimulations
    model      (left side) and    clean (right side) areas.
                             (Eclipse–NoEclipse)            Dashed
                                                       for (a, b) Olines
                                                                     3 , (c,show  the 2time
                                                                              d) NO    ,    ofsame magnitude of CO concentrations in these two regions.
8    maximum     solar eclipse in Beijing.
    and (e, f) NO, averaged over the polluted (left side) and clean (right                    This can be attributed to the change in boundary layer height
9                                                                                 between the Eclipse and NoEclipse simulations (Fig. 9). The
    side) areas. Dashed lines show the time of maximum solar eclipse
    in Beijing.                                                                   boundary layer height is suppressed during the eclipse pe-
                                                                                  riod so that the emissions are not mixed up as high. Thus
                                                                                  the concentration of CO within the mixing boundary layer is
    area during the solar eclipse. In particular, an increase in                  higher and free tropospheric concentrations lower. Although
    NO2 of 3.4 ppbv and decrease in NO of 1.6 ppbv are calcu-                     the change in CO in the clean area shows a very similar pat-
    lated at the time of maximum solar coverage in the polluted                   tern to the polluted area, the magnitude of the CO concen-
    area. The net effect on O3 , NO2 and NO can be attributed                   30tration anomaly is much smaller in the clean area because of

    to perturbation of the photostationary state of O3 , NO2 and                  the lower emission rate.
    NO during the eclipse, with NO2 generated from the titration                     The WRF-Chem model simulates a sharp change from
    reaction of O3 with NO which is not then efficiently photol-                  daytime to nighttime chemistry as depicted in Fig. 10. Dur-
    ysed. During the solar eclipse over China, the response of                    ing the eclipse period, hydroxyl (OH) and hydroperoxy
    O3 , NO2 and NO in the polluted area is much larger than that                 (HO2 ) radicals, mainly produced through photochemistry,
    in the clean area. In addition, we find an increase in CO of                  show a rapid decrease of more than an order of magnitude
    10.6 ppbv in the polluted area but only a small change in the                 to reach nighttime levels. Simultaneously the model simula-
    clean area.                                                                   tions show that the nitrate (NO3 ) radical – mainly presents
                                                                                  during the night – increases during the eclipse hours.

    Atmos. Chem. Phys., 11, 8075–8085, 2011                                                            www.atmos-chem-phys.net/11/8075/2011/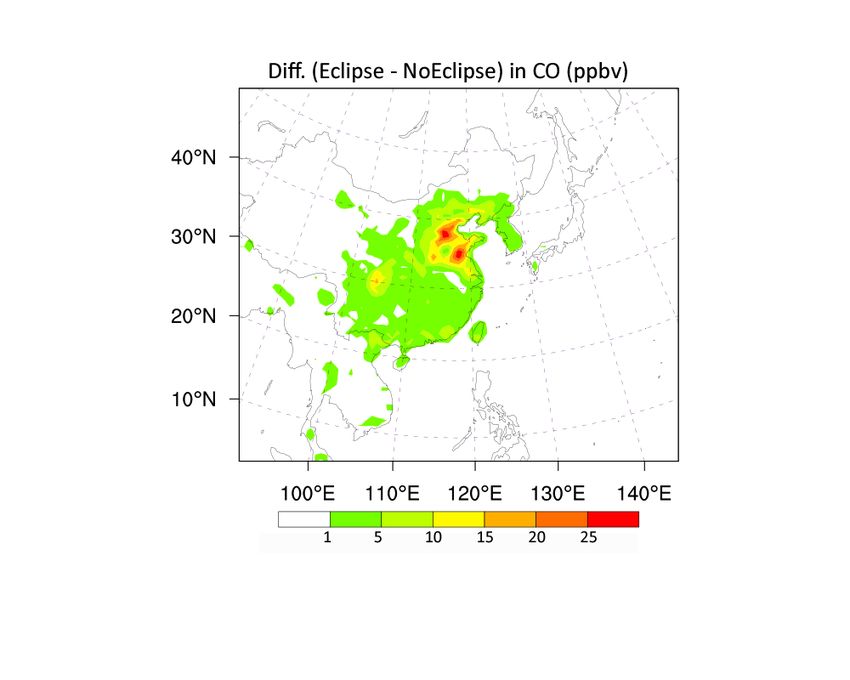
J.-B. Wu et. al.: The effects of a solar eclipse on photo-oxidants                                                                                                   8083
      1

                                                                                                            Table 3. Domain-average impacts (as a percentage, %) of the so-
                                                                                                            lar eclipse on photo-oxidants in polluted and clean areas in dif-
                                                                                                            ferent phases (according to solar obscuration for each domain:
                                                                                                            >50 % coverage, 50 %                  50 %, 50 %), and the
           VOCs + OH and HCHO + hv reactions accounted for most of                     impact in the clean area can be up to 60 % which is largely
           the HO2 production. During the solar eclipse when nighttime                 because of the limited source of radicals in this area. As the
           chemistry dominates, these reactions are sharply reduced, re-               solar radiation recovers, the concentration of radicals in the
           sulting in loss of HO2 . The change in the clean area is more               clean area returns to normal rapidly. Therefore, it can be con-
           pronounced because CO and NO concentrations are lower                       cluded that the effects of the eclipse at its peak are significant
           than in the polluted area, and this leads to less production of             in both areas, but that they last longer in polluted areas.
           HO2 . Although the change in radical concentrations in the
           clean area is larger during the eclipse period, the difference
           becomes negligible soon after the eclipse. In the polluted
                                                                                                           32

          www.atmos-chem-phys.net/11/8075/2011/                                                                                  Atmos. Chem. Phys., 11, 8075–8085, 2011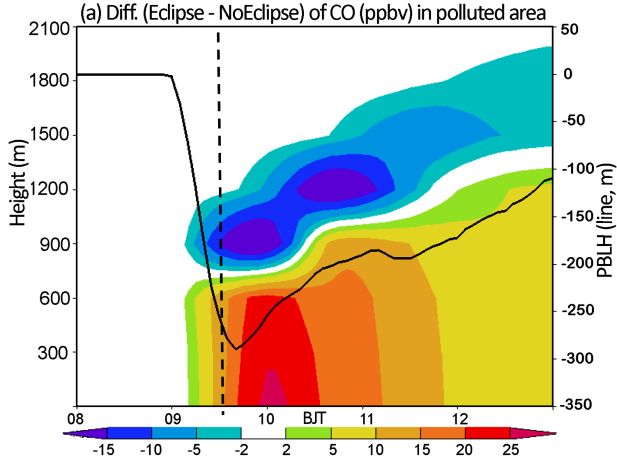
8084                                                              J.-B. Wu et. al.: The effects of a solar eclipse on photo-oxidants

5   Summary and discussion                                           these measurements is quite straight-forward given that these
                                                                     are highly predictable events. In particular, high time reso-
This study investigates the effects on surface ozone and other       lution measurements of the following atmospheric variables
photo-oxidants of the total solar eclipse of 22 July 2009, fo-       are recommended here: (i) ozone (O3 ), nitrogen oxides (NO
cusing on different regions in China. In order to investigate        and NO2 ), (ii) photolysis rates that can be observed, (iii) hy-
the sensitivity of ozone to limb darkening during an eclipse         droxyl (OH), hydroperoxy (HO2 ) and nitrate (NO3 ) radi-
event, three experiments addressing eclipse conditions with          cals that show dramatic changes from daytime to nighttime
limb darkening, eclipse conditions without limb darkening            chemistry, (iv) VOCs that are sensitive to solar radiation,
and non-eclipse conditions were carried out in a box model.          and (v) photolysis-related atmospheric constituents that have
The results reveal that the effect of limb darkening on surface      poorly-known sources, such as HONO.
ozone is too small (less than 0.5 %) to explain the large de-
crease in surface ozone during a solar eclipse event. Further-       Acknowledgements. We are grateful to Oliver Wild (Lancaster
more, a regional model, WRF-Chem, was applied to study               University, UK) for useful discussions. This work is funded by
the effects of the eclipse on meteorological and chemical pa-        the Special Fund for Environmental Protection Research in the
rameters. The model was run twice, once with the moving              Public Interest (201009002), the Chinese Academy of Science
umbra of the Moon, and once without it. The WRF-Chem                 (KZCX2-YW-205) and the NSFC grant (40775077 and 40805051).
model captures the basic features of the total eclipse well.
                                                                     Edited by: S. C. Liu
   The solar eclipse has maximum impact in the region of to-
tality, with a decrease in surface temperature of 1.5 ◦ C and
decrease in wind speed of 1 m s−1 . In contrast to the mete-         References
orological variables, the maximum impacts on atmospheric
pollutants occur over areas of north and east China where            Abram, J. P., Creasey, D. J., Heard, D. E., Lee, J. D., and Pilling, M.
emissions are greater, where there is an increase of 5 ppbv in         J.: Hydroxyl radical and ozone measurements in England during
NO2 and 25 ppbv in CO and a decrease of 10 ppbv in O3 and              the solar eclipse of 11 August 1999, Geophys. Res. Lett., 27,
4 ppbv in NO.                                                          3437–3440, 2000.
   Furthermore, this study shows the effects of the solar            Amiridis, V., Melas, D., Balis, D. S., Papayannis, A., Founda, D.,
                                                                       Katragkou, E., Giannakaki, E., Mamouri, R. E., Gerasopoulos,
eclipse on surface photo-oxidants in different parts of China.
                                                                       E., and Zerefos, C.: Aerosol Lidar observations and model calcu-
Although the sun was obscured to a smaller extent in pol-
                                                                       lations of the Planetary Boundary Layer evolution over Greece,
luted areas than in clean areas, the impacts of the eclipse in         during the March 2006 Total Solar Eclipse, Atmos. Chem. Phys.,
polluted areas was larger and lasted longer than in clean ar-          7, 6181–6189, doi:10.5194/acp-7-6181-2007, 2007.
eas. It is worth noting that there is an increase in NO follow-      Anderson, J.: Meteorological changes during a solar eclipse,
ing the sharp decrease which occurs during the maximum in              Weather, 54(7), 207–215, 1999.
the eclipse, and this may be related to NO2 photolysis, which        Barnard, J. C., Chapman, E. G., Fast, J. D., Schmelzer, J. R.,
leads to accumulation of NO as the solar radiation recovers.           Slusser, J. R., and Shetter, R. E.: An evaluation of the FAST-J
The results also show that changes in surface CO are mainly            photolysis algorithm for predicting nitrogen dioxide photolysis
due to dynamical processes. The change in radical concen-              rates under clear and cloudy sky conditions, Atmos. Environ.,
trations during the eclipse reveals that nighttime chemistry           38, 3393–3403, doi:10.1016/j.atmosenv.2004.03.034, 2004.
                                                                     Dudhia, J.: Numerical Study of Convection Observed during
dominates in both polluted and clean areas. However, in con-
                                                                       the Winter Monsoon Experiment Using a Mesoscale Two-
trast to the change in atmospheric pollutants, the change in
                                                                       Dimensional Model, J. Atmos. Sci., 46, 3077–3107, 1989.
radical concentrations (OH, HO2 and NO3 ) in clean areas is          Emde, C. and Mayer, B.: Simulation of solar radiation during a total
much greater than that in polluted areas mainly because of             eclipse: a challenge for radiative transfer, Atmos. Chem. Phys.,
the limited source of radicals in these areas.                         7, 2259–2270, doi:10.5194/acp-7-2259-2007, 2007.
   It is unfortunate that a comprehensive experimental cam-          Fabian, P., Rappengluck, B., Stohl, A., Werner, H., Winterhal-
paign was not organized during the total solar eclipse of              ter, M., Schlager, H., Stock, P., Berresheim, H., Kaminski, U.,
22 July 2009. It is clear that measurement of atmospheric              Koepke, P., Reuder, J., and Birmili, W.: Boundary layer photo-
pollutants from only two sites, as used in this study, is not          chemistry during a total solar eclipse, Meteorol. Z., 10, 187–192,
enough. Therefore, we conduct a numerical study using an               2001.
online model WRF-Chem to investigate the impact of the to-           Fast, J. D., Gustafson, W. I., Easter, R. C., Zaveri, R. A.,
                                                                       Barnard, J. C., Chapman, E. G., Grell, G. A., and Peckham,
tal eclipse, and reproduce the basic features of this eclipse.
                                                                       S. E.: Evolution of ozone, particulates, and aerosol direct ra-
However, more observations of atmospheric pollutants are               diative forcing in the vicinity of Houston using a fully coupled
required to validate the numerical model. The solar eclipse            meteorology-chemistry-aerosol model, J. Geophys. Res., 111,
provides a natural perturbation to atmospheric chemistry that          D21305, doi:10.1029/2005jd006721, 2006.
allows us to test our understanding more thoroughly. Thus            Fernandez, W., Castro, V., and Hidalgo, H.: Air-Temperature and
it is highly desirable to hold a comprehensive experimen-              Wind Changes in Costa-Rica during the Total Solar Eclipse of
tal campaign during future solar eclipses. Preparation for             July 11, 1991, Earth Moon Planets, 63, 133–147, 1993.

Atmos. Chem. Phys., 11, 8075–8085, 2011                                                  www.atmos-chem-phys.net/11/8075/2011/
J.-B. Wu et. al.: The effects of a solar eclipse on photo-oxidants 8085 Fernandez, W., Hidalgo, H., Coronel, G., and Morales, E.: Changes Streets, D. G., Bond, T. C., Carmichael, G. R., Fernandes, S. D., in meteorological variables in Coronel Oviedo, Paraguay, during Fu, Q., He, D., Klimont, Z., Nelson, S. M., Tsai, N. Y., Wang, the total solar eclipse of 3 November 1994, Earth Moon Planets, M. Q., Woo, J. H., and Yarber, K. F.: An inventory of gaseous and 74, 49–59, 1996. primary aerosol emissions in Asia in the year 2000, J. Geophys. Founda, D., Melas, D., Lykoudis, S., Lisaridis, I., Gerasopoulos, E., Res., 108, 8809, doi:10.1029/2002jd003093, 2003. Kouvarakis, G., Petrakis, M., and Zerefos, C.: The effect of the Tzanis, C.: Ground-based observations of ozone at Athens, Greece total solar eclipse of 29 March 2006 on meteorological variables during the solar eclipse of 1999, Int. J. Remote. Sens., 26, 3585– in Greece, Atmos. Chem. Phys., 7, 5543–5553, doi:10.5194/acp- 3596, doi:10.1080/01431160500076947, 2005. 7-5543-2007, 2007. Tzanis, C., Varotsos, C., and Viras, L.: Impacts of the solar Gerasopoulos, E., Zerefos, C. S., Tsagouri, I., Founda, D., Amiridis, eclipse of 29 March 2006 on the surface ozone concentra- V., Bais, A. F., Belehaki, A., Christou, N., Economou, G., tion, the solar ultraviolet radiation and the meteorological pa- Kanakidou, M., Karamanos, A., Petrakis, M., and Zanis, P.: rameters at Athens, Greece, Atmos. Chem. Phys., 8, 425–430, The total solar eclipse of March 2006: overview, Atmos. Chem. doi:10.5194/acp-8-425-2008, 2008. Phys., 8, 5205–5220, doi:10.5194/acp-8-5205-2008, 2008. Varotsos, C.: Solar Ultraviolet-Radiation and Total Ozone, as De- Gogosheva, T. N., Petkov, B. K., and Krystev, D. G.: Measure- rived from Satellite and Ground-Based Instrumentation, Geo- ment of ultraviolet radiation and ozone during the solar eclipse phys. Res. Lett., 21, 1787–1790, 1994. of 11 August 1999, Geomagn. Aeronomy, 42, 262–266, 2002. Varotsos, C.: Airborne measurements of aerosol, ozone, and solar Grell, G. A., Peckham, S. E., Schmitz, R., McKeen, S. A., Frost, G., ultraviolet irradiance in the troposphere, J. Geophys. Res., 110, Skamarock, W. C., and Eder, B.: Fully coupled “online” chem- D09202, doi:10.1029/2004jd005397, 2005. istry within the WRF model, Atmos. Environ., 39, 6957–6975, Waldmeier, M.: Ergebnisse und Probleme der Sonnenforschung, doi:10.1016/j.atmosenv.2005.04.027, 2005. Probleme der kosmischen Physik, 264 pp., Akad Verlagsges Hanna, E.: Meteorological effects of the solar eclipse of 11 August Becker & Erler, Leipzig, Germany, 1941. 1999, Weather, 55, 430–446, 2000. Wild, O., Zhu, X., and Prather, M. J.: Fast-j: Accurate simulation of Janjic, Z. I.: The step-mountain eta coordinate model: Further de- in- and below-cloud photolysis in tropospheric chemical models, velopment of the convection, viscous sub-layer, and turbulent J. Atmos. Chem., 37, 245–282, 2000. closure schemes, Mon. Weather Rev., 122, 927–945, 1994. Zanis, P., Zerefos, C. S., Gilge, S., Melas, D., Balis, D., Ziomas, I., Kanaya, Y., Fukuda, M., Akimoto, H., Takegawa, N., Komazaki, Gerasopoulos, E., Tzoumaka, P., Kaminski, U., and Fricke, W.: Y., Yokouchi, Y., Koike, M., and Kondo, Y.: Urban pho- Comparison of measured and modeled surface ozone concentra- tochemistry in central Tokyo: 2. Rates and regimes of oxi- tions at two different sites in Europe during the solar eclipse on dant (O( 3)+NO( 2)) production, J. Geophys. Res., 113, D6301, 11 August 1999, Atmos. Environ., 35, 4663–4673, 2001. doi:10.1029/2007JD008671, 2008. Zanis, P., Katragkou, E., Kanakidou, M., Psiloglou, B. E., Kazadzis, S., Bais, A., Blumthaler, M., Webb, A., Kouremeti, N., Karathanasis, S., Vrekoussis, M., Gerasopoulos, E., Lisaridis, Kift, R., Schallhart, B., and Kazantzidis, A.: Effects of total solar I., Markakis, K., Poupkou, A., Amiridis, V., Melas, D., Mi- eclipse of 29 March 2006 on surface radiation, Atmos. Chem. halopoulos, N., and Zerefos, C.: Effects on surface atmo- Phys., 7, 5775–5783, doi:10.5194/acp-7-5775-2007, 2007. spheric photo-oxidants over Greece during the total solar eclipse Koepke, P., Reuder, J., and Schween, J.: Spectral variation of the so- event of 29 March 2006, Atmos. Chem. Phys., 7, 6061–6073, lar radiation during an eclipse, Meteorol. Z., 10, 179–186, 2001. doi:10.5194/acp-7-6061-2007, 2007. Mims, F. M. and Mims, E. R.: Fluctuations in Column Ozone dur- Zaveri, R. A. and Peters, L. K.: A new lumped structure photochem- ing the Total Solar Eclipse of July 11, 1991, Geophys. Res. Lett., ical mechanism for large-scale applications, J. Geophys. Res., 20, 367–370, 1993. 104, 30387–30415, 1999. Mlawer, E. J., Taubman, S. J., Brown, P. D., Iacono, M. J., and Zaveri, R. A., Easter, R. C., Fast, J. D., and Peters, L. K.: Model for Clough, S. A.: Radiative transfer for inhomogeneous atmo- Simulating Aerosol Interactions and Chemistry (MOSAIC), J. spheres: RRTM, a validated correlated-k model for the long- Geophys. Res., 113, D13204, doi:10.1029/2007jd008782, 2008. wave, J. Geophys. Res., 102, 16663–16682, 1997. Zerefos, C. S, Balis, D. S., Meleti, C., Bais, A. F., Tourpali, K., Psiloglou, B. E. and Kambezidis, H. D.: Performance of the mete- Vanicek, K., Cappelani, F., Kaminski, U., Tiziano, C., Stubi, R., orological radiation model during the solar eclipse of 29 March Formenti, P., and Andreae, A.: Changes in environmental param- 2006, Atmos. Chem. Phys., 7, 6047–6059, doi:10.5194/acp-7- eters during the solar eclipse of August 11, 1999, over Europe, 6047-2007, 2007. Effects on surface UV solar irradiance and total ozone, J. Geo- Scheffler, H. and Elsässer, H.: Physik der Sterne und der Sonne, phys. Res., 105, 26463–26473, 2000. 535 pp., Bibliographisches Institut Zürich, Zurich, Switzerland, Zerefos, C. S., Balis, D. S., Zanis, P., Meleti, C., Bais, A. F., Tour- 1974. pali, K., Melas, D., Ziomas, I., Galani, E., Kourtidis, K., Pa- Shao, M., Ren, X. R., Wang, H. X., Zeng, L. M., Zhang, Y. H., and payannis, A., and Gogosheva, Z.: Changes in surface UV so- Tang, X. Y.: Quantitative relationship between production and lar irradiance and ozone over the Balkans during the eclipse of removal of OH and HO2 radicals in urban atmosphere, Chinese 11 August 1999, Adv. Space Res., 27(12), 1955–1963, 2001. Sci. Bull., 49, 2253–2258, doi:10.1360/04wb0006, 2004. Zhang, Q., Streets, D. G., Carmichael, G. R., He, K. B., Huo, H., Srivastava, G. P., Pakkir, M. P. M., and Balwalli, R. R.: Ozone con- Kannari, A., Klimont, Z., Park, I. S., Reddy, S., Fu, J. S., Chen, centration measurements near the ground at Raichur during the D., Duan, L., Lei, Y., Wang, L. T., and Yao, Z. L.: Asian emis- solar eclipse of 1980, Proceedings of Indian Natural Sciences sions in 2006 for the NASA INTEX-B mission, Atmos. Chem. Academy, A48(3), 138–142, 1982. Phys., 9, 5131–5153, doi:10.5194/acp-9-5131-2009, 2009. www.atmos-chem-phys.net/11/8075/2011/ Atmos. Chem. Phys., 11, 8075–8085, 2011
You can also read