The Effects of Acidic and Basic Pumice on Physico-Mechanical and Durability Properties of Self-Compacting Concretes
←
→
Page content transcription
If your browser does not render page correctly, please read the page content below
Green Building & Construction Economics
http://ojs.wiserpub.com/index.php/GBCE/

Research Article

The Effects of Acidic and Basic Pumice on Physico-Mechanical and
Durability Properties of Self-Compacting Concretes

Hasan Erhan Yücel , Hatice Öznur Öz * , Muhammet Güneş

Department of Civil Engineering, Nigde Omer Halisdemir University, 51240 Nigde, Turkey
E-mail: oznuroz@ohu.edu.tr

Received: 18 August 2020; Revised: 09 September 2020; Accepted: 10 September 2020

Abstract: In this study, properties of self-compacting concretes (SCCs) containing acidic and basic pumice (AP-BP)
was investigated. SCCs incorporating AP-BP (SCCAs-SCCBs) were produced with constant slump flow diameter of
720 ± 20 mm and 690 ± 20 mm by adjusting superplasticizer (SP), respectively. Control mixture was designed with
totally crushed stone aggregate. SCCAs and SCCBs could be produced up to 100% coarse AP with 20% increments and
60% coarse BP with 10% increments, respectively, to ensure the desired limit values for SCC. Firstly, fresh properties
of SCCs were determined. Then, the mechanical and durability properties of SCCs were measured at 28 and 56 days.
Test results indicated that workability properties of SCCAs are markedly higher than that of SCCBs. Additionally,
mechanical and durability performances of SCCs decreased with increasing of AP and BP. The compressive strengths
of SCCs containing 60% AP and BP decreased approximately 28-29% and 22-24%, compared to the control mixture,
respectively. Similarly, modulus of elasticity of same mixtures decreased around 35-39% and 17-19%, respectively.
However, all results indicated that SCCs produced with AP and BP provided the available limits in the design of SCC.
Additionally, SCCBs exhibited higher performance than SCCAs in terms of hardened properties. Moreover, high
correlation coefficients (R2 > 0.89) between the durability and mechanical properties were found for SCCs.

Keywords: self-compacting concrete, acidic pumice, basic pumice, physico-mechanical and durability properties,
correlation

1. Introduction
     Self-compacting concrete (SCC) is an innovative and indispensable concrete type which capable of filling up the
formwork, providing better compaction, passing-ability in restricted and confined areas without segregation or bleeding
by self-weight thanks to its high workability. Therefore, SCC provides reduction in the labor cost because of no need
vibration and gaining time [1-3].
     Water/binder (w/b) ratio and the quantity of coarse aggregate used in the SCC are lower than those of conventional
concrete. Therefore, in order to avoid the addition of a large quantity of cement, SCCs contain alternative cementitious
minerals such as silica fume, metakaolin, fly ash (FA), blast furnace slag, lime powder, natural pozzolan and
nanoparticles. These minerals can prevent separation of the larger particles in the fresh mixture and gain additional
strength by pozzolanic reaction in the hardened state [4-7]. However, the workability, the main design parameter of
SCC, can be improved by the incorporation of FA with spherical shape [8]. Due to storage problems of FA, it causes
Copyright ©2020 Hatice Öznur Öz, et al.
This is an open-access article distributed under a CC BY license
(Creative Commons Attribution 4.0 International License)
https://creativecommons.org/licenses/by/4.0/

Volume 1 Issue 1|2020| 21                                                                Green Building & Construction Economics
great damage to the environment by pollution of air and water. Turkey has 11 thermal power plants and these plants burn
annually 50 million tons of lignite coal. Approximately 12 million tons /year of FA obtained from coal are left in the
natural environment as waste [9]. Less than 1% of the FA from thermal power plants in Turkey can be used in building
applications. By 2020, 50 million tonnes of waste ash is expected to occur annually in thermal power plants [9, 10].
However, despite of the storage issues of FA, it has been utilized in the limited area of construction industry. The use of
FA in the production of concrete is extremely important due to environmental effect as well as the sustainable concrete
development [11].
      SCCs cause more lateral loads to the structures and increase the dead load of the structures during the earthquake.
Therefore, utilization of lightweight aggregates (LWAs) in the production of concrete provides significant benefits
such as reducing dead loads and formwork pressure, increasing the resistance to earthquake thanks to the reduction
of the self-weight of the structures [11, 12]. Moreover, not only the problem of segregation of LWAs can prevent but
also the workability property of SCC can be improved by LWA [13]. The natural LWAs can be exemplified as pumice,
diatomite, perlite, vermiculite, pozzolan, tuff, volcanic cinder, scoria, bottom ash and oil palm shell. Moreover, artificial
lightweight aggregates such as clay, expanded clay, slag, slate and shale are produced via special process [11, 14].
In recent years, there has been focused on usage of pumice aggregates (PAs) as the most popular natural lightweight
aggregate in the producing of lightweight concretes in Turkey [15]. Pumice is a material of volcanic origin and
occurs naturally. Moreover, pumice occurs as a result of the disentanglement of gases in the course of the formation
of lava. While total pumice reserve of the world is around 18 billion m3, total pumice reserve of Turkey is around 7.4
billion m3 [16]. Specific structure of pumice has been consisted by air voids or bubbles when gases in molten lava are
trapped during cooling [17]. Therefore, pumice ensures significant advantages such as high sound and heat insulation
property and low weight by the way of continuous and discontinuous porous structure [18, 19]. In addition, pumice is
characterized a high porosity and a low elasticity modulus [20]. Two types of pumices are formed as a result of volcanic
activities; acidic pumice (AP) and basic pumice (BP). Basic pumice can also be termed as basaltic pumice or scoria [21].
Acidic pumice with white and off-white color has a hardness of 5-6 according to Mohs scale and a density of 0.5-1g /
cm3. The BP has a hardness of 5-6 and a density of 1-2 g/cm3 and it can be dark and brownish blackish colored [21, 22].
Additionally, AP has lower rough surface with respect to BP [23, 24].
      When the previous studies are examined, Değirmenci and Yilmaz [25] reported 75% and 60.7% decrease at 28
days for compressive and flexural strengths of mortar including 100% pumice in the dimensions of 0-4 mm compared
to the control mixture, respectively. Karakoç et al. [26] showed that compressive strength, ultrasonic pulse velocity
and relative dynamic modulus of elasticity of high strength concretes were reduced with the increasing ratios of PA
(in 0-2 mm grain size). Moreover, for the same study [26], at the end of 300 freezing and thawing cycles, porosity
was increased up to 12% for high strength concrete incorporating PA. Gökçe et al. [27] stated that lightweight reactive
powder concrete can be developed with including pumice as fine aggregate (size 0-1 mm) with the compressive strength
of 69 and 176 MPa. Kabay et al. [28] determined lower mechanical performance of concretes incorporating 50% and
100% pumice (size 1-4 mm). Hossain et al. [18] observed 28%, 27% and 30% reduction at 28 days for compressive
strength, modulus of elasticity and tensile strength with including pumice (size 0.15-4.75 mm), respectively. However,
Kaffetzakis and Papanicolaou [29] reported that SCC with pumice considerably increased bond strength. Minapu et
al. [30] indicated that the compressive, tensile and flexural strengths of concretes designed with 10%-50% pumice
decreased 5%-22%, 9%-35% and 10%-53%, respectively. Similarly, Kashyap and Sasikala [31] determined that the
compressive strength of concretes incorporating pumice in the range of 10% and 40% reduced between 9%-21% at 28
days. Hossain et al. [18] determined that mechanical performance of the concrete decreased and drying shrinkage of
the concrete increased with increase in coarse lightweight volcanic PA ratio used instead of coarse gravel aggregate.
Pravallika and Rao [32] observed reduction in the range of 7%-47% and 1%-48% at 7 and 28 days for compressive
of concretes containing 10%-50% pumice. Splitting tensile strength decreased by 9%-35% and 5%-33% at 7 and 28
days, respectively. The reduction in the 7 and 28 days flexural strength was 3%-31% and 0.61%-30.36%, respectively.
Additionally, Sancak et al. [33], Parhizkar et al. [34], Değirmenci and Yılmaz [25] and Kurt et al. [35, 36] observed
higher water absorption of concrete incorporating pumice compared to control concrete.
      Considering the effect of pumice aggregate on characteristics of self-compacting lightweight concrete (SCLC),
Gönen and Yazıcıoğlu [37] showed that SCLC incorporating perlite had lower compressive strength than that of SCLC
designed with BP at 28 days. On the other hand, compressive strengths per unit weight of SCLCs are higher than those

Green Building & Construction Economics                                                           22 | Hatice Öznur Öz, et al.
of SCCs without LWA. Kadiroğlu [38] indicated that compressive, splitting tensile and flexural strength values of SCC
along with crushed stone aggregate is higher than that of SCLC incorporating PA in the ratios of approximately 68%,
16% and 30%, respectively. Also, it was determined that, the water absorption rates of SCLCs are considerably higher
than those of normal weight concrete. Additionally, Topçu and Uygunoğlu [39] reported that SCLC with LWAs (PA,
volcanic tuff and diatomite) having lower unit weight has lower physical and mechanical properties. In addition to these
properties, apparent porosity and water absorption values of SCC increased with increase in LWAs.
As evidenced by previous studies, there are some studies on the PA usage as LWA in the SCC. These studies are
usually focused on the workability or mechanical performances of SCLC incorporating AP. In addition, the comparative
effect of AP and BP on the workability, mechanical and durability properties of SCC has not been investigated. This
study has been presented the test results obtained from the effects of two types of PA on the workability, mechanical and
durability performances of SCC. Moreover, the manufacture of lightweight concrete is in most countries an extremely
mechanized industry depending on excellent accuracy and automation. This manufacture has to match strict standards
that describe properties determined for the products. These may include denotations on strength, sizes, insulating
properties, weather resistance and fire resistance. PA can be utilized as lightweight aggregates in concrete that meets all
these requirements [15].
In the view of literature reviews, it was investigated the physico-mechanical performances of SCC designed with
coarse AP and BP. Therefore, at first, the main design parameters such as the w/b and replacement ratio of AP and
BP with crushed stone aggregate were determined to obtain the desired workability limitations of SCC. After that,
control mixture (SCC-C) was produced with crushed stone aggregate without AP and BP. Self-compacting concrete
incorporating AP (SCCA) and self-compacting concrete incorporating BP (SCCB) were produced by using AP in the
ratios of 20%, 40%, 60%, 80% and 100% and BP in the ratios of 20%, 30%, 40%, 50% and 60% instead of the crushed
stone, respectively. Therefore, a total of 11 SCC mixes were produced by using LWAs. Finally, compressive, splitting
tensile and flexural strengths, modulus of elasticity, water sorptivity, water permeability and rapid chloride permeability
tests were applied at 28 and 56 days, respectively.
2. Material and methods
2.1 Cement, FA and SP
Ordinary Portland cement (CEM I 42.5R similar to ASTM I type cement) and Class F FA as a second binder
material was used in all SCCs. 20% Class F FA was added to the all mixtures instead of cement. Physical properties and
chemical compositions of cement and FA used in the design of SCCs are listed in Table 1. Superplasticizer (SP) was
utilized to reach the desired workability. Specific gravity of polycarboxylic ether type SP is 1.07.
Table 1. Physical properties and chemical compositions of cement and FA
Chemical Analysis (%) Cement FA
CaO 62.58 2.24
SiO2 20.25 57.2
Al2O3 5.31 24.4
Fe2O3 4.04 7.1
MgO 2.82 2.4
SO3 2.73 0.29
K20 0.92 3.37
Na2O 0.22 0.38
Loss of Ignition 2.96 1.52
Specific Gravity 3.15 2.04
Blaine Fineness (m2/kg) 326 379
Volume 1 Issue 1|2020| 23 Green Building & Construction Economics2.2 Aggregates
In this study, while crushed sand and natural sand were utilized as fine aggregate, crushed stone and pumice were
used as coarse aggregate. The natural sand from river was utilized to increase the workability of SCC because of natural
process of attrition tends to possess better smoother surface texture and shape. It also carries moisture that is trapped in
between the particles. Crushed sand with angular, rough surface structure and low grain size (0-2 mm) was used to meet
the strength and durability requirement of SCC. AP and BP aggregates were used instead of crushed stone aggregate
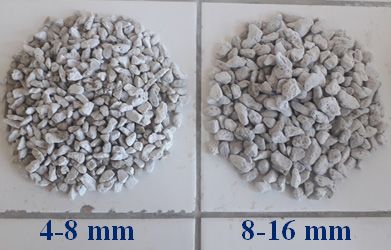
separably 4-8 mm and 8-16 mm grain sizes. Specific gravity values of crushed sand, natural sand, crushed stone, (4-
8) AP, (8-16) AP, (4-8) BP and (8-16) BP aggregates were determined as 2.67, 2.63, 2.65, 1.15, 0.99, 2.17 and 2.09,
respectively. Additionally, Figure 1 shows views of AP and BP, and Figure 2 presents SEM analysis results of AP and
BP. Figure 2 indicated that AP has lower rough surface and higher porous structure than that of BP. According to ASTM
C127 [40] water absorption capacity of AP in the 4-8 mm and 8-16 mm grain size was determined as 47.6% and 33.2%
respectively. However, water absorption capacity of BP in the 4-8 mm and 8-16 mm grain size was measured as 9.42%
and 8.15%, respectively. The high water absorption capacity of the AP can be explained with its high void ratio shown
in Figure 2.
4-8 mm 8-16 mm 4-8 mm 8-16 mm
(a) (b)
Figure 1. Images of (a) AP view, (b) BP view
200μm* EHT=15.00 kV Signal A= SE1 Date:15 Jan 2002 200μm* EHT=15.00 kV Signal A= SE1 Date:1 Jan 2002
WD=11.0mm Mag =53 X Time:0:40:30 WD=12.5mm Mag=48 X Time:0:40:58
(a) (b)
Figure 2. SEM view of (a) AP, (b) BP
2.3 Concrete mixture proportioning, casting
The batching and mixing procedure of SCCs was performed with respect to ASTM C192 / C192M [41] Mixture
ratios of SCCs is given in Table 2. A total of 11 SCC mixes were produced to investigate the effects of AP and BP on
Green Building & Construction Economics 24 | Hatice Öznur Öz, et al.the mechanical and durability properties of SCC. SCCs were produced along with total binder content (80% cement and
20% FA) of 550 kg/m3 and constant water/binder ratio (0.32). The process of replacement in the SCCA was conducted
in volume fractions from 20% to 100% at 20% increments. And then, the process of replacement in the SCCB was
conducted in volume fractions from 20% to 60% at 10% increments in order to obtain EFNARC limitations for the
desired workability [42]. Before mixing, because of the high water absorption of AP and BP (particularly AP), they were
submerged in water throughout 24 hours to ensure adequate saturation and then by wiping with the aid of the towel
before the mixing to make the pumice saturated surface dry condition. Control mixture of SCC (SCC-C) was prepared
with 100% crushed aggregates. In this study, the mixture codes were identified in accordance with the content and type
of pumice in mixture composition. For example, SCCA20 and SCCB20 are self-compacting concrete incorporating 20%
AP and self-compacting concrete incorporating 20% BP, respectively.
Table 2. Mixture ratios of SCCs (kg/m3)
Coarse Aggregate Fine Aggregate
Code Water / Binder Binder Crushed Stone Pumice Crushed Sand Natural Sand SP
4-16 mm 4-8 mm 8-16 mm 0-2 mm 0-4 mm
SCC-C 0.32 550 822 0 0 244.7 579.8 7.50
SCCA20 0.32 550 657.6 35.7 30.70 244.7 579.8 6.61
SSCA40 0.32 550 493.2 71.3 61.4 244.7 579.8 5.00
SCCA60 0.32 550 328.8 107 92.1 244.7 579.8 4.64
SCCA80 0.32 550 164.4 142.7 112.8 244.7 579.8 4.14
SSCA100 0.32 550 0 178.4 153.5 244.7 579.8 3.93
SCCB20 0.32 550 657.6 67.3 64.8 244.7 579.8 6.96
SCCB30 0.32 550 575.4 101 97.2 244.7 579.8 6.43
SCCB40 0.32 550 493.2 134.6 129.7 244.7 579.8 6.07
SCCB50 0.32 550 411 168.3 162.1 244.7 579.8 5.71
SCCB60 0.32 550 328.8 201.9 194.5 244.7 579.8 5.36
2.4 Mechanical tests
Compressive strengths of SCCs were identified using cubic samples in dimensions of 150 mm with respect to
ASTM C39 [43]. Splitting tensile strength was determined using cylindrical specimens in dimensions of 100×200 mm3
according to ASTM C496 [44]. Beam specimens in dimensions of 100×100×400 mm3 were utilized to measure flexural
strength values of SCCs according to ASTM C293 / C293M-10 [45]. Static modulus of elasticity test was measured with
respect to ASTM C469 [46]. The samples were loaded three times up to 40% of the final compressive load identified
on the compressive test. Readings for each cube were calculated by taking the average of the results obtained from the
samples at each testing age. These four basic mechanical properties were identified by calculating the average of the
values measured from 3 specimens.
2.5 Durability tests
Water sorptivity coefficient was determined on Ø100 ×50 mm3 cylinder specimens cut from Ø100 ×200 mm3
cylinders. Before the tests, the samples were dried at 100 ± 5°C through an oven till they achieved the fixed mass.
During the test, the concrete surface was left in contact with water. The test was applied to SCC mixtures at 28 and 56
days, respectively.
TS EN 12390-8 [47] was implemented to determine the water penetration depth of SCCs at 28 and 56 days. For this
reason, the bottom side of the specimen was subject to a 500 ± 50 kPa water pressure for 72 hrs. The cube specimens
were cut into the middle section and the maximum water penetration depth was determined as mm. According to TS
Volume 1 Issue 1|2020| 25 Green Building & Construction EconomicsEN 12390-8 [47], the maximum water penetration depth of concrete should not exceed 50 mm so that it is said to be
resistant to chemical attack of concrete. If the concrete will be exposed to aggressive condition, the maximum water
penetration depth of concrete should not exceed 30 mm with respect to TS EN 12390-8 [47].
An experimental setup with respect to the ASTM C1202 [48] was followed to measure the impedance of SCCs
against chloride ion permeability. Chloride ion permeability was determined on Ø100 ×50 mm cylinder specimens
cut from Ø100 ×200 mm cylinders. To prevent evaporation of water from the saturated sample, the vacuum-saturation
procedure was applied through 2 hours and then, paraffin was implemented onto the lateral surface of the samples. The
samples were located in a test cell. The current passing through the specimens was measured over a 6 hours period. 5
classes from ‘Negligible’ to ‘High’ were categorized according to ASTM C1202 [48] depending on total coulomb value.
3. Results and discussions
3.1 Fresh properties
SCCAs and SCCBs were designed to acquire a slump flow diameter of 720 ± 20 mm and 690 ± 20 mm by adjusting
the quantity of SP, respectively [42]. AP was improved the workability of SCCs by decreasing of T500 slump time and
V-funnel flow time as well as increasing of slump flow and L-box height-ratio [24]. The main reason for the increase
workability of AP is low unit weight. Additionally, the SP ratio was reduced as the BP rate increased to provide the same
slump flow range in all SCC mixes. However, BP could be used up to 60% to provide the EFNARC limit values [42].
Therefore, for same mixture ratios, SCCBs has lower workability than the SCCAs. Moreover, SCCs incorporating BP
lead to increase T500 time and V-funnel flow time and to decrease slump flow and L-box height-ratio with decreasing
SP [23]. Fresh concrete properties provided the EFNARC limitations [42]. The fresh properties of SCCs incorporating
AP and BP are given in Table 3. Designed concretes were produced in accordance with the SF2 class (660-750 mm
slump flow diameter) specified in EFNARC [42].
Table 3. Experimental results of fresh concrete
T500 time Slump flow diameter V-funnel flow time L-box height-ratio
Code Number
s mm s h2 / h1
SCC-C 3.53 700 17.02 0.85
SCCA20 3.51 710 15.70 0.87
SSCA40 3.31 720 14.49 0.88
SCCA60 2.87 720 11.47 0.91
SCCA80 2.67 730 10.24 0.94
SSCA100 2.29 730 08.53 0.96
SCCB20 3.54 700 18.25 0.84
SCCB30 3.67 695 19.42 0.84
SCCB40 3.86 680 20.04 0.83
SCCB50 4.01 670 21.17 0.82
SCCB60 4.21 670 23.00 0.80
3.2 Compressive strength and modulus of elasticity
Compressive strength and modulus of elasticity results of SCCs are presented graphically in Figure 3 and Figure
4, respectively. Maximum compressive strength of SCC mixtures was obtained from control concrete (SCC-C) for both
ages. However, compressive strength was reduced as the replacement ratio of pumice was increased. The attenuation
ratio for compressive strength was obtained as 9.6%, 19.2%, 28.4%, 40.2% and 54.3% for SCCA20, SCCA40,
SCCA60, SCCA80, SCCA100 compared to control mixture at 28 days, respectively. Additionally, these mixtures had
Green Building & Construction Economics 26 | Hatice Öznur Öz, et al.a decrease in the ranges of 9.9% 19.2%, 28.7%, 38.9% and 50.5% compared to SCC-C for the compressive strength
at 56 days, respectively. Adding BP to mixes, similarly, reduced compressive strength of mixtures. The compressive
strength values of the SCCB60 mixture decreased to 22.9% and 23.5% at 28 and 56 days, respectively. However, for the
same replacement ratios, the compressive strengths of SCCAs were lower than those of SCCBs. For example, while the
compressive strength values of the SCCA20 was found as 60 MPa and 67.4 MPa, the compressive strength values of the
SCCB20 mixture was 63.6 MPa and 70.4 MPa at 28 and 56 days, respectively.
The modulus of elasticity of concrete varies depending on the type of aggregates, the volume of the cement, the
hydrated cement matrix and the water/binder ratio [39, 49]. Therefore, the modulus of elasticity of SCC varied with
increased amount of AP and BP. For example, modulus of elasticity for SCC-C, SCCA60 and SCCB60 mixtures
were determined as 35.1 GPa, 21.4 GPa and 28.4 GPa at 28 days, and 37.7 GPa, 24.7 GPa and 31.1 GPa at 56 days,
respectively. According to these results, modulus of elasticity values of the SCCAs is lower than that of SCCBs.
SCC-C at 28 days SCC-C at 56 days SCCAs at 28 days
SCCAs at 56 days SCCBs at 28 days SCCBs at 56 days
80
70
Compressive strenght (MPa)
60
50
40
30
20
10
0
0 20 30 40 50 60 80 100
Volumetric pumice replacement (%)
Figure 3. Compressive strength of SCCs at 28 and 56 days
SCC-C at 28 days SCC-C at 56 days SCCAs at 28 days
SCCAs at 56 days SCCBs at 28 days SCCBs at 56 days
40
35
Modulus of elasticity (GPa)
30
25
20
15
10
5
0
0 20 30 40 50 60 80 100
Volumetric pumice replacement (%)
Figure 4. Modulus of elasticity of SCCs at 28 and 56 days
According to the compressive strength and modulus of elasticity test results, the mechanical performance of the
SCCs decreased with increased amount of AP and BP. Similarly, Rao et al. [50] determined 30%, 52%, 56%, 68% and
76% decrease at 28 days for compressive strength of concretes containing 20%, 40%, 60%, 80% and 100% pumice
Volume 1 Issue 1|2020| 27 Green Building & Construction Economicsas coarse aggregate substitution, respectively. Desai et al. [51] and Sivalingarao et al. [52] reported aproximately 17-
13%, 46-30%, 61-57% and 69-61% decrease at 28 days for compressive strength of concretes incorporating 25%,
50%, 75% and 100% pumice as coarse aggregate substitution, respectively. Literature studies [16, 53-55] indicated
that compressive strength of concretes reduced with including pumice. Other studies [18, 55, 57] demonstrated that
the modulus of elasticity of concrete decreased with including of pumice. Reductions in the compressive strength
and modulus of elasticity values at 28 and 56 days might be due to the weak structure (porous structure ranged from
completely open to completely closed) of PAs [16, 18, 26, 39]. Moreover, an explanation for lower compressive
strength and modulus of elasticity of the SCCs incorporating PAs may be determined in the microstructure variation
of the SCC. The capillary pores in the SCC will be changed on a large scale by null pores that are the residuals of the
saturated PA (particularly AP) [26]. However, the test results indicated that SCCs incorporating BP were obtained
better results in terms of these two tests with respect to SCCs incorporating AP. It is known that compressive strength
changes depending on the density [26]. For example, many researches [18, 26, 37, 38] indicated that compressive
strength decreased due to the density reduced with increasing the usage ratio of LWA in place of the normal aggregate.
Therefore, this situation can be connected to fact that BP has higher density with respect to AP.
3.3 Splitting tensile strength
Splitting tensile strength values of SCCs are plotted in Figure 5. Minimum splitting tensile strengths of SCCs
was given from SCCA100 mixture at 28 and 56 days. As a result of comparisons between SCC-C and SCCA100, it
was observed a reduction in the proportions of 38.7% and 31.4% at 28 and 56 days, respectively. However, the range
of splitting tensile strength varied from 4.05 MPa to 5.08 MPa at 28 days and from 4.5 MPa to 5.5 MPa at 56 days,
depending on increased BP ratio. Similarly, Rajeswari and Sunilaa [54] observed that splitting tensile strength of
concretes incorporating 50%, 60% and 70% pumice reduced. In other study, Rao et al. [50] indicated that splitting
tensile strength of concretes designed with 20%, 40%, 60%, 80% and 100% pumice decreased 22%, 39%, 56%, 58%
and 65%, respectively. Gesoğlu et al. [58] demonstrated that splitting tensile strength of SCCs decreased with increased
LWAs due to the strength limitations of LWAs. It can be also clearly seen that for the same mixture ratios, the effect on
splitting tensile strengths of SCCs incorporating BP is higher than those of SCCAs. The effect of strength performances
of cement paste increases depending on increasing aggregate density. In addition to strength performances of concrete
containing LWA or varying aggregate types, other performance properties of concrete can be also determined by the
aggregate properties [39]. The study prepared by Andiç-Çakır and Hızal [59] indicated that the splitting tensile strengths
of concretes are depended on the aggregate density used in the mixture. Additionally, failure of SCCAs can be attributed
to the poor interfacial zone between cement paste and AP. The main reason for this is the high void ratio of the AP.
At the same time, it is estimated that there are stronger bonds between cement matrix and BP for SCCBs. This can be
explained with the fact that BP contains much less void than AP [39].
SCC-C at 28 days SCC-C at 56 days SCCAs at 28 days
SCCAs at 56 days SCCBs at 28 days SCCBs at 56 days
6
Splitting tensile strength (MPa)
5
4
3
2
1
0
0 20 30 40 50 60 80 100
Volumetric pumice replacement (%)
Figure 5. Splitting tensile strength of SCCs at 28 and 56 days
Green Building & Construction Economics 28 | Hatice Öznur Öz, et al.3.4 Flexural strength
The graphical presentation of flexural strength data of SCCs were presented in Figure 6. The flexural strength of
SCC-C is 1.1, 1.2, 1.3, 1.4, 1.5 (for 28 days) and 1.1, 1.2, 1.3, 1.4, 1.4 (for 56 days) times higher than those of the SCCs
incorporating 20%, 40%, 60%, 80% and 100% of AP, respectively. Therefore, flexural strength of SCCs reduced with
including AP. Hariyadi and Tamai [55] reported that the 28 days flexural strength of concretes incorporating 50% and
100% pumice coarse aggregate reduced up to 13% and 33%, respectively. In other study, Kiliç et al. [60] determined
around 58% decrease in the 28 days flexural strength of concretes incorporating fine and coarse pumice aggregates
compared to the control. Additionally, when LWAs such as AP was used in place of any material having high density
such as crushed stone, weaker bonds occured between AP and cement paste [61]. Similarly to the results of SCCAs,
comparative results of SCCB60 and SCC-C indicated that there was a decrease of 19.3% and 19.2% at 28 and 56 days,
respectively. When same replacement ratios were considered, flexural strength of SCCA60 were determined as 5.1 MPa
and 5.78 MPa for 28 and 56 days, however, flexural strength of SCCB60 is higher 7.3% and 1.7% than these values,
respectively. It can be explained that interlocking between PA and cement matrix is better for BP than AP due to the sur-
face of BP is more roughly than that of AP as seen in Figure 2 [39].
3.5 Water sorptivity and water permeability
Figure 7 and Figure 8 present the variation in the sorptivity coefficient and water penetration depth of SCCs at 28
and 56 days, respectively. The test data demonstrated that sorptivity coefficient increased with the increase of pumice
amount. Sorptivity coefficients were measured as 0.0775 mm/min0.5 and 0.0584 mm/min0.5 for SCC-C, 0.1205 mm/
min0.5 and 0.1008 mm/min0.5 for SCCA60 and 0.0957 mm/min0.5 and 0.078 mm/min0.5 for SCCB60 at 28 and 56 days,
respectively. According to these results, sorptivity coefficient of SCCAs was higher than that of SCCBs.
Water permeability test measures the depth of water penetration into concrete as a result of differential pressure.
According to test results, water penetration depth increased depending on the increase of pumice amount used in
the SCCAs and SCCBs. Similarly, Hossain et al. [18] noted the decrease ratios of 5.4%, 10.81% and 18.92% in the
12 weeks water permeability of concretes incorporating 50%, 75% and 100% pumice aggregate as coarse aggregate
substitution. Water penetration depth of SCC-C was found as 19.2 mm and 15.2 mm, however, SCCA60 had a water
penetration depth of 38.4 mm and 30.1 mm in comparison with SCCB60 having a water penetration depth of 28.6 mm
and 22.1 mm at 28 and 56 days, respectively. As seen in Figure 7, while all SCCs are resistant to chemical attack due to
having water penetration depth of less than 50 mm, however, SCC-C, SCCBs and SCCA20, SCCA40 (for only 56 days)
were resistant to aggressive media at 28 and 56 days [47].
SCC-C at 28 days SCC-C at 56 days SCCAs at 28 days
SCCAs at 56 days SCCBs at 28 days SCCBs at 56 days
8
7
6
Flexural strength (MPa)
5
4
3
2
1
0
0 20 30 40 50 60 80 100
Volumetric pumice replacement (%)
Figure 6. Flexural strength of SCCs at 28 and 56 days
Volume 1 Issue 1|2020| 29 Green Building & Construction EconomicsThe porous structure of the aggregates plays a major role on durability of concrete [26, 39, 62]. This situation is
supported by SEM analysis of AP and BP shown in Figure 2. In this figure, it can be seen that, AP has higher porous
structure and lower rough surface than those of BP. Therefore, durability properties of SCCBs are better than those of
SCCAs. Moreover, it can be expressed the water absorption capacity of AP and BP was higher than that of crushed
stone aggregate as well as the porous structure [37]. Test results indicated that adherence of SCC with AP due to its high
porous structure and low rough surface was fairly weak in comparison to SCC incorporating BP.
SCC-C at 28 days SCC-C at 56 days SCCAs at 28 days
SCCAs at 56 days SCCBs at 28 days SCCBs at 56 days
0.18
Water sorptivity coefficients (mm/min0.5)
0.16
0.14
0.12
0.10
0.08
0.06
0.04
0.02
0.00
0 20 30 40 50 60 80 100
Volumetric pumice replacement (%)
Figure 7. Water sorptivity coefficients of SCCs at 28 and 56 days
SCC-C at 28 days SCC-C at 56 days SCCAs at 28 days
SCCAs at 56 days SCCBs at 28 days SCCBs at 56 days
55
50
Water penetration depth (mm)
45
40
35
30
25
20
15
10
5
0
0 20 30 40 50 60 80 100
Volumetric pumice replacement (%)
Figure 8. Water penetration depth of SCCs at 28 and 56 days
3.6 Rapid chloride permeability
The resistance chloride ion penetration of concrete is expressed as the total charged passed in Coulombs-C.
According to chloride ion penetrability expressed in ASTM C1202 [48], the total charge passed through SCCAs and
SCCBs was presented graphically in Figure 9. As shown in Figure 9, chloride-ion permeability increased along with
the increment of AP and BP at 28 and 56 days. Considering the experimental study at 28 days, the total charge passed
through for SCCs were determined in the range of 2000-3500 C for SCCAs and 2000-3000 C for SCCBs. Therefore,
according to ASTM C1202 [48], all SCCs have moderate chlorine ion permeability for 28 days. However, because of
Green Building & Construction Economics 30 | Hatice Öznur Öz, et al.reduction void ratio of the samples with longer curing times, the 56 days values of SCC mixtures provided low chloride
ion permeability in terms of ASTM C1202 [48]. The poor performance in terms of chloride ion permeability can be
depend upon the poor and weak quality due to porous micro and macro structures of AP and BP aggregates. Compared
with SCCAs and SCCBs, chloride ion permeability of SCCBs was closer to SCC-C due to porous structure of BP is
lower than that of AP. According to rapid chlorine permeability test results, all SCCs can be considered as a preventive
element for structures having chlorine attack risk. In addition, it is known that rapid chloride permeability test less
dependent on the ionic composition of pore solution and more on its porosity and pore tortuosity [63]. It is considered
that the presence in the pore system of AP and BP aggregates, have been affected negatively the formality of the pore
network tortuosity of SCC with their rough and hollow structure.
SCC-C at 28 days SCC-C at 56 days SCCAs at 28 days
SCCAs at 56 days SCCBs at 28 days SCCBs at 56 days
4000
3500
Moderate
Charge passed (Coulombs)
3000
2500
2000
Low
1500
1000
Very low
500
0
0 20 30 40 50 60 80 100
Volumetric pumice replacement (%)
Figure 9. Charge passed (Coulombs) of SCCs at 28 and 56 days
3.7 Relationships between the properties of SCCs
Correlation (relationship) of test results is one of the leading methods among the researchers for evaluation of
the reported experimental data. Theoretically, the main factor governing the mechanical and durability properties of
concrete / SCC are the pore structure of the matrix, the relative volume fractions of matrix and aggregate, and the
quality of interfacial transition zone. Occasionally researchers present the relation between different transport properties
to underline and significantly state the strength and durability properties of the concretes [55, 64-68]. In the current
paper, relationships between modulus of elasticity, flexural strength, splitting tensile strength, charge passed, water
penetration depth, water sorptivity coefficient with the compressive strength were presented Figure 10 for 28 and 56
days. According to analysis results, high correlations values between durability and other mechanical properties with
compressive strength of SCCs were found. As seen in Figure 10, since R2 > 0.90, all the correlation relations were
determined as the linear fit. In addition, order to determine the relationship between the mechanical properties of SCCs,
elasticity modulus-flexural strength, elasticity modulus-splitting tensile strength and flexural strength-splitting tensile
strength graphs were given in Figure 11 for 28 and 56 days. In these three graphs, the correlation coefficient was found
to be higher than 0.89 at 28 and 56 days. The relationships between the durability properties mentioned in the study
were also examined and the results were shown in Figure 11. Correlation coefficients indicated that the durability
characteristics of SCCs were highly relationship (> 0.91) with each other.
4. Conclusions
In this study, the effects of AP and BP on mechanical and durability performances of SCCs were investigated.
According to these tests data, the following statement can be drawn;
Volume 1 Issue 1|2020| 31 Green Building & Construction EconomicsThe workability of SCCs was improved by using PA. However, BP could be used up to 60% of replacement ratio
in order to obtain the desired workability limitations ratio for SCC.
The compressive strength, modulus of elasticity, splitting-tensile strength and flexural strength of SCC containing
100% AP compared to the control mixture reduced in the ranges of 50-55%, 61-67%, 31-38% and 28-33%, respectively.
The same properties of SCC containing 60% BP in comparison with the control mixture decreased in the ranges of 22-
24%, 17-19%, 16-20% and 19-20%, respectively. PA and the cement matrix was quite low due to the weak character of
the pumice. Additionally, considering same mixture proportions, it was demonstrated that reduction in the mechanical
performances of SCCBs is lower than those of SCCAs. This situation, it can be attributed that density of BP is higher
than that of AP.
Durability properties of SCCs deteriorated with increment amount of pumice used in the mixture. However, these
values of SCCAs are higher than those of SCCBs because of the high porous structure and low rough surface of AP
supported by SEM analysis.
Finally, high relationships between durability properties and other mechanical properties with compressive strength
of SCCs were determined. In addition, the mechanical performances and durability performances of SCCs were
correlated with each other. The fact that the lowest correlation coefficient was more than 0.89 showed that the findings
of the study were quite meaningful.
The role of AP and BP in SCC could be explored more comprehensively by performing scanning electron
microscopy (SEM) and mercury industry porosimetry (MIP) analyses on SCCs. Thus, this study could be enriched in
microstructural terms. This situation can be considered as the shortage of current research.
80 90
y = 1.477x + 16.197
Compressive strenght (MPa)
80
Compressive strenght (MPa)
70 R2 = 0.9412
28 days 28 days
60 70
56 days 56 days
50 60
y = 1.3946x + 15.689 50 y = -0.0464x + 134.11
40
R2 = 0.9616 40 R2 = 0.9164
30
30
20 y = -0.0278x + 128.03
20 R2 = 0.9737
10 10
0 0
0 5 10 15 20 25 30 35 40 0 500 1000 1500 2000 2500 3000 3500 4000
Modulus of elasticity (GPa) Charge passed (Coulombs)
90 80
y = 16.603x - 43.912
Compressive strenght (MPa)
Compressive strenght (MPa)
80 70
28 days R2 = 0.9264 28 days
70 60
60 56 days 56 days
50
50 y = -1.2801x + 91.29
40 40
R2 = 0.9046
30 30
y = 14.605x - 30.608 y = -1.1377x + 88.24
20 20
R2 = 0.9345 R2 = 0.9382
10 10
0 0 0
0 1 2 3 4 5 6 7 8 10 20 30 40 50 60
Flexural strength (MPa) Water penetration depth (mm)
80 80
y = 18.359x - 26.084
Compressive strenght (MPa)
Compressive strenght (MPa)
70 70
28 days R2 = 0.9013 28 days
60 60
56 days 56 days
50 50
y = -489.19x + 100.05
40 40 R2 = 0.9387
y = 16.557x - 16.722
30 30
R2 = 0.9582 y = -414.59x + 96.24
20 20 R2 = 0.9546
10 10
0 0
0 1 2 3 4 5 6 0 0.05 0.1 0.15 0.2
Splitting tensile strength (MPa) Water sorptivity coefficient (mm/min0.5)
Figure 10. Correlation relations between durability and other mechanical properties with compressive strength
Green Building & Construction Economics 32 | Hatice Öznur Öz, et al.45 4000
y = 10.701x - 37.327
Modulus of elasticity (GPa)
40
Charge passed (Coulombs)
R2 = 0.8919 3500
35 28 days 28 days
3000
30 56 days 56 days y = 40.792x + 1436.5
2500 R2 = 0.9564
25
20 2000
y = 26.579x + 946.15
15 1500
R2 = 0.9181
10 1000
y = 10.186x - 31.548
5 500
R2 = 0.9192
0 0
0 1 2 3 4 5 6 7 8 0 10 20 30 40 50 60
Flexural strength (MPa) Water penetration depth (mm)
45 4000
y = 12.207x - 27.585
40
Modulus of elasticity (GPa)
Charge passed (Coulombs)
R2 = 0.9236 3500
28 days 28 days
35
3000
30 56 days 56 days y = 14618x + 1175.3
2500 R2 = 0.941
25
20 2000
15 1500
y = 10044x + 773.75
10 1000 R2 = 0.9315
y = 11.607x - 22.12
5 500
R2 = 0.9524
0 0
0 1 2 3 4 5 6 0 0.05 0.1 0.15 0.2
Splitting tensile strength (MPa) Water sorptivity coefficient (mm/min0.5)
8 60
y = 1.1017x + 1.0927
Water penetration depth (mm)
7 y = 356.34x - 6.1965
28 days R2 = 0.9659 50 28 days
Flexural strength (MPa)
6 R2 = 0.973
56 days 56 days
5 40
y = 1.1104x + 1.0489
4 30
R2 = 0.9838
3
20
2 y = 369.97x - 5.8335
1 10
R2 = 0.9726
0 0
0 1 2 3 4 5 6 0 0.05 0.1 0.15 0.2
Splitting tensile strength (MPa) Water sorptivity coefficient (mm/min0.5)
Figure 11. Correlation relations between mechanical properties, and correlation relations between durability properties
Conflict of interests
There is no conflict of interests associated with this publication and there is no financial fund for this work that can
affect the research outcomes.
References
[1] Ngo H-T, Kadri E-H, Kaci A, Ngo T-T, Trudel A, Lecrux S. Advanced online water content measurement for self-
compacting concrete production in ready-mixed concrete plants. Constr Build Mater. 2016; 112: 570-580.
[2] Teixeira S, Santilli A, Puente I. Analysis of casting rate for the validation of models developed to predict the
maximum lateral pressure exerted by self-compacting concrete on the vertical formwork. J Build Eng. 2016; 6:
215-224.
[3] Wasim M, Hussain RR. Passive film formation and corrosion initiation in lightweight concrete structures as
compared to self-compacting and ordinary concrete structures at elevated temperature in chloride rich marine
environment. Constr Build Mater. 2015; 78: 144-152.
[4] Dogan UA, Ozkul MH. The effect of cement type on long term transport properties of self-compacting concretes.
Constr Build Mater. 2015; 96: 641-647.
[5] Granata MF. Pumice powder as filler of self-compacting concrete. Constr Build Mater. 2015; 96: 581-590.
[6] Khalaj G, Nazari A. Modeling split tensile strength of high strength self compacting concrete incorporating
randomly oriented steel fibers and SiO2 nanoparticles. Constr Build Mater. 2008; 22: 1394-1401.
Volume 1 Issue 1|2020| 33 Green Building & Construction Economics[7] Khatib JM. Performance of self-compacting concrete containing fly ash. Constr Build Mater. 2008; 22: 1963-1971.
[8] Silva P, de Brito J. Electrical resistivity and capillarity of self-compacting concrete with incorporation of fly ash and
limestone filler. Adv Concr Constr. 2013; 1(1): 65-84.
[9] Demir İ. Uçucu külün hafif yapı malzemesi üretiminde kullanılması. Yapı Tek Elek Derg. 2005; 1: 21-24.
[10] Tütünlü F, Atalay Ü. Utilization of fly ash in manufacturing of building bricks. International Ash Utilization
Symposium USA. Lexington, USA: University of Kentucky; 2001. p.13.
[11] Öz HÖ. Properties of self-compacting concretes made with cold bonded fly ash lightweight aggregates [dissertation].
Gaziantep(Turkey); 2014.
[12] Gönen T, Yazıcıoğlu S. Pomza agregalı kendiliğinden yerleşen hafif betonların donma-çözülme direnci. Ulusal
Beton Kongresi Antalya. Turkey; 2015. p.192-201.
[13] Felekoğlu B. Kendiliğinden yerleşen betonun fiziksel ve mekanik özelliklerinin araştırılması. Yüksek Lisans Tezi
Dokuz Eylül University, Institute of Science, İzmir, Turkey; 2003. p.267.
[14] Mo KH, Alengaram UJ, Jumaat MZ, Liu MYJ, Lim J. Assessing some durability properties of sustainable
lightweight oil palm shell concrete incorporating slag and manufactured sand. J Clean Product. 2016; 112: 763-
770.
[15] Gündüz L. The effects of pumice aggregate / cement ratios on the low-strength concrete properties. Constr Build
Mater. 2008; 22: 721-728.
[16] Kurt M, Gül MS, Gül R, Aydin AC, Kotan T. The effect of pumice powder on the self-compactability of pumice
aggregate lightweight concrete. Constr Build Mater. 2016; 3: 36-46.
[17] Ulusu H, Aruntas HY, Gencel O. Investigation on characteristics of blended cements containing pumice. Constr
Build Mater. 2016; 118: 11-19.
[18] Hossain KMA, Ahmed S, Lachemi M. Lightweight concrete incorporating pumice based blended cement and
aggregate: Mechanical and durability characteristics. Constr Build Mater. 2011; 25: 1186-1195.
[19] Celik S, Family R, Menguc MP. Analysis of perlite and pumice based building insulation materials. J. Build. Eng.
2016; 6: 105-111.
[20] Wang X, Wu Y, Shen X, Wang H, Liu S, Yan C. An experimental study of a freeze-thaw damage model of natural
pumice concrete. Powder Tech. 2018; 339: 651-658.
[21] Bideci A, Gültekin AH, Yildirim H, Oymael S., Bideci Ӧ.S. Internal structure examination of lightweight concrete
produced with polymer-coated pumice aggregate. Compos Part B. 2013; 54: 439-447.
[22] Özkan ŞG, Tuncer G. Pomza madenciliğine genel bir bakış. Journal Of Engineering Sciences. 2001; 7(2): 269-276.
[23] Öz HÖ, Yücel HE, Güneş M. Bazik pomzanın kendiliğinden yerleşen betonların işlenebilirlik özellikleri üzerine
etkisi. Omer Halisdemir University J Eng Sci. 2017; 6(1): 90-97.
[24] Yücel HE, Öz HÖ, Kömür S, Güneş M. Asidik pomza ile üretilen kendiliğinden yerleşen betonların taze özellikleri.
Omer Halisdemir University J Eng Sci. 2017; 6(1): 83-89.
[25] Degirmenci N, Arin Y. Use of pumice fine aggregate as an alternative to standard sand in production of lightweight
cement mortar. Indian J Eng Mater Sci. 2011; 18: 61-68.
[26] Karakoç MB, Demirboğa R, Türkmen İ, Can İ. Modeling with ANN and effect of pumice aggregate and air
entrainment on the freeze-thaw durabilities of HSC. Constr Build Mater. 2011; 25: 4241-4249.
[27] Gökçe H, Sürmelioğlu Setenay S, Andiç-Çakir Ӧ. A new approach for production of reactive powder concrete:
lightweight reactive powder concrete (LRPC). Mater Struct. 2017; 50(1): 1-9.
[28] Kabay N, B. Kizilkanat A, Tüfekçi M. Effect of prewetted Pumice aggregate addition on concrete properties under
different curing conditions. Period Polytech Civ Eng. 2016; 60(1): 89-95.
[29] Kaffetzakis MI, Papanicolaou CG. Bond behavior of reinforcement in lightweight aggregate self-compacting
concrete. Constr Build Mater. 2016; 113: 641-652.
[30] Minapu L, Ratnam MKMV, Rangarahu U. Experimental study on light weight aggregate concrete with pumice
stone, silica fume and fly ash as a partial replacement of coarse aggregate. International J Innov Res Sci Eng Tech.
2014; 3(12): 18130-18138.
[31] Kashyap AMN, Sasikala G. An experimental study on compressive strength of steel fibre reinforced light weight
aggregate (pumice stone) concrete. Int J Eng Res Dev. 2014; 9(12): 21-25.
[32] Pravallika BD, Rao KV. The study on strength properties of light weight concrete using light weight aggregate. Int
J Sci Res. 2016; 5(6): 1735 -1739.
[33] Sancak E, Sari D, Simsek O. Effects of elevated temperature on compressive strength and weight loss of the light-
weight concrete with silica füme and superplasticizer. Cem Concr Compos. 2008; 30: 715-721.
[34] Parhizkar T, Najimi M, Pourkhorshidi AR. Application of pumice aggregate in structural lightweight concrete.
Green Building & Construction Economics 34 | Hatice Öznur Öz, et al.Asian J Civ Eng. (Building and Housing). 2012; 13(1): 43-54.
[35] Kurt M, Aydin AC, Gül MS, Gül R, Kotan T. The effect of fly ash to self-compactability of pumice Aggregate
lightweight concrete. Indian Academy of Sci Sad. 2015; 40(4): 1343-1359.
[36] Kurt M, Kotan T, Gül MS, Gül R, Aydin AC. The effect of blast furnace slag on the self-compactability of pumice
aggregate lightweight concrete. Indian Academy of Sci Sad. 2016; 41(2): 253-264.
[37] Gönen T, Yazıcıoğlu S. Kendiliğinden yerleşen hafif betonun mekanik özelliklerine kür ortamı ve agrega tipinin
etkisi. J Fac Eng Arch Gazi University. 2010; 25(3): 459-467.
[38] Kadiroğlu İ. Kendiliğinden yerleşen normal dayanımlı hafif beton üzerine deneysel bir çalışma. Batıçim Batı
Anadolu Çimento Sanayii A.Ş. İzmir; 2006. p.40-48.
[39] Topçu İB, Uygunoğlu T. Effect of aggregate type on properties of hardened self-consolidating lightweight concrete
(SCLC). Constr Build Mater. 2010; 24: 1286-1295.
[40] ASTM C127. Standard test method for specific gravity and absorption of coarse aggregate. Annual Book of ASTM
Standards. West Conshohocken, PA, USA: ASTM International; 2007.
[41] ASTM C192/C192M. Standard practice for making and curing concrete test specimens in the laboratory. Annual
Book of ASTM Standards. West Conshohocken, PA, USA: ASTM International; 2007.
[42] EFNARC. European guidelines for self-compacting concrete, specification and production and use. Association
House. UK; 2005. p.1-68.
[43] ASTM C39. Standard test method for compressive strength of cylindrical concrete specimens. Annual Book of
ASTM Standards. West Conshohocken, PA, USA: ASTM International; 2012.
[44] ASTM C496. Standard test method for splitting tensile strength of cylindrical concrete specimens. Annual Book of
ASTM Standards. West Conshohocken, PA, USA: ASTM International; 2011.
[45] ASTM C293/C293M-10. Standard test method for flexural strength of concrete. Annual Book of ASTM Standards.
West Conshohocken, PA, USA: ASTM International; 2010.
[46] ASTM C469. Standard test method for static modulus of elasticity and poisson’s ratio of concrete in compression.
Annual Book of ASTM Standards. West Conshohocken, PA, USA: ASTM International; 2010.
[47] TS EN 12390-8. Testing Hardened Concrete-Part 8: Depth of penetration of water under pressure. Turkish Standard
Institution. Ankara, Turkey; 2002.
[48] ASTM C1202. Standard test method for electrical indication of concrete’s ability to resist chloride ion penetration.
Annual Book of ASTM Standards. West Conshohocken, PA, USA: ASTM International; 2012.
[49] Chandra S, Berntsson L. Lightweight aggregate concrete: science, technology and applications. New York, USA:
William Andrew Publishing; 2002.
[50] Rao NS, Kumari YRR, Desai VB, Swami BLP. Fibre reinforced light weight aggregate (natural pumice stone)
concrete. Int J Sci Eng Res. 2013; 4(5): 158-161.
[51] Desai VB, Arjunappa KM, Sathyam A. An experimental investigation on mode-II fracture of light weight pumice
aggregate concrete. Int J Modern Eng Res. (IJMER). 2014; 4(12): 25-37.
[52] Sivalingarao N, Desai VB, Swami BLP, Mohanlal C. Strength properties of fibrous light weight concrete with
pumice aggregates and steel fibre. Fibours Light Weight Concrete. 2016; 52-58.
[53] Peter R, Kumar AA. Experimental investigation of floating concrete structure using light weight (natural pumice
stone) aggregate. World J Eng Res Tech. (WJERT). 2016; 2: 118-129.
[54] Rajeswari S, Sunilaa G. Experimental study of light weight concrete by partial replacement of coarse aggregate
using pumice aggregate. Int J Sci Eng Res. 2015; 50-53.
[55] Hariyadi, Tamai H. Enhancing the performance of porous concrete by utilizing the pumice aggregate. Pro Eng.
2015; 125: 732-738.
[56] Dolgun, O. Kendiliğinden yerleşen betonlarda öğütülmüş pomza kullanabilirliğinin araştırılması. Nigde University,
Institute of Science; 2010. p.101.
[57] Gündüz L, Uğur İ. The effects of different fine and coarse pumice aggregate / cement ratios on the structural
concrete properties without using any admixtures. Cem Concr Res. 2005; 35: 1859-1864.
[58] Gesoglu M, Guneyisi E, Ozturan T, Öz HÖ, Asaad DS. Permeation characteristics of self compacting concrete
made with partially substitution of natural aggregates with rounded lightweight aggregate. Constr Build Mater.
2014; 59: 1-9.
[59] Andic-Cakir O, Hizal S. Influence of elevated temperatures on the mechanical properties and microstructure of self
consolidating lightweight aggregate concrete. Constr Build Mater. 2012; 34: 575-583.
[60] Kiliç A, Atiș CD, Teymen A, Karahan O, Ari K. The effects of scoria and pumice aggregates on the strengths and
unit weight of lightweight concrete. Sci Res Essays. 2009; 4(10): 961-915.
Volume 1 Issue 1|2020| 35 Green Building & Construction Economics[61] Gesoğlu M, Guneyisi E, Khoshnaw G, İpek S. Abrasion and freezing-thawing resistance of pervious concretes
containing waste rubbers. Constr Build Mater. 2014; 73: 19-24.
[62] Lotfy A, Hossain KMA, Lachemi M. Durability properties of lightweight self-consolidating concrete developed
with three types of aggregates. Constr Build Mater. 2016; 106: 43-54.
[63] Shi C. Effect of mixing proportions of concrete on its electrical conductivity and the rapid chloride permeability
test (ASTM C1202 or ASSHTO T277) results. Cem Concr Res. 2004; 34: 537-545.
[64] Gesoğlu M, Güneyisi E, Özturan M, Mermerdas K. Permeability properties of concretes with high reactivity
metakaolin and calcined impure kaolin. Mater Struct. 2017; 47(4): 709-728. Avaiable from: http://dx.doi.org/10.1617/
s11527-013-0090-9.
[65] Boel V, Audenaert K, De Schutter G. Gas permeability and capillary porosity of self-compacting concrete. Mater
Struct. 2008; 41: 1283-1290.
[66] Medina M, Frías MI, de-Rojas S, Thomas C, Polanco JA. Gas permeability in concrete containing recycled ceramic
sanitary ware aggregate. Constr Build Mater. 2012; 37: 597-605.
[67] Hui-Sheng S, Bi-Wan X, Xiao-Chen Z. Influence of mineral admixtures on compressive strength, gas permeability,
and carbonation of high performance concrete. Constr Build Mater. 2009; 23: 1980-1985.
[68] Menadi B, Kenai S, Khatib J, Ait-Mokhtar A. Strength and durability of concrete incorporating crushed limestone
sand. Constr Build Mater. 2009; 23: 625-633.
Green Building & Construction Economics 36 | Hatice Öznur Öz, et al.You can also read